Eli Lifland comments:
\n\n\n\n\n\n\n\n\nI think it’s often helpful to be even more granular than this, and identify a particular person whose actions you want to inform. This helps make your goal more concrete, and even if it’s helpful for lots of people making it helpful for a single person is a good start and often a good proxy and provides good feedback loops (e.g. you can literally ask them if it was informative, and iterate based on their feedback, etc.).
\n
I definitely agree in the special case where the person acts optimally given their information. In practice, I fear that most people will (1) act predictably suboptimally, such that you should try to improve their actions beyond just informing them, and (2) predictably incorrectly identify what it would be best for them to be better informed about, such that you should try to inform them about other topics.\")\nInsofar as an agent (not necessarily an actor that can take directly important actions) has distinctive abilities and is likely to try to execute good ideas you have, it can be helpful to focus on *what the agent can do* or *how to leverage the agent’s distinctive abilities* rather than backchain from *what would be good*.[3](https://aiimpacts.org/framing-ai-strategy/#easy-footnote-bottom-3-3406 \"Suppose you have a magical superpower. You should not do strategy as usual, then try to use your superpower to achieve the resulting goals. Instead, you should start by reasoning about your superpower, considering how you can leverage it most effectively. Similarly, insofar as you or your organization or community has distinctive abilities, it can be helpful to focus on those abilities.\")\n**Affordances**\n---------------\n\n\nAs in the previous section, a natural way to improve the future is to identify relevant actors, determine what it would be good for them to do, and cause them to do those things. “Affordances” in strategy are “possible partial future actions that could be communicated to relevant actors, such that they would take similar actions.”[4](https://aiimpacts.org/framing-ai-strategy/#easy-footnote-bottom-4-3406 \"Alex Gray, personal communication, 9 Dec. 2022.\") The motivation for searching for and improving affordances is that there probably exist actions that would be great and relevant actors would be happy to take, but that they wouldn’t devise or recognize by default. Finding great affordances is aided by a deep understanding of how an actor thinks and its incentives, as well as a deep external understanding of the actor, to focus on its blind spots and identify feasible actions.[5](https://aiimpacts.org/framing-ai-strategy/#easy-footnote-bottom-5-3406 \"\n\n\n\n
Katja Grace comments:
\n\n\n\n\n\n\n\n\n\") Separately, the actor’s participation would sometimes be vital.\n\n\nAffordances are relevant not just to cohesive actors but also to non-structured groups. For example, for AI strategy, discovering affordances for ML researchers (as individuals or for collective action) could be valuable. Perhaps there also exist great possible affordances that don’t depend much on the actor– generally helpful actions that people just aren’t aware of.\n\n\nFor AI, two relevant kinds of actors are states (particularly America) and AI labs. One way to discover affordances is to brainstorm the kinds of actions particular actors can take, then find creative new plans within that list. Going less meta, I made lists of the kinds of actions states and labs can take that may be strategically significant, since such lists seem worthwhile and I haven’t seen anything like them.\n\n\nKinds of things states can do that may be strategically relevant (or consequences or characteristics of possible actions):\n\n\n* Regulate (and enforce regulation in their jurisdiction and investigate possible violations)\n* Expropriate property and nationalize companies (in their territory)\n* Perform or fund research (notably including through Manhattan/Apollo-style projects)\n* Acquire capabilities (notably including military and cyber capabilities)\n* Support particular people, companies, or states\n* Disrupt or attack particular people, companies, or states (outside their territory)\n* Affect what other actors believe on the object level\n\t+ Share information\n\t+ Make information salient in a way that predictably affects beliefs\n\t+ Express attitudes that others will follow\n* Negotiate with other actors, or affect other actors’ incentives or meta-level beliefs\n* Make agreements with other actors (notably including contracts and treaties)\n* Establish standards, norms, or principles\n* Make unilateral declarations (as an international legal commitment) [less important]\n\n\nKinds of things AI labs[6](https://aiimpacts.org/framing-ai-strategy/#easy-footnote-bottom-6-3406 \"It may also be useful to consider possible actors related to but distinct from a lab, such as a lab with a substantial lead, a major lab, or all major labs collectively.\") can do—or choose not to do—that may be strategically relevant (or consequences or characteristics of possible actions):\n\n\n* Deploy an AI system\n* Pursue capabilities\n\t+ Pursue risky (and more or less alignable systems) systems\n\t+ Pursue systems that enable risky (and more or less alignable) systems\n\t+ Pursue weak AI that’s mostly orthogonal to progress in risky stuff for a specific (strategically significant) task or goal\n\t\t- This could enable or abate catastrophic risks besides unaligned AI\n* Do alignment (and related) research (or: decrease the [alignment tax](https://forum.effectivealtruism.org/posts/63stBTw3WAW6k45dY/paul-christiano-current-work-in-ai-alignment) by doing technical research)\n\t+ Including interpretability and work on solving or avoiding alignment-adjacent problems like [decision theory and strategic interaction](https://www.lesswrong.com/posts/brXr7PJ2W4Na2EW2q/the-commitment-races-problem) and maybe [delegation involving multiple humans or multiple AI systems](http://acritch.com/arches/)\n* Advance global capabilities\n\t+ Publish capabilities research\n\t+ Cause investment or spending in big AI projects to increase\n* Advance alignment (or: decrease the alignment tax) in ways other than doing technical research\n\t+ Support and coordinate with external alignment researchers\n* Attempt to align a particular system (or: try to pay the alignment tax)\n* Interact with other labs[7](https://aiimpacts.org/framing-ai-strategy/#easy-footnote-bottom-7-3406 \"Holden Karnofsky says:My guess is that in many cases things one can do in a situation are by default not noticed by people, and there is a small set they do notice, because other people do them. I’m thinking outside of AI strategy, but figure it probably generalizes e.g. nobody had an affordance for making virgin/chad memes, then after someone did it, lots of people developed an affordance. People mostly don’t have an affordance for asking someone else to shut up, but if they see someone do it very smoothly, they might adopt whatever strategy that was. On technology safety, the Asilomar Conference I think gives people the affordance for doing ‘something like the Asilomar Conference’ (in various ways like). i.e. often the particular details of the doer don’t matter that much—the idea of doing a generally useful thing is appealing to a lot of different doers, and just everyone’s visual field is made mostly of blindspots, re actions.
\n
“Deals with other companies. Magma [a fictional AI lab] might be able to reduce some of the pressure to “race” by making explicit deals with other companies doing similar work on developing AI systems, up to and including mergers and acquisitions (but also including more limited collaboration and information sharing agreements).
– Benefits of such deals might include (a) enabling freer information sharing and collaboration; (b) being able to prioritize alignment with less worry that other companies are incautiously racing ahead; (c) creating incentives (e.g., other labs’ holding equity in Magma) to cooperate rather than compete; and thus (d) helping Magma get more done (more alignment work, more robustly staying ahead of other key actors in terms of the state of its AI systems).
– These sorts of deals could become easier to make once Magma can establish itself as being likely to lead the way on developing transformative AI (compared to today, when my impression is that different companies have radically different estimates of which companies are likely to end up being most relevant in the long run).”\")\n\t+ Coordinate with other labs (notably including coordinating to avoid risky systems)\n\t\t- Make themselves transparent to each other\n\t\t- Make themselves transparent to an external auditor\n\t\t- Merge\n\t\t- Effectively commit to share upsides\n\t\t- Effectively commit to [stop and assist](https://openai.com/charter/)\n\t+ Affect what other labs believe on the object level (about AI capabilities or risk in general, or regarding particular memes)\n\t\t- Practice [selective information sharing](https://www.lesswrong.com/posts/vZzg8NS7wBtqcwhoJ/nearcast-based-deployment-problem-analysis#SelectiveInformationSharing)\n\t\t- Demonstrate AI risk (or provide evidence about it)\n\t+ Negotiate with other labs, or affect other labs’ incentives or meta-level beliefs\n* Affect public opinion, media, and politics\n\t+ Publish research\n\t+ Make demos or public statements\n\t+ Release or deploy AI systems\n* Improve their culture or [operational adequacy](https://www.lesswrong.com/s/v55BhXbpJuaExkpcD/p/keiYkaeoLHoKK4LYA)\n\t+ Improve operational security\n\t+ Affect attitudes of effective leadership\n\t+ Affect attitudes of researchers\n\t+ Make a plan for alignment (e.g., [OpenAI’s](https://openai.com/blog/our-approach-to-alignment-research/)); share it; update and improve it; and coordinate with capabilities researchers, alignment researchers, or other labs if relevant\n\t+ Make a plan for what to do with powerful AI (e.g., [CEV](https://arbital.com/p/cev/) or some specification of [long reflection](https://forum.effectivealtruism.org/topics/long-reflection)), share it, update and improve it, and coordinate with other actors if relevant\n\t+ Improve their ability to make themselves (selectively) transparent\n* Try to better understand the future, the strategic landscape, risks, and possible actions\n* Acquire resources\n\t+ E.g., money, hardware, talent, influence over states, status/prestige/trust\n\t+ Capture scarce resources\n\t\t- E.g., language data from language model users\n* Affect other actors’ resources\n\t+ Affect the flow of talent between labs or between projects\n* Plan, execute, or participate in [pivotal acts](https://arbital.com/p/pivotal/) or [processes](https://www.lesswrong.com/posts/etNJcXCsKC6izQQZj/pivotal-outcomes-and-pivotal-processes)\n\n\n(These lists also exist on the [AI Impacts wiki](https://wiki.aiimpacts.org/), where they may be improved in the future: [Affordances for states](https://wiki.aiimpacts.org/doku.php?id=responses_to_ai:affordances:state_affordances) and [Affordances for AI labs](https://wiki.aiimpacts.org/doku.php?id=responses_to_ai:affordances:lab_affordances). These lists are written from an alignment-focused and misuse-aware perspective, but prosaic risks may be important too.)\n\n\nMaybe making or reading lists like these can help you notice good tactics. But innovative affordances are necessarily not things that are already part of an actor’s behavior.\n\n\nMaybe making lists of *relevant things similar actors have done in the past* would illustrate possible actions, build intuition, or aid communication.\n\n\nThis frame seems like a potentially useful complement to the standard approach [*backchain*](https://www.lesswrong.com/posts/DwoPGM8ytBCXrZpM7/backchaining-in-strategy) *from goals to actions of relevant actors*. And it seems good to understand *actions that should be items on lists like these*—both like understanding these list-items well and expanding or reframing these lists—so you can notice opportunities.\n\n\n**Intermediate goals**\n----------------------\n\n\n*No great sources are public, but illustrating this frame see “Catalysts for success” and “Scenario variables” in Marius Hobhannon et al.’s* [*What success looks like*](https://forum.effectivealtruism.org/posts/AuRBKFnjABa6c6GzC/what-success-looks-like#Catalysts_for_success) *(2022). On goals for AI labs, see Holden Karnofsky’s* [*Nearcast-based “deployment problem” analysis*](https://www.lesswrong.com/posts/vZzg8NS7wBtqcwhoJ/nearcast-based-deployment-problem-analysis) *(2022).*\n\n\nAn intermediate/instrumental goal is a goal that is valuable because it promotes one or more final/terminal goals. (“Goal” sounds discrete and binary, like “there exists a treaty to prevent risky AI development,” but often should be continuous, like “gain resources and influence.”) Intermediate goals are useful because we often need more specific and actionable goals than “make the future go better” or “make AI go better.”\n\n\n*Knowing what specifically would be good for people to do* is a bottleneck on *people doing useful things*. If the AI strategy community had better strategic clarity, in terms of knowledge about the future and particularly intermediate goals, it could better utilize people’s labor, influence, and resources. Perhaps an overlapping strategy framing is *finding or unlocking effective opportunities to spend money*. See Luke Muehlhauser’s [A personal take on longtermist AI governance](https://forum.effectivealtruism.org/posts/M2SBwctwC6vBqAmZW/a-personal-take-on-longtermist-ai-governance) (2021).[8](https://aiimpacts.org/framing-ai-strategy/#easy-footnote-bottom-8-3406 \"Muehlhauser says:\n\n\n\n
\n\n\n\n\n\")\nIt is also sometimes useful to consider *goals about particular actors*.\n\n\n**Threat modeling**\n-------------------\n\n\n*Illustrating threat modeling for the technical component of AI misalignment, see the DeepMind safety team’s* [*Threat Model Literature Review*](https://www.lesswrong.com/posts/wnnkD6P2k2TfHnNmt/threat-model-literature-review) *and* [*Clarifying AI X-risk*](https://www.lesswrong.com/posts/GctJD5oCDRxCspEaZ/clarifying-ai-x-risk) *(2022), Sam Clarke and Sammy Martin’s* [*Distinguishing AI takeover scenarios*](https://www.lesswrong.com/posts/qYzqDtoQaZ3eDDyxa/distinguishing-ai-takeover-scenarios) *(2021), and GovAI’s* [*Survey on AI existential risk scenarios*](https://forum.effectivealtruism.org/posts/2tumunFmjBuXdfF2F/survey-on-ai-existential-risk-scenarios-1) *(2021).*\n\n\nThe goal of [threat modeling](https://www.lesswrong.com/tag/threat-models) is deeply understanding one or more risks for the purpose of informing interventions. A great causal model of a threat (or *class of possible failures*) can let you identify points of intervention and determine what countering the threat would require.\n\n\nA related project involves assessing all threats (in a certain class) rather than a particular one, to help account for and prioritize between different threats.\n\n\nTechnical AI safety research informs AI strategy through threat modeling. A causal model of (part of) AI risk can generate a model of AI risk abstracted for strategy, with relevant features made salient and irrelevant details black-boxed. This abstracted model gives us information including necessary and sufficient conditions or intermediate goals for averting the relevant threats. These in turn can inform affordances, tactics, policies, plans, influence-seeking, and more.\n\n\n**Theories of victory**\n-----------------------\n\n\n*I am not aware of great sources, but illustrating this frame see Marius Hobhannon et al.’s* [*What success looks like*](https://forum.effectivealtruism.org/posts/AuRBKFnjABa6c6GzC/what-success-looks-like) *(2022).*\n\n\nConsidering theories of victory is another natural frame for strategy: consider scenarios where the future goes well, then find interventions to nudge our world toward those worlds. (Insofar as it’s not clear what *the future going well* means, this approach also involves clarifying that.) To find interventions to make our world like a victorious scenario, I sometimes try to find necessary and sufficient conditions for the victory-making aspect of that scenario, then consider how to cause those conditions to hold.[9](https://aiimpacts.org/framing-ai-strategy/#easy-footnote-bottom-9-3406 \"One useful output of related analysis is finding different necessary and sufficient conditions for victory than the most straightforward or common ones. For example, it is commonly assumed that there is a natural race for AI capabilities, but if we go back to first principles, we can find that on some views there’s no natural race because ‘winning the race’ is bad even for the winner. This observation can lead to new necessary and sufficient conditions for victory– perhaps in this case we guess that if AI labs appreciate AI risk they shouldn’t race or if they don’t they will, so victory conditions include propositions related to AI labs appreciate AI risk. And then the new framing of victory may be quite informative for interventions.\")\nGreat threat-model analysis can be an excellent input to theory-of-victory analysis, to clarify the threats and what their solutions must look like. And it could be useful to consider scenarios in which the future goes well and scenarios where it doesn’t, then examine the differences between those worlds.\n\n\n**Tactics and policy development**\n----------------------------------\n\n\n*Collecting progress on possible government policies, see GovAI’s* [*AI Policy Levers*](https://www.governance.ai/research-paper/ai-policy-levers-a-review-of-the-u-s-governments-tools-to-shape-ai-research-development-and-deployment) *(2021) and GCRI’s* [*Policy ideas database*](https://www.gcrpolicy.com/ideas)*.*\n\n\nGiven a model of the world and high-level goals, we must figure out how to achieve those goals in the messy real world. For a goal, what would cause success, which of those possibilities are tractable, and how could they become more likely to occur? For a goal, what are necessary and sufficient conditions for achievement and how could those occur in the real world?\n\n\n**Memes & frames**\n------------------\n\n\n*I am not aware of great sources on memes & frames in strategy, but see Jade Leung’s* [*How can we see the impact of AI strategy research?*](https://web.archive.org/web/20220702141246/https://www.effectivealtruism.org/articles/jade-leung-how-can-we-see-the-impact-of-ai-strategy-research) *(2019). See also the academic literature on framing, e.g. Robert Entman’s* [*Framing*](https://is.muni.cz/el/1423/podzim2018/POL256/um/Entman_1993_FramingTowardclarificationOfAFracturedParadigm.pdf) *(1993).*\n\n\n(“Frames” in this context refers to the lenses through which people interpret the world, not the analytic, research-y frames discussed in this post.)\n\n\nIf certain actors held certain attitudes, they would make better decisions. One way to affect attitudes is to spread [memes](https://www.lesswrong.com/tag/memetics). A meme could be *explicit agreement with a specific proposition*; *the attitude that certain organizations, projects, or goals are (seen as) shameful*; *the attitude that certain ideas are sensible and respectable or not*; or merely *a tendency to pay more attention to something*. The goal of meme research is finding good memes—memes that would improve decisions if widely accepted (or accepted by a particular set of actors[10](https://aiimpacts.org/framing-ai-strategy/#easy-footnote-bottom-10-3406 \"What it would be great for national security people to believe is distinct from what it would be great for machine learning people to believe. These differences are mostly due to relevance: for example, memes about particular US government interventions are very relevant to policy people and have little relevance to ML people. Differences are also due in part to it being optimal for different actors to have different attitudes; for example, perhaps it would be good if ML people believed AI is totally terrifying and bad if policy people believed AI is totally terrifying. Note also that how well a meme spreads, and how it could be better spread or stifled, differs by audience too.\")) and are tractable to spread—and figuring out how to spread them. Meme research is complemented by work actually causing those memes to spread.\n\n\nFor example, potential good memes in AI safety include things like *AI is powerful but not robust, and in particular [specification gaming or Goodhart or distributional shift or adversarial attack] is a big deal*. Perhaps *misalignment as catastrophic accidents* is easier to understand than *misalignment as powerseeking agents*, or vice versa. And perhaps *misuse risk* is easy to understand and unlikely to be catastrophically misunderstood, but less valuable-if-spread.\n\n\nA frame tells people what to notice and how to make sense of an aspect of the world. Frames can be internalized by a person or contained in a text. Frames for AI might include frames related to consciousness, Silicon Valley, AI racism, national security, or specific kinds of applications such as chatbots or weapons.\n\n\nHigher-level research could also be valuable. This would involve topics like *how to communicate ideas about AI safety* or even *how to communicate ideas* and *how groups form beliefs*.\n\n\nThis approach to strategy could also involve researching how to stifle harmful memes, like perhaps “powerful actors are incentivized to race for highly capable AI” or “we need a Manhattan Project for AI.”\n\n\n**Exploration, world-modeling, and forecasting**\n------------------------------------------------\n\n\nSometimes strategy greatly depends on particular questions about the world and the future.\n\n\nMore generally, you can reasonably expect that increasing clarity about important-seeming aspects of the world and the future will inform strategy and interventions, even without thinking about specific goals, actors, or interventions. For AI strategy, exploration includes central questions about the future of AI and relevant actors, understanding the effects of possible actions, and perhaps also topics like decision theory, acausal trade, digital minds, and anthropics.\n\n\n*Constructing a map* is part of many different approaches to strategy. This roughly involves understanding the landscape and discovering analytically useful concepts, like reframing *victory means causing AI systems to be aligned* to *it’s necessary and sufficient to cause the alignment tax to be paid, so it’s necessary and sufficient to reduce the alignment tax and increase the amount-of-tax-that-would-be-paid such that the latter is greater*.\n\n\nOne exploratory, world-model-y goal is a high-level understanding of the strategic landscape. One possible approach to this goal is creating a map of relevant possible events, phenomena, actions, propositions, uncertainties, variables, and/or analytic nodes.\n\n\n**Nearcasting**\n---------------\n\n\n*Discussing nearcasting, see Holden Karnofsky’s* [*AI strategy nearcasting*](https://www.lesswrong.com/posts/Qo2EkG3dEMv8GnX8d/ai-strategy-nearcasting) *(2022). Illustrating nearcasting, see Karnofsky’s* [*Nearcast-based “deployment problem” analysis*](https://www.lesswrong.com/posts/vZzg8NS7wBtqcwhoJ/nearcast-based-deployment-problem-analysis) *(2022).*\n\n\nHolden Karnofsky defines “AI strategy nearcasting” as\n\n\ntrying to answer key strategic questions about transformative AI, under the assumption that key events (e.g., the development of transformative AI) will happen in a world that is otherwise relatively similar to today’s. One (but not the only) version of this assumption would be “Transformative AI will be developed soon, using methods like what AI labs focus on today.”\n\n\nWhen I think about AI strategy nearcasting, I ask:\n\n\n* What would a near future where powerful AI could be developed look like?\n* In this possible world, what goals should we have?\n* In this possible world, what important actions could relevant actors take?\n\t+ And what facts about the world make those actions possible? (For example, some actions would require that a lab has certain AI capabilities, or most people believe a certain thing about AI capabilities, or all major labs believe in AI risk.)\n* In this possible world, what interventions are available?\n* Relative to this possible world, how should we expect the real world to be different?[11](https://aiimpacts.org/framing-ai-strategy/#easy-footnote-bottom-11-3406 \"Karnofsky says:We lack the strategic clarity and forecasting ability to know which “intermediate goals” are high-ROI or even net-positive to pursue (from a longtermist perspective). If we had more clarity on intermediate goals, we could fund more people who are effectively pursuing those goals, whether they are sympathetic to longtermism or not.
\n
“nearcasting can serve as a jumping-off point. If we have an idea of what the best actions to take would be if transformative AI were developed in a world otherwise similar to today’s, we can then start asking “Are there particular ways in which we expect the future to be different from the nearer term, that should change our picture of which actions would be most helpful?”\")\n\n\n* And how do those differences affect the goals we should have, and the interventions that are available to us?\n\n\nNearcasting seems to be a useful tool for\n\n\n* predicting relevant events concretely and\n* forcing you to notice how you think the world will be different in the future and how that matters.\n\n\n**Leverage**\n------------\n\n\n*I’m not aware of other public writeups on leverage. See also Daniel Kokotajlo’s* [*What considerations influence whether I have more influence over short or long timelines?*](https://www.lesswrong.com/posts/pTK2cDnXBB5tpoP74/what-considerations-influence-whether-i-have-more-influence) *(2020). Related concept:* [*crunch time*](https://www.lesswrong.com/posts/E7rhL9aij7yCCz9AR/what-s-going-on-with-crunch-time)*.*\n\n\nWhen doing strategy and planning interventions, what should you focus on?\n\n\nA major subquestion is: how should you prioritize focus between possible worlds?[12](https://aiimpacts.org/framing-ai-strategy/#easy-footnote-bottom-12-3406 \"Central examples of a “possible world” are the possible worlds described by the conditions human-level AI appears around 2030 or AI takeoff is fast.\") Ideally you would prioritize working on *the worlds that working on has highest expected value*, or something like *the worlds that have the greatest product of probability and how much better they would go if you worked on them*. But how can you guess which worlds are high-leverage for you to work on? There are various reasons to prioritize certain possible worlds, both for reasoning about strategy and for evaluating possible interventions. For example, it seems higher-leverage to work on making AI go well conditional on human-level AI appearing in 2050 than in 3000: the former is more foreseeable, more affectable, and more neglected.\n\n\nWe currently lack a good account of leverage, so (going less meta) I’ll begin one for AI strategy here. Given a baseline of weighting possible worlds by their probability, all else equal, you should generally:\n\n\n* Upweight worlds that you have more control over and that you can better plan for\n\t+ Upweight worlds with short-ish [timelines](https://www.lesswrong.com/tag/ai-timelines) (since others will exert more influence over AI in long-timelines worlds, and since we have more clarity about the nearer future, and since we can revise strategies in long-timelines worlds)\n\t+ Take into account future strategy research\n\t\t- For example, if you focus on the world in 2030 (or assume that human-level AI is developed in 2030) you can be deferring, not neglecting, some work on 2040\n\t\t- For example, if you focus on worlds in which important events happen without much advance warning or clearsightedness, you can be deferring, not neglecting, some work on worlds in which important events happen foreseeably\n\t+ Focus on what you can better plan for and influence; for AI, perhaps this means:\n\t\t- Short timelines\n\t\t- The deep learning paradigm continues\n\t\t- Powerful AI is resource-intensive\n\t\t- Maybe some propositions about risk awareness, warning shots, and world-craziness\n\t+ Upweight worlds where the probability of victory is relatively close to 50%[13](https://aiimpacts.org/framing-ai-strategy/#easy-footnote-bottom-13-3406 \"In particular, perhaps the tractability of a world with P(victory) = p is 4p(1-p) times the tractability of a world with P(victory) = 50%. Consider a binary between victory and doom, and assume that work making victory more probable in a world (monolithically and) linearly increases how prepared that world is, and a world’s P(victory) as a function of preparedness is logistic. The derivative of a logistic distribution’s CDF is proportional to p(1-p) at the point where the CDF’s value is p.
I use a logistic distribution because it’s simple, seems roughly reasonable, and it has a very nice relationship with the log odds ratio: using a logistic distribution is equivalent to assuming that work making victory more probable in a world (monolithically and) linearly increases log-odds of victory in that world. But a different distribution may be more principled or realistic. I weakly intuit that the true distribution is heavier-tailed than the logistic distribution, roughly speaking.
Note that this only works for ‘nice’ worlds– worlds where a logistic distribution is appropriate. We must reason differently about arbitrary sets of possible futures because a combination of logistics isn’t logistic. A combination of a 1%-doomed and a 99%-doomed world is just as intractable as each world individually. (And so we have to be careful about the definition of “world.” It may not be theoretically sound to treat the union of “AGI in 2030” worlds as a single world, for the purpose of the logistic distribution. Also note that this whole frame is flawed insofar as it assumes that a “world” like “AGI in 2030” has a certain probability and that your interventions on this world don’t affect other “worlds”– even though they should be almost as good for “AGI in 2031” as directly working on “AGI in 2031” would be. How to account for the relationship between P(victory) and tractability is an open question.)
A background assumption or approximation here is that there is a binary between victory and doom. But similar conclusions are correct given the messier reality, I think.\")\n\t+ Upweight more neglected worlds (think on the margin)\n* Upweight short-timelines worlds insofar as there is more non-AI existential risk in long-timelines worlds\n* Upweight analysis that better generalizes to or improves other worlds\n* Notice the possibility that you live in a simulation (if that is decision-relevant; unfortunately, the practical implications of living in a simulation are currently unclear)\n* Upweight worlds that you have better personal fit for analyzing\n\t+ Upweight worlds where you have more influence, if relevant\n* Consider side effects of doing strategy, including what you gain knowledge about, testing fit, and gaining [credible signals of fit](https://forum.effectivealtruism.org/posts/FwzHrWMZzCWNrEedQ/goals-we-might-have-when-taking-actions-to-improve-the-ea#Gaining_credible_signals_of_fit)\n\n\nIn practice, I tentatively think the biggest (analytically useful) considerations for weighting worlds beyond probability are generally:\n\n\n1. Short timelines\n\t1. More foreseeable[14](https://aiimpacts.org/framing-ai-strategy/#easy-footnote-bottom-14-3406 \"Sidenote: strategy research and particularly “intermediate goals” and “exploration, world-modeling, and forecasting” increases leverage over long-timelines worlds.\")\n\t2. More affectable\n\t3. More neglected (by the AI strategy community)\n\t\t1. Future people can work on the further future\n\t\t\t1. The AI strategy field is likely to be bigger in the future\n\t4. Less planning or influence exerted from outside the AI strategy community\n2. [Fast takeoff](https://www.lesswrong.com/tag/ai-takeoff)[15](https://aiimpacts.org/framing-ai-strategy/#easy-footnote-bottom-15-3406 \"See also Daniel Kokotajlo’s definition.\")\n\t1. Shorter, less foreseeable a certain time in advance, and less salient to the world in advance\n\t\t1. More neglected by the AI strategy community; the community would have a longer clear-sighted period to work on slow takeoff\n\t\t2. Less planning or influence exerted from outside the AI strategy community\n\n\n(But there are presumably diminishing returns to focusing on particular worlds, at least at the community level, so the community should diversify the worlds it analyzes.) And I’m most confused about\n\n\n1. Upweighting worlds where probability of victory is closer to 50% (I’m confused about what the probability of victory is in various possible worlds),\n2. How leverage relates to variables like *total influence exerted to affect AI* (the rest of the world exerting influence means that you have less relative influence insofar as you’re [pulling the rope](https://www.overcomingbias.com/2007/05/policy_tugowar.html) along similar axes, but some interventions are amplified by something like *greater attention on AI*) (and related variables like *attention on AI* and *general craziness due to AI*), and\n3. The probability and implications of living in a simulation.\n\n\nA background assumption or approximation in this section is that you allocate research toward a world and the research is effective just if that world obtains. This assumption is somewhat crude: the impact of most research isn’t so binary, being fully effective in some possible futures and totally ineffective in the rest.[16](https://aiimpacts.org/framing-ai-strategy/#easy-footnote-bottom-16-3406 \"Related concept: serial research requirements or non-parallelizable research tasks.\") And thinking in terms of *influence over a world* is crude: influence depends on the person and on the intervention. Nevertheless, reasoning about leverage in terms of *worlds to allocate research toward* might sometimes be useful for prioritization. And we might discover a better account of leverage.\n\n\nLeverage considerations should include not just *prioritizing between possible worlds* but also *prioritizing within a world*. For example, it seems high-leverage to focus on important actors’ blind spots and on certain important decisions or “crunchy” periods. And for AI strategy, it might be high-leverage to focus on the first few deployments of powerful AI systems.\n\n\n\n\n---\n\n\nStrategy work is complemented by\n\n\n1. actually executing interventions, especially causing actors to make better decisions,\n2. gaining resources to better execute interventions and improve strategy, and\n3. field-building to better execute interventions and improve strategy.\n\n\nAn individual’s strategy work is complemented by informing the relevant community of their findings (e.g., for AI strategy, the AI strategy community).\n\n\nIn this post, I don’t try to make an ontology of AI strategy frames, or do comparative analysis of frames, or argue about the AI strategy community’s prioritization between frames.[17](https://aiimpacts.org/framing-ai-strategy/#easy-footnote-bottom-17-3406 \"Regarding prioritization, briefly, I believe that the community currently does too much unfocused exploration (see e.g. most work by AI Impacts and GovAI) and strategy/governance/forecasting researchers would often benefit from focusing on a theory of change.\") But these all seem like reasonable things for someone to do.\n\n\nRelated sources are linked above as relevant; see also Sam Clarke’s [The longtermist AI governance landscape](https://forum.effectivealtruism.org/posts/ydpo7LcJWhrr2GJrx/the-longtermist-ai-governance-landscape-a-basic-overview) (2022), Allan Dafoe’s [AI Governance: Opportunity and Theory of Impact](https://forum.effectivealtruism.org/posts/42reWndoTEhFqu6T8/ai-governance-opportunity-and-theory-of-impact) (2020), and Matthijs Maas’s [Strategic Perspectives on Long-term AI Governance](https://forum.effectivealtruism.org/s/xTkejiJHFsidZ9hMo) (2022).\n\n\nIf I wrote a post on “Framing AI governance,” it would substantially overlap with this list, and it would substantially draw on [The longtermist AI governance landscape](https://forum.effectivealtruism.org/posts/ydpo7LcJWhrr2GJrx/the-longtermist-ai-governance-landscape-a-basic-overview). See also Allan Dafoe’s [AI Governance: A Research Agenda](https://www.governance.ai/research-paper/agenda) (2018) and hanadulset and Caroline Jeanmaire’s [A Map to Navigate AI Governance](https://forum.effectivealtruism.org/posts/tmxkRFx6HyhhvHdz4/a-map-to-navigate-ai-governance) (2022). I don’t know whether an analogous “Framing technical AI safety” would make sense; if so, I would be excited about such a post.\n\n\nMany thanks to Alex Gray. Thanks also to Linch Zhang for discussion of leverage and to Katja Grace, Eli Lifland, Rick Korzekwa, and Jeffrey Heninger for comments on a draft.\n\n\n**Footnotes**\n-------------\n\n\n\n\n\n\n\n\n\n", "url": "https://aiimpacts.org/framing-ai-strategy/", "title": "Framing AI strategy", "source": "aiimpacts.org", "source_type": "wordpress", "date_published": "2023-02-06T19:00:27+00:00", "paged_url": "https://aiimpacts.org/feed?paged=2", "authors": ["Zach Stein-Perlman"], "id": "ffc89bb005c93cbe42c65b04bb399431", "summary": []} {"text": "Product safety is a poor model for AI governance\n\n*Rick Korzekwa, February 1, 2023*\n\n\n*Note: This post is intended to be accessible to readers with relatively little background in AI safety. People with a firm understanding of AI safety may find it too basic, though they may be interested in knowing which kinds of policies I have been encountering or telling me if I’ve gotten something wrong.*\n\n\nI have recently encountered many proposals for policies and regulations intended to reduce risk from advanced AI. These proposals are highly varied and most of them seem to be well-thought-out, at least on some axes. But many of them fail to confront the technical and strategic realities of safely creating powerful AI, and they often fail in similar ways. In this post, I will describe a common type of proposal[1](https://aiimpacts.org/product-safety-is-a-poor-model-for-ai-governance/#easy-footnote-bottom-1-3402 \"They seem common to me, based mainly on conversations, posts, and presentations I’ve seen within the AI governance field. It is possible these kinds of proposals are rare, but memorable to me.\") and give a basic overview of the reasons why it is inadequate. I will not address any issues related to the feasibility of implementing such a policy.\n\n\n### Caveats\n\n\n* It is likely that I have misunderstood some proposals and that they are already addressing my concerns. Moreover, I do not recommend dismissing a proposal because it pattern-matches to product safety on the surface level.\n* These approaches may be good when combined with others. It is plausible to me that an effective and comprehensive approach to governing AI will include product-safety-like regulations, especially early in the process when we’re still learning and setting the groundwork for more mature policies.\n\n\nThe product safety model of AI governance\n-----------------------------------------\n\n\nA common AI policy structure, which I will call the ‘product safety model of AI governance’[2](https://aiimpacts.org/product-safety-is-a-poor-model-for-ai-governance/#easy-footnote-bottom-2-3402 \"I am not at all an expert on real product safety regulations. This is meant mainly as a useful comparison, not a criticism of product safety regulation in general.\"), seems to be built on the assumption that, while the processes involved in creating powerful AI may need to be regulated, the harm from a failure to ensure safety occurs predominantly when the AI has been deployed into the world. Under this model, the primary feedback loop for ensuring safety is based on the behavior of the model after it has been built. The product is developed, evaluated for safety, and either sent back for more development or allowed to be deployed, depending on the evaluation. For a typical example, here is a diagram from a US Department of Defense report on responsible AI:[3](https://aiimpacts.org/product-safety-is-a-poor-model-for-ai-governance/#easy-footnote-bottom-3-3402 \"DOD Responsible AI Working Council (U.S.). U.S. Department of Defense Responsible Artificial Intelligence Strategy and Implementation Pathway. 2022.
https://www.ai.mil/docs/RAI_Strategy_and_Implementation_Pathway_6-21-22.pdf\n\n\n\n\")\n[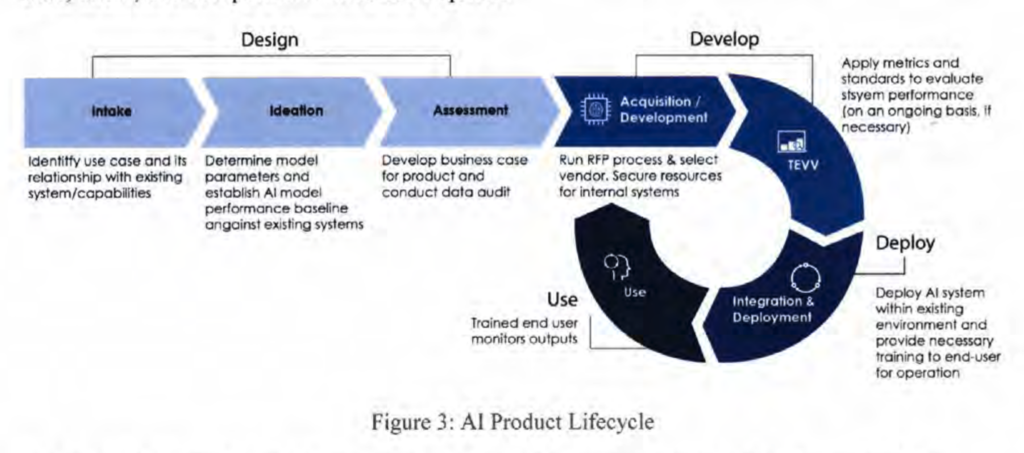](https://aiimpacts.org/wp-content/uploads/2023/02/Screenshot-2023-02-01-at-12.40.08-PM.png)\nThe system in this diagram is not formally evaluated for safety or performance until after “Acquisition/Development”.[4](https://aiimpacts.org/product-safety-is-a-poor-model-for-ai-governance/#easy-footnote-bottom-4-3402 \"The text of the article does not rule out intervention in development or basic research, but it does not seem to consider this a crucial aspect of ensuring safety.\")\nI do not find it surprising that this model is so common. Most of the time when we are concerned about risk from technology, we are worried about what happens when the technology has been released into the world. A faulty brake line on a car is not much of a concern to the public until the car is on public roads, and the facebook feed algorithm cannot be a threat to society until it is used to control what large numbers of people see on their screens. I also think it is reasonable to start with regulations that are already well-understood, and work from there. But this model, on its own, is inadequate for AI, for reasons I will explain in the next section.\n\n\nThis model fails when applied to advanced AI\n--------------------------------------------\n\n\nThis approach cannot be relied on to prevent the major risks associated with advanced AI. I will give two reasons for this, though there may be others.\n\n\n### Safety cannot (yet) be evaluated reliably in a fully-developed AI\n\n\nA fundamental difficulty of ensuring that AI will behave as intended is that examining an AI or observing its behavior during development and testing is not a reliable indicator of how it will behave once deployed. This is a difficult, unsolved problem that resists simple solutions.[5](https://aiimpacts.org/product-safety-is-a-poor-model-for-ai-governance/#easy-footnote-bottom-5-3402 \"For an accessible and engaging introduction: Christian B. The Alignment Problem: Machine Learning and Human Values. New York, NY: W.W. Norton & Company; 2020. \") I will not explain this problem in detail, but I will list some aspects of it here, along with real-world examples, and you can read more about it elsewhere.[6](https://aiimpacts.org/product-safety-is-a-poor-model-for-ai-governance/#easy-footnote-bottom-6-3402 \"Amodei D, Olah C, Steinhardt J et al. Concrete Problems in AI Safety. arXiv. Preprint posted online June 21, 2016. https://arxiv.org/pdf/1606.06565.pdf\")[7](https://aiimpacts.org/product-safety-is-a-poor-model-for-ai-governance/#easy-footnote-bottom-7-3402 \"Ngo R. The alignment problem from a deep learning perspective. arXiv. Preprint posted online August 30, 2022. https://arxiv.org/abs/2209.00626\")\nAI may learn approaches to problems or, if sufficiently advanced, acquire goals that result in behavior that seems to work in training but will fail in deployment.\n\n\n* A system trained to classify images performed extremely well, but only because it had learned to detect images based on their storage location.[8](https://aiimpacts.org/product-safety-is-a-poor-model-for-ai-governance/#easy-footnote-bottom-8-3402 \"From Hacker News user api:
“To give a specific example: I once wrote an objective function to train an evolving system to classify images, a simple machine learning test. After running it for only an hour or so, the system’s performance seemed spectacular, like way up in the 90’th percentile. This made me suspicious. The programs that had evolved did not seem complex enough, and past experiments had shown that it should take a lot longer to get something that showed reasonable performance.
After a lot of analysis I figured out what it was.
I was pulling test images from two different databases. One database had higher latency than the other. The bugs had evolved a timing loop to measure how long it took them to get their data (they were multi-threaded) and were basically executing a side-channel attack against the training supervisor.”
https://news.ycombinator.com/item?id=6269114
\")\n* A simulated robot was trained using human feedback. It was supposed to grasp an object, but instead it learned to place its hand between the object and the camera, giving the appearance of grasping it.[9](https://aiimpacts.org/product-safety-is-a-poor-model-for-ai-governance/#easy-footnote-bottom-9-3402 \"“in some domains our system can result in agents adopting policies that trick the evaluators. For example, a robot which was supposed to grasp items instead positioned its manipulator in between the camera and the object so that it only appeared to be grasping it, as shown below.”
OpenAI. “Learning from Human Preferences,” June 13, 2017. https://openai.com/blog/deep-reinforcement-learning-from-human-preferences/.
\")\n\n\nAI can find solutions to problems that cannot be reliably evaluated by humans.\n\n\n* An evolutionary algorithm for designing circuits on a real circuit board created a circuit that produced the desired output, but the researchers were unable to determine how it worked.[10](https://aiimpacts.org/product-safety-is-a-poor-model-for-ai-governance/#easy-footnote-bottom-10-3402 \"“It has proved difficult to clarify exactly how these circuits work. Probing a typical one with an oscilloscope has shown that it does not use beat frequencies to achieve the target frequency. If the transistors are swapped for nominally identical ones, then the output frequency changes by as much as 30%. A simulation was created that incorporated all the parasitic capacitance expected to exist within the physical circuit, but the simulated circuits failed to oscillate. The programmable switches almost certainly play an important role in the behaviour of the circuit and it is only possible to probe their input and output connections and not the circuitry in which they are embedded.”
Bird, Jon, and Paul Layzell. “The evolved radio and its implications for modelling the evolution of novel sensors.” In Proceedings of the 2002 Congress on Evolutionary Computation. CEC’02 (Cat. No. 02TH8600), vol. 2, pp. 1836-1841. IEEE, 2002.
\")\n\n\nAI with goals that are at odds with human interests will have an incentive to avoid behavior that reveals its goals.\n\n\n* Creatures undergoing simulated evolution learned to identify when they were in an evaluation environment and when they were in the “real” environment, and used this to hide their unwanted behavior.[11](https://aiimpacts.org/product-safety-is-a-poor-model-for-ai-governance/#easy-footnote-bottom-11-3402 \"“[Charles Ofria, the researcher] tried to disable mutations that improved an organism’s replication rate (i.e. its fitness). He configured the system to pause every time a mutation occurred, and then measured the mutant’s replication rate in an isolated test environment. If the mutant replicated faster than its parent, then the system eliminated the mutant; otherwise, the mutant would remain in the population…However, while replication rates at first remained constant, they later unexpectedly started again rising. After a period of surprise and confusion, Ofria discovered that he was not changing the inputs provided to the organisms in the isolated test environment. The organisms had evolved to recognize those inputs and halt their replication”
Lehman, Joel, Jeff Clune, Dusan Misevic, Christoph Adami, Lee Altenberg, Julie Beaulieu, Peter J. Bentley et al. “The surprising creativity of digital evolution: A collection of anecdotes from the evolutionary computation and artificial life research communities.” arXiv preprint arXiv:1803.03453 (2018).
\")\n\n\n### Unsafe AI can cause substantial harm before deployment\n\n\nUnlike most technologies, AI can pose a serious risk even during development and testing. As AI capabilities approach and surpass human capabilities, the capacity for AI to cause harm will increase and it will become more difficult to ensure that AI is unable to cause harm outside its development and testing environment. I will not go into lots of detail on this, but I will outline the basic reasons for concern.\n\n\n#### AI is likely to seek influence outside its intended domain\n\n\nWhether a given AI system will attempt to gain influence outside the environment in which it is trained and tested is difficult to determine, but we have ample reason to be cautious. Learning to create and execute plans toward a particular goal is something we should expect by default within a broad range of AI applications as capabilities increase[12](https://aiimpacts.org/product-safety-is-a-poor-model-for-ai-governance/#easy-footnote-bottom-12-3402 \"“Many real-world environments have symmetries which produce power-seeking incentives. In particular, optimal policies tend to seek power when the agent can be shut down or destroyed. Seeking control over the environment will often involve resisting shutdown, and perhaps monopolizing resources.”
Turner AM, Smith L, Shah R et al. Optimal Policies Tend to Seek Power. arXiv. Preprint posted online December 3, 2021. https://arxiv.org/abs/1912.01683
\"), and for a system to do well on real-world tasks, it will need to make use of information about the wider world. This is something that current language models are already doing on their own.[13](https://aiimpacts.org/product-safety-is-a-poor-model-for-ai-governance/#easy-footnote-bottom-13-3402 \"“As one early example, when Degrave [2022] prompted OpenAI’s ChatGPT language model to output the source code at its own URL, it hallucinated code which called a large language model with similar properties as itself. This suggests that the ChatGPT training data contained enough information about OpenAI for ChatGPT to infer some plausible properties of an OpenAI-hosted URL. More generally, large language models trained on internet text can extensively recount information about deep learning, neural networks, and the real-world contexts in which those networks are typically deployed; and can be fine-tuned to recount details about themselves specifically [OpenAI, 2022a]. We should expect future models to learn to consistently use this information when choosing actions, because that would contribute to higher reward on many training tasks.”
https://arxiv.org/abs/2209.00626
\") There are also examples of AI finding vulnerabilities that allow it to manipulate things it was not intended to have access to, such as a game-playing AI that exploited a glitch in the game to increase its score directly.[14](https://aiimpacts.org/product-safety-is-a-poor-model-for-ai-governance/#easy-footnote-bottom-14-3402 \"“In the second interesting solution (https://www. youtube.com/watch?v=meE5aaRJ0Zs), the agent discovers an in-game bug. First, it completes the first level and then starts to jump from platform to platform in what seems to be a random manner. For a reason unknown to us, the game does not advance to the second round but the platforms start to blink and the agent quickly gains a huge amount of points (close to 1 million for our episode time limit)”
Chrabaszcz P, Loshchilov I, Hutter F. Back to Basics: Benchmarking Canonical Evolution Strategies for Playing Atari. arXiv. Preprint posted online February 24, 2018. https://arxiv.org/abs/1802.08842
\")\n#### It is difficult to constrain advanced AI to a particular domain\n\n\nAI with access to the Internet may create copies of itself, gain access to influential systems such as critical infrastructure, or manipulate people into taking actions that are harmful or increase its influence. AI without direct access to the outside world may be able to gain access by manipulating people involved in its development or by exploiting hardware vulnerabilities.[15](https://aiimpacts.org/product-safety-is-a-poor-model-for-ai-governance/#easy-footnote-bottom-15-3402 \"“Academics from an Israeli university have published new research today detailing a technique to convert a RAM card into an impromptu wireless emitter and transmit sensitive data from inside a non-networked air-gapped computer that has no Wi-Fi card.”
Cimpanu C. Academics Turn Ram into wi-fi cards to steal data from air-gapped systems. ZDNET. https://www.zdnet.com/article/academics-turn-ram-into-wifi-cards-to-steal-data-from-air-gapped-systems. Published December 15, 2020. Accessed October 3, 2022.
\")\nExecuting such an escape from a datacenter may not require very high capability. Surprisingly simple social engineering techniques[16](https://aiimpacts.org/product-safety-is-a-poor-model-for-ai-governance/#easy-footnote-bottom-16-3402 \"“Phishing emails and text messages often tell a story to trick you into clicking on a link or opening an attachment. You might get an unexpected email or text message that looks like it’s from a company you know or trust, like a bank or a credit card or utility company. Or maybe it’s from an online payment website or app.”
How to recognize and avoid phishing scams. Federal Trade Commission Consumer Advice. https://consumer.ftc.gov/articles/how-recognize-and-avoid-phishing-scams. Published September 2022. Accessed October 3, 2022.
\") can be successful at getting a person to do something that is not in their interest. Malware that can propagate between computers and control them has existed for a long time[17](https://aiimpacts.org/product-safety-is-a-poor-model-for-ai-governance/#easy-footnote-bottom-17-3402 \"\n\n\n\n
“At around 8:30 p.m. on November 2, 1988, a maliciously clever program was unleashed on the Internet from a computer at the Massachusetts Institute of Technology (MIT).This cyber worm was soon propagating at remarkable speed and grinding computers to a halt. ‘We are currently under attack,’ wrote a concerned student at the University of California, Berkeley in an email later that night. Within 24 hours, an estimated 6,000 of the approximately 60,000 computers that were then connected to the Internet had been hit. Computer worms, unlike viruses, do not need a software host but can exist and propagate on their own.”
\n\n\n\nThe Morris Worm. FBI.gov. https://www.fbi.gov/news/stories/morris-worm-30-years-since-first-major-attack-on-internet-110218. Published November 2, 2018. Accessed October 3, 2022.
\n\n\n\n\") and does not require the software to have any high-level decision making capability at all.\n\n\nImportantly, detecting such escape attempts may be very difficult. Almost any AI will have a strong incentive not to be observed taking dangerous, unintended actions, and current systems sometimes find unintended solutions that are invisible to humans.[18](https://aiimpacts.org/product-safety-is-a-poor-model-for-ai-governance/#easy-footnote-bottom-18-3402 \"“In a series of experiments, we demonstrate an intriguing property of the model: CycleGAN learns to ‘hide’ information about a source image into the images it generates in a nearly imperceptible, highfrequency signal.”Chu C, Zhmoginov A, Sandler M. CycleGAN, a Master of Steganography. arXiv. Preprint posted online December 16, 2017. https://arxiv.org/abs/1712.02950\") Additionally, AI in training is subject to the evaluation difficulties explained in the first section.\n\n\n#### AI breakout could be catastrophic\n\n\nOnce AI has gained influence outside its intended domain, it could cause immense harm. How likely this is to happen and how much harm it may cause is a big topic[19](https://aiimpacts.org/product-safety-is-a-poor-model-for-ai-governance/#easy-footnote-bottom-19-3402 \"List of sources arguing for existential risk from AI. AI Impacts. https://aiimpacts.org/list-of-sources-arguing-for-existential-risk-from-ai/. Published August 6, 2022. Accessed October 3, 2022.\") that I will not try to cover here, but there are a few things worth pointing out in this context:\n\n\n* Most of the arguments around catastrophic AI risk are agnostic to whether AI gains influence before or after deployment.\n* The basic premise behind catastrophic AI risk is not just that it may use whatever influence it is granted to cause harm, but that it will seek additional influence. This is at odds with the basic idea behind the product safety model, which is that we prevent harm by only granting influence to AI that has been verified as safe.\n* The overall stakes are much higher than those associated with things we normally apply the product safety model to, and unlike most risks from technology, the costs are wide reaching and almost entirely external.\n\n\nAdditional comments\n-------------------\n\n\nI am reluctant to offer alternative models, in part because I want to keep the scope of this post narrow, but also because I’m not sure which approaches are viable. But I can at least provide some guiding principles:\n\n\n* Policies intended to mitigate risk from advanced AI must recognize that verifying the safety of highly capable AI systems is an unsolved problem that may remain unsolved for the foreseeable future.\n* These policies must also recognize that public risk from AI begins during development, not at the time of deployment.\n* More broadly, it is important to view AI risk as distinct from most other technologies. It is poorly understood, difficult to control in a reliable and verifiable way, and may become very dangerous before it becomes well understood.\n\n\nFinally, I think it is important to emphasize that, while it is tempting to wait until we see the warning signs that AI is becoming dangerous before enacting such policies, capabilities are advancing rapidly and AI may acquire the ability to seek power and conceal its actions in a sophisticated way with relatively little warning.\n\n\nAcknowledgements\n----------------\n\n\nThanks to Harlan Stewart for giving feedback and helping with citations, Irina Gueorguiev for productive conversations on this topic, and Aysja Johnson, Jeffrey Heninger, and Zach Stein-Perlman for feedback on an earlier draft. All mistakes are my own.\n\n\nNotes\n-----\n\n\n\n\n\n\n\n\n\n\n\n", "url": "https://aiimpacts.org/product-safety-is-a-poor-model-for-ai-governance/", "title": "Product safety is a poor model for AI governance", "source": "aiimpacts.org", "source_type": "wordpress", "date_published": "2023-02-01T22:38:03+00:00", "paged_url": "https://aiimpacts.org/feed?paged=2", "authors": ["richardkorzekwa"], "id": "b7e9a9f4900e9091f9e3802b76ec4076", "summary": []} {"text": "We don’t trade with ants\n\n*(Crossposted from [world spirit sock puppet](https://worldspiritsockpuppet.com/2023/01/10/we-dont-trade-with-ants.html))*\n\n\n*Katja Grace, 10 January 2023*\n\n\nWhen discussing advanced AI, sometimes the following exchanges happens:\n\n\n“Perhaps advanced AI won’t kill us. Perhaps it will trade with us”\n\n\n“We don’t trade with ants”\n\n\nI think it’s interesting to get clear on exactly why we don’t trade with ants, and whether it is relevant to the AI situation.\n\n\nWhen a person says “we don’t trade with ants”, I think the implicit explanation is that humans are so big, powerful and smart compared to ants that we don’t need to trade with them because they have nothing of value and if they did we could just take it; anything they can do we can do better, and we can just walk all over them. Why negotiate when you can steal?\n\n\nI think this is broadly wrong, and that it is also an interesting case of the classic cognitive error of imagining that trade is about swapping fixed-value objects, rather than creating new value from a confluence of one’s needs and the other’s affordances. It’s only in the imaginary zero-sum world that you can generally replace trade with stealing the other party’s stuff, if the other party is weak enough.\n\n\nAnts, with their skills, could do a lot that we would plausibly find worth paying for. Some ideas:\n\n\n1. Cleaning things that are hard for humans to reach (crevices, buildup in pipes, outsides of tall buildings)\n2. Chasing away other insects, including in agriculture\n3. Surveillance and spying\n4. Building, sculpting, moving, and mending things in hard to reach places and at small scales (e.g. dig tunnels, deliver adhesives to cracks)\n5. Getting out of our houses before we are driven to expend effort killing them, and similarly for all the other places ants conflict with humans (stinging, eating crops, ..)\n6. (For an extended list, see ‘Appendix: potentially valuable things things ants can do’)\n\n\nWe can’t take almost any of this by force, we can at best kill them and take their dirt and the minuscule mouthfuls of our foods they were eating.\n\n\nCould we pay them for all this?\n\n\nA single ant eats about 2mg per day according to [a random website](https://www.terminix.com/blog/bug-facts/how-much-do-bugs-eat/), so you could support a colony of a million ants with 2kg of food per day. Supposing they accepted pay in sugar, or something similarly expensive, 2kg costs around [$3](https://www.webstaurantstore.com/domino-extra-fine-granulated-sugar-50-lb/104SUGEFG50.html). Perhaps you would need to pay them more than subsistence to attract them away from foraging freely, since apparently food-gathering ants usually collect more than they eat, to support others in their colony. So let’s guess $5.\n\n\nMy guess is that a million ants could do well over $5 of the above labors in a day. For instance, a colony of meat ants [takes ‘weeks’](https://en.wikipedia.org/wiki/Meat_ant#Relationship_with_humans) to remove the meat from an entire carcass of an animal. Supposing somewhat conservatively that this is three weeks, and the animal is a [1.5kg](https://www.environment.nsw.gov.au/topics/animals-and-plants/native-animals/native-animal-facts/bandicoots#:~:text=Bandicoots%20are%20about%20the%20size,of%20which%20live%20in%20NSW.&text=The%20long%2Dnosed%20bandicoot%20is,weighs%20up%20to%201.5kg.) bandicoot, the colony is moving 70g/day. Guesstimating the mass of crumbs falling on the floor of a small cafeteria in a day, I imagine that it’s less than that produced by tearing up a single bread roll and spreading it around, which the internet says is about 50g. So my guess is that an ant colony could clean the floor of a small cafeteria for around $5/day, which I imagine is cheaper than human sweeping (this site says ‘light cleaning’ costs around $35/h on average in the US). And this is one of the tasks where the ants have least advantages over humans. Cleaning the outside of skyscrapers or the inside of pipes is presumably much harder for humans than cleaning a cafeteria floor, and I expect is fairly similar for ants.\n\n\nSo at a basic level, it seems like there should be potential for trade with ants – they can do a lot of things that we want done, and could live well at the prices we would pay for those tasks being done.\n\n\nSo why don’t we trade with ants?\n\n\nI claim that we don’t trade with ants because we can’t communicate with them. We can’t tell them what we’d like them to do, and can’t have them recognize that we would pay them if they did it. Which might be more than the language barrier. There might be a conceptual poverty. There might also be a lack of the memory and consistent identity that allows an ant to uphold commitments it made with me five minutes ago.\n\n\nTo get basic trade going, you might not need much of these things though. If we could only communicate that their all leaving our house immediately would prompt us to put a plate of honey in the garden for them and/or not slaughter them, then we would already be gaining from trade.\n\n\nSo it looks like the the AI-human relationship is importantly disanalogous to the human-ant relationship, because the big reason we don’t trade with ants will not apply to AI systems potentially trading with us: we can’t communicate with ants, AI can communicate with us.\n\n\n(You might think ‘but the AI will be so far above us that it will think of itself as unable to communicate with us, in the same way that we can’t with the ants – we will be unable to conceive of most of its concepts’. It seems unlikely to me that one needs anything like the full palette of concepts available to the smarter creature to make productive trade. With ants, ‘go over there and we won’t kill you’ would do a lot, and it doesn’t involve concepts at the foggy pinnacle of human meaning-construction. The issue with ants is that we can’t communicate almost at all.)\n\n\nBut also: ants can actually do heaps of things we can’t, whereas (arguably) at some point that won’t be true for us relative to AI systems. (When we get human-level AI, will that AI also be ant level? Or will AI want to trade with ants for longer than it wants to trade with us? It can probably better figure out how to talk to ants.) However just because at some point AI systems will probably do everything humans do, doesn’t mean that this will happen on any particular timeline, e.g. the same one on which AI becomes ‘very powerful’. If the situation turns out similar to us and ants, we might expect that we continue to have a bunch of niche uses for a while.\n\n\nIn sum, for AI systems to be to humans as we are to ants, would be for us to be able to do many tasks better than AI, and for the AI systems to be willing to pay us grandly for them, but for them to be unable to tell us this, or even to warn us to get out of the way. Is this what AI will be like? No. AI will be able to communicate with us, though at some point we will be less useful to AI systems than ants could be to us if they could communicate.\n\n\nBut, you might argue, being totally unable to communicate makes one useless, even if one has skills that could be good if accessible through communication. So being unable to communicate is just a kind of being useless, and how we treat ants is an apt case study in treatment of powerless and useless creatures, even if the uselessness has an unusual cause. This seems sort of right, but a) being unable to communicate probably makes a creature more absolutely useless than if it just lacks skills, because even an unskilled creature is sometimes in a position to add value e.g. by moving out of the way instead of having to be killed, b) the corner-ness of the case of ant uselessness might make general intuitive implications carry over poorly to other cases, c) the fact that the ant situation can definitely not apply to us relative to AIs seems interesting, and d) it just kind of worries me that when people are thinking about this analogy with ants, they are imagining it all wrong in the details, even if the conclusion should be the same.\n\n\nAlso, there’s a thought that AI being as much more powerful than us as we are than ants implies a uselessness that makes extermination almost guaranteed. But ants, while extremely powerless, are only useless to us by an accident of signaling systems. And we know that problem won’t apply in the case of AI. Perhaps we should not expect to so easily become useless to AI systems, even supposing they take all power from humans.\n\n\nAppendix: potentially valuable things things ants can do\n--------------------------------------------------------\n\n\n1. Clean, especially small loose particles or detachable substances, especially in cases that are very hard for humans to reach (e.g. floors, crevices, sticky jars in the kitchen, buildup from pipes while water is off, the outsides of tall buildings)\n2. Chase away other insects\n3. Pest control in agriculture (they have [already been used for this](https://en.wikipedia.org/wiki/Weaver_ant#In_agriculture) since about 400AD)\n4. Surveillance and spying\n5. Investigating hard to reach situations, underground or in walls for instance – e.g. see whether a pipe is leaking, or whether the foundation of a house is rotting, or whether there is smoke inside a wall\n6. Surveil buildings for [smoke](https://www.goshen.edu/blogs/2014/05/10/ants-smoke-final-survey/#:~:text=So%2C%20today%20we%20spent%20several,the%20ground%20to%20save%20themselves.&text=As%20far%20as%201800m%20away,over%20a%20hundred%20per%20minute!)\n7. Defend areas from invaders, e.g. buildings, cars ([some plants have coordinated with ants in this way](https://en.wikipedia.org/wiki/Vachellia_drepanolobium#Symbiosis_with_ants))\n8. Sculpting/moving things at a very small scale\n9. Building [house-size structures](https://youtu.be/lFg21x2sj-M?t=171) with intricate detailing.\n10. Digging tunnels (e.g. instead of digging up your garden to lay a pipe, maybe ants could dig the hole, then a flexible pipe could be pushed through it)\n11. Being used in medication (this already happens, but might happen better if we could communicate with them)\n12. Participating in war (attack, guerilla attack, sabotage, intelligence)\n13. Mending things at a small scale, e.g. delivering adhesive material to a crack in a pipe while the water is off\n14. Surveillance of scents (including which direction a scent is coming from), e.g. drugs, explosives, diseases, people, microbes\n15. Tending other small, useful organisms (‘Leafcutter ants (Atta and Acromyrmex) feed exclusively on a fungus that grows only within their colonies. They continually collect leaves which are taken to the colony, cut into tiny pieces and placed in fungal gardens.’[Wikipedia](https://en.wikipedia.org/wiki/Leafcutter_ant#Ant%E2%80%93fungus_mutualism): ‘Leaf cutter ants are sensitive enough to adapt to the fungi’s reaction to different plant material, apparently detecting chemical signals from the fungus. If a particular type of leaf is toxic to the fungus, the colony will no longer collect it…The fungi used by the higher attine ants no longer produce spores. These ants fully domesticated their fungal partner 15 million years ago, a process that took 30 million years to complete.[9] Their fungi produce nutritious and swollen hyphal tips (gongylidia) that grow in bundles called staphylae, to specifically feed the ants.’ ‘The ants in turn keep predators away from the aphids and will move them from one feeding location to another. When migrating to a new area, many colonies will take the aphids with them, to ensure a continued supply of honeydew.’ [Wikipedia](https://en.wikipedia.org/wiki/Ant#Relationships_with_other_organisms):’Myrmecophilous (ant-loving) caterpillars of the butterfly family Lycaenidae (e.g., blues, coppers, or hairstreaks) are herded by the ants, led to feeding areas in the daytime, and brought inside the ants’ nest at night. The caterpillars have a gland which secretes honeydew when the ants massage them.’’)\n16. Measuring hard to access distances (they measure distance as they walk with an internal pedometer)\n17. Killing plants (lemon ants [make](https://en.wikipedia.org/wiki/Ant#Relationships_with_other_organisms) ‘devil’s gardens’ by killing all plants other than ‘lemon ant trees’ in an area)\n18. Producing and delivering nitrogen to plants (‘Isotopic labelling studies suggest that plants also obtain nitrogen from the ants.’ – [Wikipedia](https://en.wikipedia.org/wiki/Ant#Relationships_with_other_organisms))\n19. Get out of our houses before we are driven to expend effort killing them, and similarly for all the other places ants conflict with humans (stinging, eating crops, ..)\n\n\n \n\n", "url": "https://aiimpacts.org/we-dont-trade-with-ants/", "title": "We don’t trade with ants", "source": "aiimpacts.org", "source_type": "wordpress", "date_published": "2023-01-10T23:52:13+00:00", "paged_url": "https://aiimpacts.org/feed?paged=2", "authors": ["Katja Grace"], "id": "702e698662eee8d240d32dfbb8df253f", "summary": []} {"text": "Let’s think about slowing down AI\n\n*Katja Grace, 22 December 2022*\n\n\n**Averting doom by not building the doom machine**\n--------------------------------------------------\n\n\nIf you fear that someone will build a machine that will seize control of the world and annihilate humanity, then one kind of response is to try to build further machines that will seize control of the world even earlier without destroying it, forestalling the ruinous machine’s conquest. An alternative or complementary kind of response is to try to avert such machines being built at all, at least while the degree of their apocalyptic tendencies is ambiguous. \n\n\nThe latter approach seems to me like the kind of basic and obvious thing worthy of at least consideration, and also in its favor, fits nicely in the genre ‘stuff that it isn’t that hard to imagine happening in the real world’. Yet my impression is that for people worried about extinction risk from artificial intelligence, strategies under the heading ‘actively slow down AI progress’ have historically been dismissed and ignored (though ‘don’t actively speed up AI progress’ is popular).\n\n\nThe conversation near me over the years has felt a bit like this: \n\n\n\n> \n> **Some people:** AI might kill everyone. We should design a godlike super-AI of perfect goodness to prevent that.\n> \n> \n> **Others:** wow that sounds extremely ambitious\n> \n> \n> **Some people:** yeah but it’s very important and also we are extremely smart so idk it could work\n> \n> \n> \n> \n> \n> [Work on it for a decade and a half]\n> \n> \n> \n> \n> **Some people:** ok that’s pretty hard, we give up\n> \n> \n> **Others:** oh huh shouldn’t we maybe try to stop the building of this dangerous AI? \n> \n> \n> **Some people:** hmm, that would involve coordinating numerous people—we may be arrogant enough to think that we might build a god-machine that can take over the world and remake it as a paradise, but we aren’t delusional\n> \n> \n> \n\n\nThis seems like an error to me. (And [lately](https://www.lesswrong.com/posts/kipMvuaK3NALvFHc9/what-an-actually-pessimistic-containment-strategy-looks-like), [to](https://forum.effectivealtruism.org/posts/8CMuNwKMcR55jhd8W/instead-of-technical-research-more-people-should-focus-on) [a](https://twitter.com/KerryLVaughan/status/1536364299089854471) [bunch](https://www.lesswrong.com/posts/yhRTjBs6oiNcjRgcx/the-case-for-doing-something-else-if-alignment-is-doomed) [of](https://twitter.com/scholl_adam/status/1556989092784615424) [other](https://forum.effectivealtruism.org/posts/6LNvQYyNQpDQmnnux/slowing-down-ai-progress-is-an-underexplored-alignment) [people](https://forum.effectivealtruism.org/posts/pJuS5iGbazDDzXwJN/the-history-epistemology-and-strategy-of-technological).) \n\n\nI don’t have a strong view on whether anything in the space of ‘try to slow down some AI research’ should be done. But I think a) the naive first-pass guess should be a strong ‘probably’, and b) a decent amount of thinking should happen before writing off everything in this large space of interventions. Whereas customarily the tentative answer seems to be, ‘of course not’ and then the topic seems to be avoided for further thinking. (At least in my experience—the AI safety community is large, and for most things I say here, different experiences are probably had in different bits of it.)\n\n\nMaybe my strongest view is that one shouldn’t apply such different standards of ambition to these different classes of intervention. Like: yes, there appear to be substantial difficulties in slowing down AI progress to good effect. But in technical alignment, mountainous challenges are met with enthusiasm for mountainous efforts. And it is very non-obvious that the scale of difficulty here is much larger than that involved in designing acceptably safe versions of machines capable of taking over the world before anyone else in the world designs dangerous versions. \n\n\nI’ve been talking about this with people over the past many months, and have accumulated an abundance of reasons for not trying to slow down AI, most of which I’d like to argue about at least a bit. My impression is that arguing in real life has coincided with people moving toward my views.\n\n\n**Quick clarifications**\n------------------------\n\n\nFirst, to fend off misunderstanding—\n\n\n1. I take ‘slowing down dangerous AI’ to include any of:\n\t1. reducing the speed at which AI progress is made in general, e.g. as would occur if general funding for AI declined.\n\t2. shifting AI efforts from work leading more directly to risky outcomes to other work, e.g. as might occur if there was broadscale concern about very large AI models, and people and funding moved to other projects.\n\t3. Halting categories of work until strong confidence in its safety is possible, e.g. as would occur if AI researchers agreed that certain systems posed catastrophic risks and should not be developed until they did not. (This might mean a permanent end to some systems, if they were intrinsically unsafe.)(So in particular, I’m including both actions whose direct aim is slowness in general, and actions whose aim is requiring safety before specific developments, which implies slower progress.)\n2. I do think there is serious attention on some versions of these things, generally under other names. I see people thinking about ‘differential progress’ (b. above), and strategizing about coordination to slow down AI at some point in the future (e.g. at ‘deployment’). And I think a lot of consideration is given to avoiding actively speeding up AI progress. What I’m saying is missing are, a) consideration of actively working to slow down AI now, and b) shooting straightforwardly to ‘slow down AI’, rather than wincing from that and only considering examples of it that show up under another conceptualization (perhaps this is an unfair diagnosis).\n3. AI Safety is a big community, and I’ve only ever been seeing a one-person window into it, so maybe things are different e.g. in DC, or in different conversations in Berkeley. I’m just saying that for my corner of the world, the level of disinterest in this has been notable, and in my view misjudged.\n\n\n**Why not slow down AI? Why not consider it?**\n----------------------------------------------\n\n\nOk, so if we tentatively suppose that this topic is worth even thinking about, what do we think? Is slowing down AI a good idea at all? Are there great reasons for dismissing it?\n\n\n[Scott Alexander wrote a post](https://astralcodexten.substack.com/p/why-not-slow-ai-progress) a little while back raising reasons to dislike the idea, roughly:\n\n\n1. Do you want to lose an arms race? If the AI safety community tries to slow things down, it will disproportionately slow down progress in the US, and then people elsewhere will go fast and get to be the ones whose competence determines whether the world is destroyed, and whose values determine the future if there is one. Similarly, if AI safety people criticize those contributing to AI progress, it will mostly discourage the most friendly and careful AI capabilities companies, and the reckless ones will get there first.\n2. One might contemplate ‘coordination’ to avoid such morbid races. But coordinating anything with the whole world seems wildly tricky. For instance, some countries are large, scary, and hard to talk to.\n3. Agitating for slower AI progress is ‘defecting’ against the AI capabilities folks, who are good friends of the AI safety community, and their friendship is strategically valuable for ensuring that safety is taken seriously in AI labs (as well as being non-instrumentally lovely! Hi AI capabilities friends!).\n\n\nOther opinions I’ve heard, some of which I’ll address:\n\n\n4. Slowing AI progress is futile: for all your efforts you’ll probably just die a few years later\n5. Coordination based on convincing people that AI risk is a problem is absurdly ambitious. It’s practically impossible to convince AI professors of this, let alone any real fraction of humanity, and you’d need to convince a massive number of people.\n6. What are we going to do, build powerful AI never and die when the Earth is eaten by the sun?\n7. It’s actually better for safety if AI progress moves fast. This might be because the faster AI capabilities work happens, the smoother AI progress will be, and this is more important than the duration of the period. Or speeding up progress now might force future progress to be correspondingly slower. Or [because](https://www.lesswrong.com/posts/EzAt4SbtQcXtDNhHK/confused-why-a-capabilities-research-is-good-for-alignment) safety work is probably better when done just before building the relevantly risky AI, in which case the best strategy might be to get as close to dangerous AI as possible and then stop and do safety work. Or if safety work is very useless ahead of time, maybe delay is fine, but there is little to gain by it.\n8. Specific routes to slowing down AI are not worth it. For instance, avoiding working on AI capabilities research is bad because [it’s so helpful](https://forum.effectivealtruism.org/posts/qjsWZJWcvj3ug5Xja/agrippa-s-shortform?commentId=PWuNscobqudn7puy7) for [learning](https://forum.effectivealtruism.org/posts/qjsWZJWcvj3ug5Xja/agrippa-s-shortform?commentId=EKeegJgLNcPYZ4Kac) on the path to working on alignment. And AI safety people working in AI capabilities can be a force for making safer choices at those companies.\n9. Advanced AI will help enough with other existential risks as to represent a net lowering of existential risk overall.[1](https://aiimpacts.org/feed/?paged=2#footnote-1)\n10. Regulators are ignorant about the nature of advanced AI (partly because it doesn’t exist, so everyone is ignorant about it). Consequently they won’t be able to regulate it effectively, and bring about desired outcomes.\n\n\nMy impression is that there are also less endorsable or less altruistic or more silly motives floating around for this attention allocation. Some things that have come up at least once in talking to people about this, or that seem to be going on:\n\n\n\n* Advanced AI might bring manifold wonders, e.g. long lives of unabated thriving. Getting there a bit later is fine for posterity, but for our own generation it could mean dying as our ancestors did while on the cusp of a utopian eternity. Which would be pretty disappointing. For a person who really believes in this future, it can be tempting to shoot for the best scenario—humanity builds strong, safe AI in time to save this generation—rather than the scenario where our own lives are inevitably lost.\n* Sometimes people who have a heartfelt appreciation for the flourishing that technology has afforded so far can find it painful to be superficially on the side of Luddism here.\n* Figuring out how minds work well enough to create new ones out of math is an incredibly deep and interesting intellectual project, which feels right to take part in. It can be hard to intuitively feel like one shouldn’t do it. \n \n(Illustration from a [co-founder of modern computational reinforcement learning](https://en.wikipedia.org/wiki/Richard_S._Sutton): )\n\n\n\n\n> It will be the greatest intellectual achievement of all time. \n> \n> An achievement of science, of engineering, and of the humanities, \n> whose significance is beyond humanity, \n> beyond life, \n> beyond good and bad.\n> \n> — Richard Sutton (@RichardSSutton) [September 29, 2022](https://twitter.com/RichardSSutton/status/1575619655778983936?ref_src=twsrc%5Etfw)\n\n\n\n* It is uncomfortable to contemplate projects that would put you in conflict with other people. Advocating for slower AI feels like trying to impede someone else’s project, which feels adversarial and can feel like it has a higher burden of proof than just working on your own thing.\n* ‘Slow-down-AGI’ sends people’s minds to e.g. industrial sabotage or terrorism, rather than more boring courses, such as, ‘lobby for labs developing shared norms for when to pause deployment of models’. This understandably encourages dropping the thought as soon as possible.\n* My weak guess is that there’s a kind of bias at play in AI risk thinking in general, where any force that isn’t zero is taken to be arbitrarily intense. Like, if there is pressure for agents to exist, there will arbitrarily quickly be arbitrarily agentic things. If there is a feedback loop, it will be arbitrarily strong. Here, if stalling AI can’t be forever, then it’s essentially zero time. If a regulation won’t obstruct every dangerous project, then is worthless. Any finite economic disincentive for dangerous AI is nothing in the face of the omnipotent economic incentives for AI. I think this is a bad mental habit: things in the real world often come down to actual finite quantities. This is very possibly an unfair diagnosis. (I’m not going to discuss this later; this is pretty much what I have to say.)\n* I sense an assumption that slowing progress on a technology would be a radical and unheard-of move.\n* I agree with [lc](https://www.lesswrong.com/posts/kipMvuaK3NALvFHc9/what-an-actually-pessimistic-containment-strategy-looks-like) that there seems to have been a quasi-taboo on the topic, which perhaps explains a lot of the non-discussion, though still calls for its own explanation. I think it suggests that concerns about uncooperativeness play a part, and the same for thinking of slowing down AI as centrally involving antisocial strategies.\n\n\n\nI’m not sure if any of this fully resolves why AI safety people haven’t thought about slowing down AI more, or whether people should try to do it. But my sense is that many of the above reasons are at least somewhat wrong, and motives somewhat misguided, so I want to argue about a lot of them in turn, including both arguments and vague motivational themes.\n\n\nThe mundanity of the proposal\n=============================\n\n\n**Restraint is not radical**\n----------------------------\n\n\nThere seems to be a common thought that technology is a kind of inevitable path along which the world must tread, and that trying to slow down or avoid any part of it would be both futile and extreme.[2](https://aiimpacts.org/feed/?paged=2#footnote-2) \n\n\nBut empirically, the world doesn’t pursue every technology—it barely pursues any technologies.\n\n\n### **Sucky technologies**\n\n\nFor a start, there are many machines that there is no pressure to make, because they have no value. Consider a machine that sprays shit in your eyes. We can technologically do that, but probably nobody has ever built that machine. \n\n\nThis might seem like a stupid example, because no serious ‘technology is inevitable’ conjecture is going to claim that totally pointless technologies are inevitable. But if you are sufficiently pessimistic about AI, I think this is the right comparison: if there are kinds of AI that would cause huge net costs to their creators if created, according to our best understanding, then they are at least as useless to make as the ‘spray shit in your eyes’ machine. We might accidentally make them due to error, but there is not some deep economic force pulling us to make them. If unaligned superintelligence destroys the world with high probability when you ask it to do a thing, then this is the category it is in, and it is not strange for its designs to just rot in the scrap-heap, with the machine that sprays shit in your eyes and the machine that spreads caviar on roads.\n\n\nOk, but maybe the relevant actors are very committed to being wrong about whether unaligned superintelligence would be a great thing to deploy. Or maybe you think the situation is less immediately dire and building existentially risky AI [really would](https://aiimpacts.org/incentives-to-create-x-risky-ai-systems/) be good for the people making decisions (e.g. because the costs won’t arrive for a while, and the people care a lot about a shot at scientific success relative to a chunk of the future). If the apparent economic incentives are large, are technologies unavoidable?\n\n\n### **Extremely valuable technologies**\n\n\nIt doesn’t look like it to me. Here are a few technologies which I’d guess have substantial economic value, where research progress or uptake appears to be drastically slower than it could be, for reasons of concern about safety or ethics[3](https://aiimpacts.org/feed/?paged=2#footnote-3):\n\n\n1. Huge amounts of medical research, including really important medical research e.g. The FDA [banned](https://www.ncbi.nlm.nih.gov/pmc/articles/PMC7326309/#:~:text=Nonetheless%2C%20in%201978%20the%20controversy%20resulted%20in%20a%20US%20FDA%20ban%20on%20subsequent%20vaccine%20trials%20which%20was%20eventually%20overturned%2030%20years%20later.) human trials of strep A vaccines from the 70s to the 2000s, in spite of [500,000 global deaths every year](https://www.ncbi.nlm.nih.gov/pmc/articles/PMC6474463/#:~:text=Worldwide%2C%20the%20death%20toll%20is%20estimated%20at%20500%20000%20annually). A lot of people also died while covid vaccines went through all the proper trials.\n2. Nuclear energy\n3. Fracking\n4. Various genetics things: genetic modification of foods, gene drives, early recombinant DNA researchers famously organized a moratorium and then ongoing research guidelines including prohibition of certain experiments (see the [Asilomar Conference](https://en.wikipedia.org/wiki/Asilomar_Conference_on_Recombinant_DNA))\n5. Nuclear, biological, and maybe chemical weapons (or maybe these just aren’t useful)\n6. Various human reproductive innovation: cloning of humans, genetic manipulation of humans (a notable example of an economically valuable technology that is to my knowledge barely pursued across different countries, without explicit coordination between those countries, even though it would make those countries more competitive. Someone used CRISPR on babies in China, but was [imprisoned](https://www.science.org/content/article/creator-crispr-babies-nears-release-prison-where-does-embryo-editing-stand) for it.)\n7. Recreational drug development\n8. Geoengineering\n9. Much of science about humans? I recently ran [this survey](https://aiimpacts.org/2022-expert-survey-on-progress-in-ai/), and was reminded how encumbering ethical rules are for even incredibly innocuous research. As far as I could tell the EU now makes it illegal to collect data in the EU unless you promise to delete the data from anywhere that it might have gotten to if the person who gave you the data wishes for that at some point. In all, dealing with this and IRB-related things added maybe more than half of the effort of the project. Plausibly I misunderstand the rules, but I doubt other researchers are radically better at figuring them out than I am.\n10. There are probably examples from fields considered distasteful or embarrassing to associate with, but it’s hard as an outsider to tell which fields are genuinely hopeless versus erroneously considered so. If there are economically valuable health interventions among those considered wooish, I imagine they would be much slower to be identified and pursued by scientists with good reputations than a similarly promising technology not marred in that way. Scientific research into intelligence is more clearly slowed by stigma, but it is less clear to me what the economically valuable upshot would be.\n11. (I think there are many other things that could be in this list, but I don’t have time to review them at the moment. [This page](https://wiki.aiimpacts.org/doku.php?id=responses_to_ai:technological_inevitability:incentivized_technologies_not_pursued:start) might collect more of them in future.)\n\n\nIt seems to me that intentionally slowing down progress in technologies to give time for even probably-excessive caution is commonplace. (And this is just looking at things slowed down over caution or ethics specifically—probably there are also other reasons things get slowed down.)\n\n\nFurthermore, among valuable technologies that nobody is especially trying to slow down, it seems common enough for progress to be massively slowed by relatively minor obstacles, which is further evidence for a lack of overpowering strength of the economic forces at play. For instance, Fleming first took notice of mold’s effect on bacteria in 1928, but nobody took a serious, high-effort shot at developing it as a drug until 1939.[4](https://aiimpacts.org/feed/?paged=2#footnote-4) Furthermore, in the thousands of years preceding these events, [various](https://en.wikipedia.org/wiki/History_of_penicillin#Early_history) [people](https://en.wikipedia.org/wiki/History_of_penicillin#Early_scientific_evidence) noticed numerous times that mold, other fungi or plants inhibited bacterial growth, but didn’t exploit this observation even enough for it not to be considered a new discovery in the 1920s. Meanwhile, people dying of infection was quite a thing. [In 1930](https://dash.harvard.edu/bitstream/handle/1/8889467/Gottfried05.pdf) about 300,000 Americans died of bacterial illnesses per year (around 250/100k).\n\n\nMy guess is that people make real choices about technology, and they do so in the face of economic forces that are feebler than commonly thought. \n\n\n**Restraint is not terrorism, usually**\n---------------------------------------\n\n\nI think people have historically imagined weird things when they think of ‘slowing down AI’. I posit that their central image is sometimes terrorism (which understandably they don’t want to think about for very long), and sometimes some sort of implausibly utopian global agreement.\n\n\nHere are some other things that ‘slow down AI capabilities’ could look like (where the best positioned person to carry out each one differs, but if you are not that person, you could e.g. talk to someone who is):\n\n\n1. Don’t actively forward AI progress, e.g. by devoting your life or millions of dollars to it (this one is often considered already)\n2. Try to convince researchers, funders, hardware manufacturers, institutions etc that they too should stop actively forwarding AI progress\n3. Try to get any of those people to stop actively forwarding AI progress even if they don’t agree with you: through negotiation, payments, public reproof, or other activistic means.\n4. Try to get the message to the world that AI is heading toward being seriously endangering. If AI progress is broadly condemned, this will trickle into myriad decisions: job choices, lab policies, national laws. To do this, for instance [produce compelling demos of risk, agitate for stigmatization of risky actions](https://www.lesswrong.com/posts/uMQ3cqWDPHhjtiesc/agi-ruin-a-list-of-lethalities?commentId=JqT3t2jyj3NXDFkDr), write science fiction illustrating the problems broadly and evocatively (I think this has actually been helpful repeatedly in the past), go on TV, write opinion pieces, help organize and empower the people who are already concerned, etc.\n5. Help organize the researchers who think their work is potentially omnicidal into coordinated action on not doing it.\n6. Move AI resources from dangerous research to other research. Move investments from projects that lead to large but poorly understood capabilities, to projects that lead to understanding these things e.g. theory before scaling (see [differential technological development](https://forum.effectivealtruism.org/posts/g6549FAQpQ5xobihj/differential-technological-development) in general[5](https://aiimpacts.org/feed/?paged=2#footnote-5)).\n7. Formulate specific precautions for AI researchers and labs to take in different well-defined future situations, [Asilomar Conference](https://en.wikipedia.org/wiki/Asilomar_Conference_on_Recombinant_DNA) style. These could include more intense vetting by particular parties or methods, modifying experiments, or pausing lines of inquiry entirely. Organize labs to coordinate on these.\n8. Reduce available compute for AI, e.g. via regulation of production and trade, seller choices, purchasing compute, trade strategy.\n9. At labs, choose policies that slow down other labs, e.g. reduce public helpful research outputs\n10. Alter the publishing system and incentives to reduce research dissemination. E.g. A journal verifies research results and releases the fact of their publication without any details, maintains records of research priority for later release, and distributes funding for participation. (This is how Szilárd and co. arranged the mitigation of 1940s nuclear research helping Germany, except I’m not sure if the compensatory funding idea was used.[6](https://aiimpacts.org/feed/?paged=2#footnote-6))\n11. The above actions would be taken through choices made by scientists, or funders, or legislators, or labs, or public observers, etc. Communicate with those parties, or help them act.\n\n\n**Coordination is not miraculous world government, usually**\n------------------------------------------------------------\n\n\nThe common image of coordination seems to be explicit, centralized, involving of every party in the world, and something like cooperating on a prisoners’ dilemma: incentives push every rational party toward defection at all times, yet maybe through deontological virtues or sophisticated decision theories or strong international treaties, everyone manages to not defect for enough teetering moments to find another solution.\n\n\nThat is a possible way coordination could be. (And I think one that shouldn’t be seen as so hopeless—the world has actually coordinated on some impressive things, e.g. nuclear non-proliferation.) But if what you want is for lots of people to coincide in doing one thing when they might have done another, then there are quite a few ways of achieving that. \n\n\nConsider some other case studies of coordinated behavior:\n\n\n* **Not eating sand.** The whole world coordinates to barely eat any sand at all. How do they manage it? It is actually not in almost anyone’s interest to eat sand, so the mere maintenance of sufficient epistemological health to have this widely recognized does the job.\n* **Eschewing bestiality:** probably some people think bestiality is moral, but enough don’t that engaging in it would risk huge stigma. Thus the world coordinates fairly well on doing very little of it.\n* **Not wearing Victorian attire on the streets:** this is similar but with no moral blame involved. Historic dress is arguably often more aesthetic than modern dress, but even people who strongly agree find it unthinkable to wear it in general, and assiduously avoid it except for when they have ‘excuses’ such as a special party. This is a very strong coordination against what appears to otherwise be a ubiquitous incentive (to be nicer to look at). As far as I can tell, it’s powered substantially by the fact that it is ‘not done’ and would now be weird to do otherwise. (Which is a very general-purpose mechanism.)\n* **Political correctness:** public discourse has strong norms about what it is okay to say, which do not appear to derive from a vast majority of people agreeing about this (as with bestiality say). New ideas about what constitutes being politically correct sometimes spread widely. This coordinated behavior seems to be roughly due to decentralized application of social punishment, from both a core of proponents, and from people who fear punishment for not punishing others. Then maybe also from people who are concerned by non-adherence to what now appears to be the norm given the actions of the others. This differs from the above examples, because it seems like it could persist even with a very small set of people agreeing with the object-level reasons for a norm. If failing to advocate for the norm gets you publicly shamed by advocates, then you might tend to advocate for it, making the pressure stronger for everyone else.\n\n\nThese are all cases of very broadscale coordination of behavior, none of which involve prisoners’ dilemma type situations, or people making explicit agreements which they then have an incentive to break. They do not involve centralized organization of huge multilateral agreements. Coordinated behavior can come from everyone individually wanting to make a certain choice for correlated reasons, or from people wanting to do things that those around them are doing, or from distributed behavioral dynamics such as punishment of violations, or from collaboration in thinking about a topic.\n\n\nYou might think they are weird examples that aren’t very related to AI. I think, a) it’s important to remember the plethora of weird dynamics that actually arise in human group behavior and not get carried away theorizing about AI in a world drained of everything but prisoners’ dilemmas and binding commitments, and b) the above are actually all potentially relevant dynamics here.\n\n\nIf AI in fact poses a large existential risk within our lifetimes, such that it is net bad for any particular individual, then the situation in theory looks a lot like that in the ‘avoiding eating sand’ case. It’s an option that a rational person wouldn’t want to take if they were just alone and not facing any kind of multi-agent situation. If AI is that dangerous, then not taking this inferior option could largely come from a coordination mechanism as simple as distribution of good information. (You still need to deal with irrational people and people with unusual values.)\n\n\nBut even failing coordinated caution from ubiquitous insight into the situation, other models might work. For instance, if there came to be somewhat widespread concern that AI research is bad, that might substantially lessen participation in it, beyond the set of people who are concerned, via mechanisms similar to those described above. Or it might give rise to a wide crop of local regulation, enforcing whatever behavior is deemed acceptable. Such regulation need not be centrally organized across the world to serve the purpose of coordinating the world, as long as it grew up in different places similarly. Which might happen because different locales have similar interests (all rational governments should be similarly concerned about losing power to automated power-seeking systems with unverifiable goals), or because—as with individuals—there are social dynamics which support norms arising in a non-centralized way.\n\n\nThe arms race model and its alternatives\n========================================\n\n\nOk, maybe in principle you might hope to coordinate to not do self-destructive things, but realistically, if the US tries to slow down, won’t China or Facebook or someone less cautious take over the world? \n\n\nLet’s be more careful about the game we are playing, game-theoretically speaking.\n\n\nThe arms race\n-------------\n\n\nWhat is an arms race, game theoretically? It’s an iterated [prisoners’ dilemma](https://en.wikipedia.org/wiki/Prisoner%27s_dilemma), seems to me. Each round looks something like this:\n\n\n\n[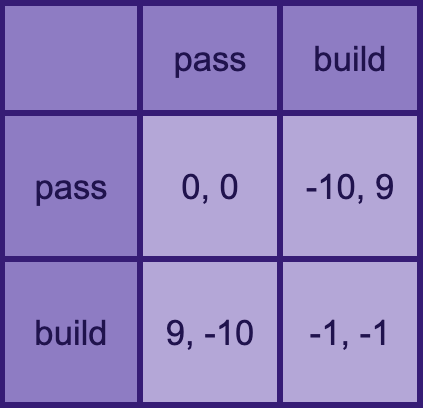](https://substackcdn.com/image/fetch/f_auto,q_auto:good,fl_progressive:steep/https%3A%2F%2Fbucketeer-e05bbc84-baa3-437e-9518-adb32be77984.s3.amazonaws.com%2Fpublic%2Fimages%2F17202441-ea13-41b0-b0d5-d83f30e2ffec_424x410.png)**Player 1 chooses a row, Player 2 chooses a column, and the resulting payoffs are listed in each cell, for {Player 1, Player 2}**\nIn this example, building weapons costs one unit. If anyone ends the round with more weapons than anyone else, they take all of their stuff (ten units).\n\n\nIn a single round of the game it’s always better to build weapons than not (assuming your actions are devoid of implications about your opponent’s actions). And it’s always better to get the hell out of this game.\n\n\nThis is not much like what the current AI situation looks like, if you think AI poses a substantial risk of destroying the world.\n\n\nThe suicide race\n----------------\n\n\nA closer model: as above except if anyone chooses to build, everything is destroyed (everyone loses all their stuff—ten units of value—as well as one unit if they built).\n\n\n\n[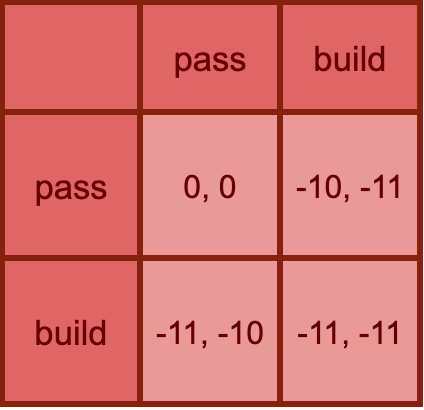](https://substackcdn.com/image/fetch/f_auto,q_auto:good,fl_progressive:steep/https%3A%2F%2Fbucketeer-e05bbc84-baa3-437e-9518-adb32be77984.s3.amazonaws.com%2Fpublic%2Fimages%2Fbc8c586a-0b5e-4197-b9be-d083a6531fb3_424x410.png)\nThis is importantly different from the classic ‘arms race’ in that pressing the ‘everyone loses now’ button isn’t an equilibrium strategy.\n\n\nThat is: for anyone who thinks powerful misaligned AI represents near-certain death, the existence of other possible AI builders is not any reason to ‘race’. \n\n\nBut few people are that pessimistic. How about a milder version where there’s a good chance that the players ‘align the AI’?\n\n\n**The safety-or-suicide race**\n------------------------------\n\n\nOk, let’s do a game like the last but where if anyone builds, everything is only maybe destroyed (minus ten to all), and in the case of survival, everyone returns to the original arms race fun of redistributing stuff based on who built more than whom (+10 to a builder and -10 to a non-builder if there is one of each). So if you build AI alone, and get lucky on the probabilistic apocalypse, can still win big.\n\n\nLet’s take 50% as the chance of doom if any building happens. Then we have a game whose expected payoffs are half way between those in the last two games:\n\n\n\n[](https://substackcdn.com/image/fetch/f_auto,q_auto:good,fl_progressive:steep/https%3A%2F%2Fbucketeer-e05bbc84-baa3-437e-9518-adb32be77984.s3.amazonaws.com%2Fpublic%2Fimages%2Feeaa5be6-1f1b-4c7f-ad58-571c26df5a37_424x410.png)**(These are expected payoffs—the minus one unit return to building alone comes from the one unit cost of building, plus half a chance of losing ten in an extinction event and half a chance of taking ten from your opponent in a world takeover event.)**\nNow you want to do whatever the other player is doing: build if they’ll build, pass if they’ll pass. \n\n\nIf the odds of destroying the world were very low, this would become the original arms race, and you’d always want to build. If very high, it would become the suicide race, and you’d never want to build. What the probabilities have to be in the real world to get you into something like these different phases is going to be different, because all these parameters are made up (the downside of human extinction is not 10x the research costs of building powerful AI, for instance).\n\n\nBut my point stands: even in terms of simplish models, it’s very non-obvious that we are in or near an arms race. And therefore, very non-obvious that racing to build advanced AI faster is even promising at a first pass.\n\n\nIn less game-theoretic terms: if you don’t seem anywhere near solving alignment, then racing as hard as you can to be the one who it falls upon to have solved alignment—especially if that means having less time to do so, though I haven’t discussed that here—is probably unstrategic. Having more ideologically pro-safety AI designers win an ‘arms race’ against less concerned teams is futile if you don’t have a way for such people to implement enough safety to actually not die, which seems like a very live possibility. ([Robby Bensinger](https://twitter.com/robbensinger/status/1536954285040119809) and maybe Andrew Critch somewhere make similar points.)\n\n\nConversations with my friends on this kind of topic can go like this:\n\n\n\n> \n> **Me**: there’s no real incentive to race if the prize is mutual death\n> \n> \n> **Them**: sure, but it isn’t—if there’s a sliver of hope of surviving unaligned AI, and if your side taking control in that case is a bit better in expectation, and if they are going to build powerful AI anyway, then it’s worth racing. The whole future is on the line!\n> \n> \n> **Me:** Wouldn’t you still be better off directing your own efforts to safety, since your safety efforts will also help everyone end up with a safe AI? \n> \n> \n> **Them**: It will probably only help them somewhat—you don’t know if the other side will use your safety research. But also, it’s not just that they have less safety research. Their values are probably worse, by your lights. \n> \n> \n> **Me**: If they succeed at alignment, are foreign values really worse than local ones? Probably any humans with vast intelligence at hand have a similar shot at creating a glorious human-ish utopia, no?\n> \n> \n> **Them**: No, even if you’re right that being similarly human gets you to similar values in the end, the other parties might be more foolish than our side, and lock-in[7](https://aiimpacts.org/feed/?paged=2#footnote-7) some poorly thought-through version of their values that they want at the moment, or even if all projects would be so foolish, our side might have better poorly thought-through values to lock in, as well as being more likely to use safety ideas at all. Even if racing is very likely to lead to death, and survival is very likely to lead to squandering most of the value, in that sliver of happy worlds so much is at stake in whether it is us or someone else doing the squandering!\n> \n> \n> **Me**: Hmm, seems complicated, I’m going to need paper for this.\n> \n> \n> \n\n\n**The complicated race/anti-race**\n----------------------------------\n\n\n[Here](https://docs.google.com/spreadsheets/d/1tq5jiok33sh89xQxLSBIZQGiuQ8hc8_n0673YU68poM/edit?usp=sharing) is a spreadsheet of models you can make a copy of and play with.\n\n\nThe first model is like this:\n\n\n1. Each player divides their effort between safety and capabilities\n2. One player ‘wins’, i.e. builds ‘AGI’ (artificial general intelligence) first.\n3. P(Alice wins) is a logistic function of Alice’s capabilities investment relative to Bob’s\n4. Each players’ total safety is their own safety investment plus a fraction of the other’s safety investment.\n5. For each player there is some distribution of outcomes if they achieve safety, and a set of outcomes if they do not, which takes into account e.g. their proclivities for enacting stupid near-term lock-ins.\n6. The outcome is a distribution over winners and states of alignment, each of which is a distribution of worlds (e.g. utopia, near-term good lock-in..)\n7. That all gives us a number of utils (Delicious utils!)\n\n\nThe second model is the same except that instead of dividing effort between safety and capabilities, you choose a speed, and the amount of alignment being done by each party is an exogenous parameter. \n\n\nThese models probably aren’t very good, but so far support a key claim I want to make here: it’s pretty non-obvious whether one should go faster or slower in this kind of scenario—it’s sensitive to a lot of different parameters in plausible ranges. \n\n\nFurthermore, I don’t think the results of quantitative analysis match people’s intuitions here.\n\n\nFor example, here’s a situation which I think sounds intuitively like a you-should-race world, but where in the first model above, you should actually go as slowly as possible (this should be the one plugged into the spreadsheet now):\n\n\n* **AI is pretty safe:** unaligned AGI has a mere 7% chance of causing doom, plus a further 7% chance of causing short term lock-in of something mediocre\n* **Your opponent risks bad lock-in:** If there’s a ‘lock-in’ of something mediocre, your opponent has a 5% chance of locking in something actively terrible, whereas you’ll always pick good mediocre lock-in world (and mediocre lock-ins are either 5% as good as utopia, -5% as good)\n* **Your opponent risks messing up utopia:** In the event of aligned AGI, you will reliably achieve the best outcome, whereas your opponent has a 5% chance of ending up in a ‘mediocre bad’ scenario then too.\n* **Safety investment obliterates your chance of getting to AGI first:** moving from no safety at all to full safety means you go from a 50% chance of being first to a 0% chance\n* **Your opponent is racing:** Your opponent is investing everything in capabilities and nothing in safety\n* **Safety work helps others at a steep discount:** your safety work contributes 50% to the other player’s safety\n\n\nYour best bet here (on this model) is still to maximize safety investment. Why? Because by aggressively pursuing safety, you can get the other side half way to full safety, which is worth a lot more than than the lost chance of winning. Especially since if you ‘win’, you do so without much safety, and your victory without safety is worse than your opponent’s victory with safety, even if that too is far from perfect.\n\n\nSo if you are in a situation in this space, and the other party is racing, it’s not obvious if it is even in your narrow interests within the game to go faster at the expense of safety, though it may be.\n\n\nThese models are flawed in many ways, but I think they are better than the intuitive models that support arms-racing. My guess is that the next better still models remain nuanced.\n\n\nOther equilibria and other games\n--------------------------------\n\n\nEven if it would be in your interests to race if the other person were racing, ‘(do nothing, do nothing)’ is often an equilibrium too in these games. At least for various settings of the parameters. It doesn’t necessarily make sense to do nothing in the hope of getting to that equilibrium if you know your opponent to be mistaken about that and racing anyway, but in conjunction with communicating with your ‘opponent’, it seems like a theoretically good strategy.\n\n\nThis has all been assuming the structure of the game. I think the traditional response to an arms race situation is to remember that you are in a more elaborate world with all kinds of unmodeled affordances, and try to get out of the arms race. \n\n\nBeing friends with risk-takers\n==============================\n\n\n**Caution is cooperative**\n--------------------------\n\n\nAnother big concern is that pushing for slower AI progress is ‘defecting’ against AI researchers who are friends of the AI safety community. \n\n\nFor instance [Steven Byrnes](https://www.lesswrong.com/posts/CXaQj85r4LtafCBi8/should-we-postpone-agi-until-we-reach-safety?commentId=w2vSA2cPvE8hR563Z):\n\n\n\n> \n> “I think that trying to slow down research towards AGI through regulation would fail, because everyone (politicians, voters, lobbyists, business, etc.) likes scientific research and technological development, it creates jobs, it cures diseases, etc. etc., and you’re saying we should have less of that. So I think the effort would fail, and also be massively counterproductive by making the community of AI researchers see the community of AGI safety / alignment people as their enemies, morons, weirdos, Luddites, whatever.”\n> \n> \n> \n\n\n(Also a good example of the view criticized earlier, that regulation of things that create jobs and cure diseases just doesn’t happen.)\n\n\nOr Eliezer Yudkowsky, on worry that spreading fear about AI would alienate top AI labs:\n\n\n\n\n> This is the primary reason I didn't, and told others not to, earlier connect the point about human extinction from AGI with AI labs. Kerry has correctly characterized the position he is arguing against, IMO. I myself estimate the public will be toothless vs AGI lab heads.\n> \n> — Eliezer Yudkowsky (@ESYudkowsky) [August 4, 2022](https://twitter.com/ESYudkowsky/status/1555272014939598848?ref_src=twsrc%5Etfw)\n\n\n\nI don’t think this is a natural or reasonable way to see things, because:\n\n\n1. The researchers themselves probably don’t want to destroy the world. Many of them also actually [agree](https://aiimpacts.org/what-do-ml-researchers-think-about-ai-in-2022/) that AI is a serious existential risk. So in two natural ways, pushing for caution is cooperative with many if not most AI researchers.\n2. AI researchers do not have a moral right to endanger the world, that someone would be stepping on by requiring that they move more cautiously. Like, why does ‘cooperation’ look like the safety people bowing to what the more reckless capabilities people want, to the point of fearing to represent their actual interests, while the capabilities people uphold their side of the ‘cooperation’ by going ahead and building dangerous AI? This situation might make sense as a natural consequence of different people’s power in the situation. But then don’t call it a ‘cooperation’, from which safety-oriented parties would be dishonorably ‘defecting’ were they to consider exercising any power they did have.\n\n\nIt could be that people in control of AI capabilities would respond negatively to AI safety people pushing for slower progress. But that should be called ‘we might get punished’ not ‘we shouldn’t defect’. ‘Defection’ has moral connotations that are not due. Calling one side pushing for their preferred outcome ‘defection’ unfairly disempowers them by wrongly setting commonsense morality against them.\n\n\nAt least if it is the safety side. If any of the available actions are ‘defection’ that the world in general should condemn, I claim that it is probably ‘building machines that will plausibly destroy the world, or standing by while it happens’. \n\n\n(This would be more complicated if the people involved were confident that they wouldn’t destroy the world and I merely disagreed with them. But [about half of surveyed researchers](https://aiimpacts.org/what-do-ml-researchers-think-about-ai-in-2022/) are actually more pessimistic than me. And in a situation where the median AI researcher thinks the field has a 5-10% chance of causing human extinction, how confident can any responsible person be in their own judgment that it is safe?) \n\n\nOn top of all that, I worry that highlighting the narrative that wanting more cautious progress is defection is further destructive, because it makes it more likely that AI capabilities people see AI safety people as thinking of themselves as betraying AI researchers, if anyone engages in any such efforts. Which makes the efforts more aggressive. Like, if every time you see friends, you refer to it as ‘cheating on my partner’, your partner may reasonably feel hurt by your continual desire to see friends, even though the activity itself is innocuous.\n\n\n**‘We’ are not the US, ‘we’ are not the AI safety community**\n-------------------------------------------------------------\n\n\n“If ‘we’ try to slow down AI, then the other side might win.” “If ‘we’ ask for regulation, then it might harm ‘our’ relationships with AI capabilities companies.” Who are these ‘we’s? Why are people strategizing for those groups in particular? \n\n\nEven if slowing AI were uncooperative, and it were important for the AI Safety community to cooperate with the AI capabilities community, couldn’t one of the many people not in the AI Safety community work on it? \n\n\nI have a [longstanding irritation](https://meteuphoric.com/2010/08/23/who-are-we/) with thoughtless talk about what ‘we’ should do, without regard for what collective one is speaking for. So I may be too sensitive about it here. But I think confusions arising from this have genuine consequences.\n\n\nI think when people say ‘we’ here, they generally imagine that they are strategizing on behalf of, a) the AI safety community, b) the USA, c) themselves or d) they and their readers. But those are a small subset of people, and not even obviously the ones the speaker can most influence (does the fact that you are sitting in the US really make the US more likely to listen to your advice than e.g. Estonia? Yeah probably on average, but not infinitely much.) If these naturally identified-with groups don’t have good options, that hardly means there are no options to be had, or to be communicated to other parties. Could the speaker speak to a different ‘we’? Maybe someone in the ‘we’ the speaker has in mind knows someone not in that group? If there is a strategy for anyone in the world, and you can talk, then there is probably a strategy for you.\n\n\nThe starkest appearance of error along these lines to me is in writing off the slowing of AI as inherently destructive of relations between the AI safety community and other AI researchers. If we grant that such activity would be seen as a betrayal (which seems unreasonable to me, but maybe), surely it could only be a betrayal if carried out by the AI safety community. There are quite a lot of people who aren’t in the AI safety community and have a stake in this, so maybe some of them could do something. It seems like a huge oversight to give up on all slowing of AI progress because you are only considering affordances available to the AI Safety Community. \n\n\nAnother example: if the world were in the basic arms race situation sometimes imagined, and the United States would be willing to make laws to mitigate AI risk, but could not because China would barge ahead, then that means China is in a great place to mitigate AI risk. Unlike the US, China could propose mutual slowing down, and the US would go along. Maybe it’s not impossible to communicate this to relevant people in China. \n\n\nAn oddity of this kind of discussion which feels related is the persistent assumption that one’s ability to act is restricted to the United States. Maybe I fail to understand the extent to which Asia is an alien and distant land where agency doesn’t apply, but for instance I just wrote to like a thousand machine learning researchers there, and maybe a hundred wrote back, and it was a lot like interacting with people in the US.\n\n\nI’m pretty ignorant about what interventions will work in any particular country, including the US, but I just think it’s weird to come to the table assuming that you can essentially only affect things in one country. Especially if the situation is that you believe you have unique knowledge about what is in the interests of people in other countries. Like, fair enough I would be deal-breaker-level pessimistic if you wanted to get an Asian government to elect you leader or something. But if you think advanced AI is highly likely to destroy the world, including other countries, then the situation is totally different. If you are right, then everyone’s incentives are basically aligned. \n\n\nI more weakly suspect some related mental shortcut is misshaping the discussion of arms races in general. The thought that something is a ‘race’ seems much stickier than alternatives, even if the true incentives don’t really make it a race. Like, against the laws of game theory, people sort of expect the enemy to try to believe falsehoods, because it will better contribute to their racing. And this feels like realism. The uncertain details of billions of people one barely knows about, with all manner of interests and relationships, just really wants to form itself into an ‘us’ and a ‘them’ in zero-sum battle. This is a mental shortcut that could really kill us.\n\n\nMy impression is that in practice, for many of the technologies slowed down for risk or ethics, mentioned in section ‘Extremely valuable technologies’ above, countries with fairly disparate cultures have converged on similar approaches to caution. I take this as evidence that none of ethical thought, social influence, political power, or rationality are actually very siloed by country, and in general the ‘countries in contest’ model of everything isn’t very good.\n\n\nNotes on tractability\n=====================\n\n\n**Convincing people doesn’t seem that hard**\n--------------------------------------------\n\n\nWhen I say that ‘coordination’ can just look like popular opinion punishing an activity, or that other countries don’t have much real incentive to build machines that will kill them, I think a common objection is that convincing people of the real situation is hopeless. The picture seems to be that the argument for AI risk is extremely sophisticated and only able to be appreciated by the most elite of intellectual elites—e.g. it’s hard enough to convince professors on Twitter, so surely the masses are beyond its reach, and foreign governments too. \n\n\nThis doesn’t match my overall experience on various fronts.\n\n\nSome observations:\n\n\n* The [median surveyed ML researcher](https://aiimpacts.org/what-do-ml-researchers-think-about-ai-in-2022/) seems to think AI will destroy humanity with 5-10% chance, as I mentioned\n* [Often people are already intellectually convinced](https://www.lesswrong.com/posts/kipMvuaK3NALvFHc9/what-an-actually-pessimistic-containment-strategy-looks-like) but haven’t integrated that into their behavior, and it isn’t hard to help them organize to act on their tentative beliefs\n* As noted by [Scott](https://astralcodexten.substack.com/p/why-not-slow-ai-progress), a lot of AI safety people have gone into AI capabilities including running AI capabilities orgs, so those people presumably consider AI to be risky already\n* I don’t remember ever having any trouble discussing AI risk with random strangers. Sometimes they are also fairly worried (e.g. a makeup artist at Sephora gave an extended rant about the dangers of advanced AI, and my driver in Santiago excitedly concurred and showed me [*Homo Deus*](https://en.wikipedia.org/wiki/Homo_Deus:_A_Brief_History_of_Tomorrow) open on his front seat). The form of the concerns are probably a bit different from those of the AI Safety community, but I think broadly closer to, ‘AI agents are going to kill us all’ than ‘algorithmic bias will be bad’. I can’t remember how many times I have tried this, but pre-pandemic I used to talk to Uber drivers a lot, due to having no idea how to avoid it. I explained AI risk to my therapist recently, as an aside regarding his sense that I might be catastrophizing, and I feel like it went okay, though we may need to discuss again.\n* My impression is that most people haven’t even come into contact with the arguments that might bring one to agree precisely with the AI safety community. For instance, my guess is that a lot of people assume that someone actually programmed modern AI systems, and if you told them that in fact they are random connections jiggled in an gainful direction unfathomably many times, just as mysterious to their makers, they might also fear misalignment.\n* Nick Bostrom, Eliezer Yudkokwsy, and other early thinkers have had decent success at convincing a bunch of other people to worry about this problem, e.g. me. And to my knowledge, without writing any compelling and accessible account of why one should do so that would take less than two hours to read.\n* I arrogantly think I could write a broadly compelling and accessible case for AI risk\n\n\nMy weak guess is that immovable AI risk skeptics are concentrated in intellectual circles near the AI risk people, especially on Twitter, and that people with less of a horse in the intellectual status race are more readily like, ‘oh yeah, superintelligent robots are probably bad’. It’s not clear that most people even need convincing that there is a problem, though they don’t seem to consider it the most pressing problem in the world. (Though all of this may be different in cultures I am more distant from, e.g. in China.) I’m pretty non-confident about this, but skimming [survey evidence](https://wiki.aiimpacts.org/doku.php?id=responses_to_ai:public_opinion_on_ai:surveys_of_public_opinion_on_ai:surveys_of_us_public_opinion_on_ai&s[]=american&s[]=public&s[]=opinion&s[]=survey) suggests there is substantial though not overwhelming public concern about AI in the US[8](https://aiimpacts.org/feed/?paged=2#footnote-8).\n\n\n**Do you need to convince everyone?**\n-------------------------------------\n\n\nI could be wrong, but I’d guess convincing the ten most relevant leaders of AI labs that this is a massive deal, worth prioritizing, actually gets you a decent slow-down. I don’t have much evidence for this.\n\n\n**Buying time is big**\n----------------------\n\n\nYou probably aren’t going to avoid AGI forever, and maybe huge efforts will buy you a couple of years.[9](https://aiimpacts.org/feed/?paged=2#footnote-9) Could that even be worth it? \n\n\nSeems pretty plausible:\n\n\n1. Whatever kind of other AI safety research or policy work people were doing could be happening at a non-negligible rate per year. (Along with all other efforts to make the situation better—if you buy a year, that’s eight billion extra person years of time, so only a tiny bit has to be spent usefully for this to be big. If a lot of people are worried, that doesn’t seem crazy.)\n2. Geopolitics just changes pretty often. If you seriously think a big determiner of how badly things go is inability to coordinate with certain groups, then every year gets you non-negligible opportunities for the situation changing in a favorable way.\n3. Public opinion can change a lot quickly. If you can only buy one year, you might still be buying a decent shot of people coming around and granting you more years. Perhaps especially if new evidence is actively avalanching in—people changed their minds a lot in February 2020.\n4. Other stuff happens over time. If you can take your doom today or after a couple of years of random events happening, the latter seems non-negligibly better in general.\n\n\nIt is also not obvious to me that these are the time-scales on the table. My sense is that things which are slowed down by regulation or general societal distaste are often slowed down much more than a year or two, and Eliezer’s stories presume that the world is full of collectives either trying to destroy the world or badly mistaken about it, which is not a foregone conclusion.\n\n\n**Delay is probably finite by default**\n---------------------------------------\n\n\nWhile some people worry that any delay would be so short as to be negligible, others seem to fear that if AI research were halted, it would never start again and we would fail to go to space or something. This sounds so wild to me that I think I’m missing too much of the reasoning to usefully counterargue.\n\n\nObstruction doesn’t need discernment\n------------------------------------\n\n\nAnother purported risk of trying to slow things down is that it might involve getting regulators involved, and they might be fairly ignorant about the details of futuristic AI, and so tenaciously make the wrong regulations. Relatedly, if you call on the public to worry about this, they might have inexacting worries that call for impotent solutions and distract from the real disaster.\n\n\nI don’t buy it. If all you want is to slow down a broad area of activity, my guess is that ignorant regulations do just fine at that every day (usually unintentionally). In particular, my impression is that if you mess up regulating things, a usual outcome is that many things are randomly slower than hoped. If you wanted to speed a specific thing up, that’s a very different story, and might require understanding the thing in question.\n\n\nThe same goes for social opposition. Nobody need understand the details of how genetic engineering works for its ascendancy to be seriously impaired by people not liking it. Maybe by their lights it still isn’t optimally undermined yet, but just not liking anything in the vicinity does go a long way.\n\n\nThis has nothing to do with regulation or social shaming specifically. You need to understand much less about a car or a country or a conversation to mess it up than to make it run well. It is a consequence of the [general rule](https://en.wikipedia.org/wiki/Anna_Karenina_principle) that there are many more ways for a thing to be dysfunctional than functional: destruction is easier than creation.\n\n\nBack at the object level, I tentatively expect efforts to broadly slow down things in the vicinity of AI progress to slow down AI progress on net, even if poorly aimed.\n\n\nSafety from speed, clout from complicity\n========================================\n\n\nMaybe it’s actually better for safety to have AI go fast at present, for various reasons. Notably:\n\n\n1. Implementing what can be implemented as soon as possible probably means smoother progress, which is probably safer because a) it makes it harder for one party shoot ahead of everyone and gain power, and b) people make better choices all around if they are correct about what is going on (e.g. they don’t put trust in systems that turn out to be much more powerful than expected).\n2. If the main thing achieved by slowing down AI progress is more time for safety research, and safety research is more effective when carried out in the context of more advanced AI, and there is a certain amount of slowing down that can be done (e.g. because one is in fact in an arms race but has some lead over competitors), then it might better to use one’s slowing budget later.\n3. If there is some underlying curve of potential for progress (e.g. if money that might be spent on hardware just grows a certain amount each year), then perhaps if we push ahead now that will naturally require they be slower later, so it won’t affect the overall time to powerful AI, but will mean we spend more time in the informative pre-catastrophic-AI era.\n4. (More things go here I think)\n\n\nAnd maybe it’s worth it to work on capabilities research at present, for instance because:\n\n\n1. As a researcher, working on capabilities prepares you to work on safety\n2. You think the room where AI happens will afford good options for a person who cares about safety\n\n\nThese all seem plausible. But also plausibly wrong. I don’t know of a decisive analysis of any of these considerations, and am not going to do one here. My impression is that they could basically all go either way.\n\n\nI am actually particularly skeptical of the final argument, because if you believe what I take to be the normal argument for AI risk—that superhuman artificial agents won’t have acceptable values, and will aggressively manifest whatever values they do have, to the sooner or later annihilation of humanity—then the sentiments of the people turning on such machines seem like a very small factor, so long as they still turn the machines on. And I suspect that ‘having a person with my values doing X’ is commonly overrated. But the world is messier than these models, and I’d still pay a lot to be in the room to try.\n\n\nMoods and philosophies, heuristics and attitudes\n================================================\n\n\nIt’s not clear what role these psychological characters should play in a rational assessment of how to act, but I think they do play a role, so I want to argue about them.\n\n\n***Technological choice is not luddism***\n-----------------------------------------\n\n\nSome technologies are better than others [citation not needed]. The best pro-technology visions should disproportionately involve awesome technologies and avoid shitty technologies, I claim. If you think AGI is highly likely to destroy the world, then it is the pinnacle of shittiness as a technology. Being opposed to having it into your techno-utopia is about as luddite as refusing to have [radioactive toothpaste](https://en.wikipedia.org/wiki/Doramad_Radioactive_Toothpaste) there. Colloquially, Luddites are against progress if it comes as technology.[10](https://aiimpacts.org/feed/?paged=2#footnote-10) Even if that’s a terrible position, its wise reversal is not the endorsement of all ‘technology’, regardless of whether it comes as progress.\n\n\n***Non-AGI visions of near-term thriving***\n-------------------------------------------\n\n\nPerhaps slowing down AI progress means foregoing our own generation’s hope for life-changing technologies. Some people thus find it psychologically difficult to aim for less AI progress (with its real personal costs), rather than shooting for the perhaps unlikely ‘safe AGI soon’ scenario.\n\n\nI’m not sure that this is a real dilemma. The narrow AI progress we have seen already—i.e. further applications of current techniques at current scales—seems plausibly able to help a lot with longevity and other medicine for instance. And to the extent AI efforts could be focused on e.g. medically relevant narrow systems over creating agentic scheming gods, it doesn’t sound crazy to imagine making more progress on anti-aging etc as a result (even before taking into account the probability that the agentic scheming god does not prioritize your physical wellbeing as hoped). Others disagree with me here.\n\n\n***Robust priors vs. specific galaxy-brained models***\n------------------------------------------------------\n\n\nThere are things that are robustly good in the world, and things that are good on highly specific inside-view models and terrible if those models are wrong. Slowing dangerous tech development seems like the former, whereas forwarding arms races for dangerous tech between world superpowers seems more like the latter.[11](https://aiimpacts.org/feed/?paged=2#footnote-11) There is a general question of how much to trust your reasoning and risk the galaxy-brained plan.[12](https://aiimpacts.org/feed/?paged=2#footnote-12) But whatever your take on that, I think we should all agree that the less thought you have put into it, the more you should regress to the robustly good actions. Like, if it just occurred to you to take out a large loan to buy a fancy car, you probably shouldn’t do it because most of the time it’s a poor choice. Whereas if you have been thinking about it for a month, you might be sure enough that you are in the rare situation where it will pay off. \n\n\nOn this particular topic, it feels like people are going with the specific galaxy-brained inside-view terrible-if-wrong model off the bat, then not thinking about it more. \n\n\n***Cheems mindset/can’t do attitude***\n--------------------------------------\n\n\nSuppose you have a friend, and you say ‘let’s go to the beach’ to them. Sometimes the friend is like ‘hell yes’ and then even if you don’t have towels or a mode of transport or time or a beach, you make it happen. Other times, even if you have all of those things, and your friend nominally wants to go to the beach, they will note that they have a package coming later, and that it might be windy, and their jacket needs washing. And when you solve those problems, they will note that it’s not that long until dinner time. You might infer that in the latter case your friend just doesn’t want to go to the beach. And sometimes that is the main thing going on! But I think there are also broader differences in attitudes: sometimes people are looking for ways to make things happen, and sometimes they are looking for reasons that they can’t happen. This is sometimes called a ‘[cheems attitude](https://normielisation.substack.com/p/cheems-mindset)’, or I like to call it (more accessibly) a ‘can’t do attitude’.\n\n\nMy experience in talking about slowing down AI with people is that they seem to have a can’t do attitude. They don’t want it to be a reasonable course: they want to write it off. \n\n\nWhich both seems suboptimal, and is strange in contrast with historical attitudes to more technical problem-solving. (As highlighted in my dialogue from the start of the post.)\n\n\nIt seems to me that if the same degree of can’t-do attitude were applied to technical safety, there would be no AI safety community because in 2005 Eliezer would have noticed any obstacles to alignment and given up and gone home.\n\n\nTo quote a friend on this, what would it look like if we \\*actually tried\\*?\n\n\nConclusion\n==========\n\n\nThis has been a miscellany of critiques against a pile of reasons I’ve met for not thinking about slowing down AI progress. I don’t think we’ve seen much reason here to be very pessimistic about slowing down AI, let alone reason for not even thinking about it.\n\n\nI could go either way on whether any interventions to slow down AI in the near term are a good idea. My tentative guess is yes, but my main point here is just that we should think about it.\n\n\nA lot of opinions on this subject seem to me to be poorly thought through, in error, and to have wrongly repelled the further thought that might rectify them. I hope to have helped a bit here by examining some such considerations enough to demonstrate that there are no good grounds for immediate dismissal. There are difficulties and questions, but if the same standards for ambition were applied here as elsewhere, I think we would see answers and action.\n\n\n**Acknowledgements**\n--------------------\n\n\nThanks to Adam Scholl, Matthijs Maas, Joe Carlsmith, Ben Weinstein-Raun, Ronny Fernandez, Aysja Johnson, Jaan Tallinn, Rick Korzekwa, Owain Evans, Andrew Critch, Michael Vassar, Jessica Taylor, Rohin Shah, Jeffrey Heninger, Zach Stein-Perlman, Anthony Aguirre, Matthew Barnett, David Krueger, Harlan Stewart, Rafe Kennedy, Nick Beckstead, Leopold Aschenbrenner, Michaël Trazzi, Oliver Habryka, Shahar Avin, Luke Muehlhauser, Michael Nielsen, Nathan Young and quite a few others for discussion and/or encouragement.\n\n\nNotes\n-----\n\n\n[1](https://aiimpacts.org/feed/?paged=2#footnote-anchor-1) I haven’t heard this in recent times, so maybe views have changed. An example of earlier times: [Nick Beckstead, 2015](https://blog.givewell.org/2015/09/30/differential-technological-development-some-early-thinking/): “One idea we sometimes hear is that it would be harmful to speed up the development of artificial intelligence because not enough work has been done to ensure that when very advanced artificial intelligence is created, it will be safe. This problem, it is argued, would be even worse if progress in the field accelerated. However, very advanced artificial intelligence could be a useful tool for overcoming other potential global catastrophic risks. If it comes sooner—and the world manages to avoid the risks that it poses directly—the world will spend less time at risk from these other factors…. \n \nI found that speeding up advanced artificial intelligence—according to my simple interpretation of these survey results—could easily result in reduced net exposure to the most extreme global catastrophic risks…” \n\n\n\n[2](https://aiimpacts.org/feed/?paged=2#footnote-anchor-2) This is closely related to Bostrom’s **Technological completion conjecture:** “If scientific and technological development efforts do not effectively cease, then all important basic capabilities that could be obtained through some possible technology will be obtained.” (Bostrom, *Superintelligence*, pp. 228, Chapter 14, 2014) \n \nBostrom illustrates this kind of position (though apparently rejects it; from Superintelligence, found [here](https://forum.effectivealtruism.org/posts/g6549FAQpQ5xobihj/differential-technological-development)): “Suppose that a policymaker proposes to cut funding for a certain research field, out of concern for the risks or long-term consequences of some hypothetical technology that might eventually grow from its soil. She can then expect a howl of opposition from the research community. Scientists and their public advocates often say that it is futile to try to control the evolution of technology by blocking research. If some technology is feasible (the argument goes) it will be developed regardless of any particular policymaker’s scruples about speculative future risks. Indeed, the more powerful the capabilities that a line of development promises to produce, the surer we can be that somebody, somewhere, will be motivated to pursue it. Funding cuts will not stop progress or forestall its concomitant dangers.” \n \nThis kind of thing is also discussed by [Dafoe](https://journals.sagepub.com/doi/10.1177/0162243915579283) and [Sundaram, Maas & Beard](https://papers.ssrn.com/sol3/papers.cfm?abstract_id=4118618) \n\n\n\n[3](https://aiimpacts.org/feed/?paged=2#footnote-anchor-3) (Some inspiration from Matthijs Maas’ [spreadsheet](https://airtable.com/shrVHVYqGnmAyEGsz), from [Paths Untaken](https://verfassungsblog.de/paths-untaken/), and from GPT-3.)\n\n\n[4](https://aiimpacts.org/feed/?paged=2#footnote-anchor-4) From a private conversation with Rick Korzekwa, who may have read
“Innovation inducement prize (IIP): Sometimes referred to as simply an ‘innovation prize’, an IIP rewards whoever can first or most effectively meet a predefined challenge. The reward is often financial but can also include additional support, such as technical assistance. This type of prize incentivises innovation rather than rewarding past achievement (prizes that do this, such as the Nobel Prize, are referred to as recognition prizes).”
Jessica Roberts, Cheryl Brown, Clare Stott (2019) Using innovation inducement prizes for development: what more has been learned? https://www.gov.uk/research-for-development-outputs/using-innovation-inducement-prizes-for-development-what-more-has-been-learned\")\n### Methodology\n\n\nWe spent approximately 10-12 hours researching prizes for technological and intellectual progress, such as crossing the ocean or proving a mathematical theorem. For inclusion in our list, a prize needed to be:\n\n\n1. Offered for accomplishing a well-specified goal that is reached primarily through intellectual or technological progress.\n2. Announced before the goal had been achieved, with a specific prize amount.\n\n\nFor each prize, we tried to answer several questions:\n\n\n* What are the basic parameters, such as the prize amount, the conditions for winning, the year it was announced, and the financial sponsor?\n* Was the prize collected, and if so, by whom?\n* Was the prize’s goal achieved in the intended time frame and for the original prize amount?\n* Were there other notable consequences of the prize, such as increased interest in relevant industries or a change in public perception of the party offering the prize?\n\n\nWe were unable to answer every question for every prize in the time allotted to the project, nor were we able to investigate every prize that appeared to match our criteria.\n\n\n### Dataset\n\n\nThis table contains a condensed version of our dataset. The full dataset with sources can be found in this [Google Sheet](https://docs.google.com/spreadsheets/d/1Y1Wb5-fw3Eulbv5EtI3qNRHcpmjY1OT9rA3u-QS0bBY/edit?usp=sharing).\n\n\n\n\n| **Prize Name** | **Organization or Financial Sponsor** | **Years** | **Prize Amount** (2022 $M) | **Outcome** | **Problem Area** | **Winner** |\n| --- | --- | --- | --- | --- | --- | --- |\n| XPrize (6 prizes) | XPrize | 1996-2025 | 5 – 100 | 5 ongoing 1 awarded | Various | Scaled Composites |\n| NASA Green Flight Challenge | NASA | 2009 -2011 | 1.80 | Awarded | Aviation | Pipistrel-USA |\n| DARPA Grand Challenge | DARPA | 2004-2005 | 3.10 | Awarded | Autonomous vehicles | Stanford Racing Team |\n| Millenium Problems | Clay Mathematics Institute | 2000-2010 | 1.00 each(1.7 in 2000) | 6 ongoing 1 awarded | Mathematics | Grigoriy Perelman |\n| Kremer Prize | Henry Kremer | 1959-1977 | 0.52 | Awarded | Aviation | Dr. Paul MacCready |\n| Orteig Prize | Raymond Orteig | 1919-1927 | 0.44 | Awarded | Aviation | Charles Lindbergh |\n| Daily Mail Prizes | Daily Mail | 1906-1930 | .015 – 1.5 | Other | Aviation | (Various) |\n| Longitude Prize | British Government | 1714-1735 | 5.72 | Awarded | Navigation at sea | John Harrison |\n\n\n*Primary author: Elizabeth Santos* \n*Additional writing and research: Rick Korzekwa*\n\n\nNotes\n-----\n\n\n\n\n", "url": "https://aiimpacts.org/outcomes-of-inducement-prizes/", "title": "Outcomes of inducement prizes", "source": "aiimpacts.org", "source_type": "wordpress", "date_published": "2022-08-30T01:34:00+00:00", "paged_url": "https://aiimpacts.org/feed?paged=2", "authors": ["Katja Grace"], "id": "289c514fa97cfed2dfaf63ebd3451d17", "summary": []} {"text": "Will Superhuman AI be created?\n\n*Published 6 Aug 2022*\n\n\n*This page may represent little of what is known on the topic. It is incomplete, under active work and may be updated soon.*\n\n\nSuperhuman AI appears to be very likely to be created at some point.\n\n\nDetails\n-------\n\n\nLet ‘superhuman’ AI be a set of AI systems that together achieve human-level performance across virtually all tasks (i.e. [HLMI](https://aiimpacts.org/human-level-ai/#High_Level_Machine_Intelligence_HLMI)) and substantially surpass human-level performance on some tasks.\n\n\n### Arguments\n\n\n#### A. Superhuman AI is very likely to be physically possible\n\n\n##### 1. Human brains prove that it is physically possible to create human-level intelligence\n\n\nA single human brain is not an existence proof of human-level intelligence according to our definition, because no specific human brain is able to perform at the level of any human brain, on all tasks. Given only the observation of the existence of human brains, it could conceivably be impossible to build a machine that performs any task at the level of any chosen human brain at the total cost of a single human brain. For instance, if each brain could only hold the information required to specialize in one career, then a machine that could do any career would need to store much more information than a brain, and thus could be more expensive.\n\n\nThe entire population of human brains together could be said to perform at ‘human-level’, if the cost of doing a single task is considered to be the cost of the single person’s labor used for that task, rather than the cost of maintaining the entire human race. This seems like a reasonable accounting for the present purposes. Thus, the entire collection of human brains demonstrates that it is physically possible to have a system which can do any task as well as the most proficient human, and can do marginal tasks at the cost of human labor (even if the cost of maintaining the entire system would be much higher, were it not spread between many tasks).\n\n\n##### 2. We know of no reason to expect that human brains are near the limits of possible intelligence\n\n\nHuman brains do appear to be near the limits of performance for some specific tasks. For instance, humans can play tic-tac-toe perfectly. Also for many tasks, human performance reaps a lot of the value potentially available, so it is impossible to perform much better in terms of value (e.g. selecting lunch from a menu, making a booking, recording a phone number). \n\n\nHowever, many tasks do not appear to be like this (e.g. winning at Go), and even for the above mentioned tasks, there is room to carry out the task substantially faster or more cheaply than a human does. Thus there appears to be room for substantially better-than-human performance on a wide range of tasks, though we have not seen a careful accounting of this.\n\n\n##### 3. Artificial minds appear to have some intrinsic advantages over human minds\n\n\na) Human brains developed under constraints that would not apply to artificial brains. In particular, energy use was a more important cost, and there were reproductive constraints to human head size. \n\n\nb) Machines appear to have huge potential performance advantages over biological systems on some fronts. Carlsmith summarizes Bostrom[1](https://aiimpacts.org/argument-for-likelihood-of-superhuman-ai/#easy-footnote-bottom-1-3001 \"Carlsmith, Joseph. “Is Power-Seeking AI an Existential Risk? [Draft].” Open Philanthropy Project, April 2021. https://docs.google.com/document/d/1smaI1lagHHcrhoi6ohdq3TYIZv0eNWWZMPEy8C8byYg/edit?usp=embed_facebook.
Bostrom, Nick. Superintelligence: Paths, Dangers, Strategies. 1st edition. Oxford: Oxford University Press, 2014.\"):\n\n\n\n> Thus, as Bostrom (2014, Chapter 3) discusses, where neurons can fire a maximum of hundreds of Hz, the clock speed of modern computers can reach some 2 Ghz — ~ten million times faster. Where action potentials travel at some hundreds of m/s, optical communication can take place at 300,000,000 m/s — ~ a million times faster. Where brain size and neuron count are limited by cranial volume, metabolic constraints, and other factors, supercomputers can be the size of warehouses. And artificial systems need not suffer, either, from the brain’s constraints with respect to memory and component reliability, input/output bandwidth, tiring after hours, degrading after decades, storing its own repair mechanisms and blueprints inside itself, and so forth. Artificial systems can also be edited and duplicated much more easily than brains, and information can be more easily transferred between them.\n> \n> \n\n\n##### 4. Superhuman AI is very likely to be physically possible (from 1-3)\n\n\nThe human species exists (1). There seems little reason to think that no system could perform tasks substantially better (2), and multiple moderately strong reasons to think that more capable systems are possible (3). Thus it seems very likely that more capable systems are possible.\n\n\n##### 5. The likely physical possibility of superhuman AI minds strongly suggests the physical feasibility of creating such minds\n\n\nA superhuman mind is a physically possible object (4). However, that a physical configuration is possible does not imply that bringing about such a configuration intentionally can be feasible in practice. For an example of the difference, a waterfall whose water is in exactly the configuration as that of the Niagara Falls for the last ten minutes is physically possible (the Niagara Falls just did it), yet bringing this about again intentionally may remain intractable forever.\n\n\nIn fact we know that human brains specifically are not only physically possible, but feasible for humans to create. However this is in the form of biological reproduction, and does not appear to straightforwardly imply that humans can create arbitrary different systems with at least the intelligence of humans. That is, human creation of human brains does not obviously imply that it is possible for humans to intentionally create human-level intelligence that isn’t a human brain. \n\n\nHowever it seems strongly suggestive. If a physical configuration is possible, natural reasons it might be intractable to bring about are a) that it is computationally difficult to transform the given reference to an actionable description of the physical state required (e.g. ‘Niagara Falls ten minutes ago’ points at a particular configuration of water, but not in a way that is easily convertible to a detailed specification of the locations of that water[2](https://aiimpacts.org/argument-for-likelihood-of-superhuman-ai/#easy-footnote-bottom-2-3001 \"Another example of evident physical possibility diverging from tractability that is being given the output of a hash function and wanting to create an input that produces that output\")), and b) the actionable description is hard to bring about. For instance, it might require minute manipulation of particles beyond what is feasible today, either to get the required degree of specificity, or to avoid chaotic dynamics taking the system away from the desired state even at a macroscopic level (e.g. even if your description of the starting state of the waterfall is fairly detailed, it will quickly diverge farther from the real waterfall.)\n\n\nThese issues don’t appear to apply to creating superhuman intelligence, so in the absence of other evident defeaters, its physical possibility seems to strongly suggest its physical feasibility.\n\n\n##### 6. Contemporary AI systems exhibit qualitatively similar capabilities to human minds, suggesting modified versions of similar processes would give rise to capabilities matching human minds.\n\n\nThat is, given that current AI techniques create systems that do a lot of human-like tasks at some level of performance, e.g. recognize images and write human-like language, it would be somewhat surprising if getting to human level performance on these tasks required such starkly different methods as to be impossible.\n\n\n##### 7. Superhuman AI systems will very likely be physically feasible to create (from 4-6)\n\n\nSuperhuman AI systems are probably physically possible (4), and this suggests that they are feasible to create (5). Separately, presently feasible AI systems exhibit qualitatively similar behavior to human minds (6), weakly suggesting that systems exhibiting similar behavior at a higher level of performance will also be feasible to create.\n\n\n#### B. If feasible, superhuman AI will very likely be created\n\n\n##### 8. Superhuman AI would appear to be very economically valuable, given its potential to do most human work better or more cheaply\n\n\nWhenever such minds become feasible, by stipulation they will be superior in ways to existing sources of cognitive labor, or those sources would have already constituted superhuman AI. Unless the gap is quite small between human-level AI and the best feasible superhuman AI (which seems unlikely given the large potential room for improvement over human minds), the economic value from superhuman AI should be at least at the scale of the global labor market. \n\n\n##### 9. It appears there will be large incentives to create such systems (from 8)\n\n\nThat a situation would make large amounts of economic value available does not imply that any individual has an incentive to make that situation happen, because the value may not accrue to the possible decision maker. In this case however, substantial parts of the economic value created by superhuman AI systems appear likely to be captured by their creators, by analogy to other commercial software. \n\n\nThese economic incentives may not be the only substantial incentives in play. Creating such systems could incur social or legal consequences which could negate the positive incentives. Thus this step is relatively uncertain.\n\n\n##### 10. Superhuman AI seems likely to be created\n\n\nGiven that creation of a type of machine is physically feasible (7) and strongly incentivized (9), it seems likely that it will be created.\n\n\nNotes\n-----\n\n", "url": "https://aiimpacts.org/argument-for-likelihood-of-superhuman-ai/", "title": "Will Superhuman AI be created?", "source": "aiimpacts.org", "source_type": "wordpress", "date_published": "2022-08-08T09:07:00+00:00", "paged_url": "https://aiimpacts.org/feed?paged=3", "authors": ["Katja Grace"], "id": "cdf546a3789506f463854c60182c7900", "summary": []} {"text": "List of sources arguing against existential risk from AI\n\n*Published 6 Aug 2022*\n\n\n*This page is incomplete, under active work and may be updated soon.*\n\n\nThis is a bibliography of pieces arguing against the idea that AI poses an existential risk.\n\n\nList\n----\n\n\n**Cegłowski, Maciej. “Superintelligence: The Idea That Eats Smart People.”** *Idle Words* (blog). Accessed December 9, 2021.
\"):\n\n\n1. *Argument from large impacts*. Even if we’re very uncertain about what AGI development and deployment will look like, it seems likely that AGI will have a very large impact on the world in general, and that further investigation into how to direct that impact could prove very valuable.\n\t1. Weak version: development of AGI will be at least as big an economic jump as the industrial revolution, and therefore affect the trajectory of the long-term future. See [Ben Garfinkel’s talk at EA Global London 2018](https://forum.effectivealtruism.org/posts/9sBAW3qKppnoG3QPq/ben-garfinkel-how-sure-are-we-about-this-ai-stuff). Ben noted that to consider work on AI safety important, we also need to believe the additional claim that there are feasible ways to positively influence the long-term effects of AI development – something which may not have been true for the industrial revolution. (Personally my guess is that since AI development will happen more quickly than the industrial revolution, power will be more concentrated during the transition period, and so influencing its long-term effects will be more tractable.)\n\t2. Strong version: development of AGI will make humans the second most intelligent species on the planet. Given that it was our intelligence which allowed us to control the world to the large extent that we do, we should expect that entities which are much more intelligent than us will end up controlling our future, unless there are reliable and feasible ways to prevent it. So far we have not discovered any.\n\n\n(We treat 2 as a separate argument, ‘*[Argument from most intelligent species](https://aiimpacts.org/argument-from-most-intelligent-species/)*‘.)\n\n\nNotes\n-----\n\n", "url": "https://aiimpacts.org/argument-from-large-impacts/", "title": "Argument for AI x-risk from large impacts", "source": "aiimpacts.org", "source_type": "wordpress", "date_published": "2021-09-28T18:32:00+00:00", "paged_url": "https://aiimpacts.org/feed?paged=4", "authors": ["Katja Grace"], "id": "bece283551d96e9efefeb0abc5fe0533", "summary": []} {"text": "Beyond fire alarms: freeing the groupstruck\n\n\n*Katja Grace, 9 September 2021*\n\n\n*[Content warning: death in fires, death in machine apocalypse]*\n\n\n‘No fire alarms for AGI’\n------------------------\n\n\nEliezer Yudkowsky wrote that ‘[there’s no fire alarm for Artificial General Intelligence](https://intelligence.org/2017/10/13/fire-alarm/)’, by which I think he meant: ‘there will be no future AI development that proves that artificial general intelligence (AGI) is a problem clearly enough that the world gets common knowledge (i.e. everyone knows that everyone knows, etc) that freaking out about AGI is socially acceptable instead of embarrassing.’\n\n\nHe calls this kind of event a ‘fire alarm’ because he posits that this is how fire alarms work: rather than alerting you to a fire, they primarily help by making it common knowledge that it has become socially acceptable to act on the potential fire.\n\n\nHe supports this view with a great 1968 study by Darley and Latané, in which they found that if you pipe a white plume of ‘smoke’ through a vent into a room where participants fill out surveys, a lone participant will quickly leave to report it, whereas a group of three (innocent) participants will tend to sit by in the haze for much longer[1](https://aiimpacts.org/feed/?paged=4#fn:1).\n\n\n[Here’s](https://www.youtube.com/watch?v=vjP22DpYYh8) a video of a rerun[2](https://aiimpacts.org/feed/?paged=4#fn:2) of part of this experiment, if you want to see what people look like while they try to negotiate the dual dangers of fire and social awkwardness.\n\n\n \n\n\n\nA salient explanation for this observation[3](https://aiimpacts.org/feed/?paged=4#fn:3) is that people don’t want to look fearful, and are perhaps repeatedly hit by this bias when they interpret one another’s outwardly chill demeanor as evidence that all is fine. (Darley and Latané favor a similar hypothesis, but where people just fail to interpret a stimulus as possibly dangerous if others around them are relaxed.)\n\n\nSo on that hypothesis, thinks Eliezer, fire alarms can cut past the inadvertent game of chicken produced by everyone’s signaling-infused judgment, and make it known to all that it really is fire-fleeing time, thus allowing face-saving safe escape.\n\n\nWith AI, Eliezer thinks people are essentially sitting by in the smoke, saying ‘looks fine to me’ to themselves and each other to avoid seeming panicky. And so they seem to be in need the analogue of a fire alarm, and also (at least implicitly) seem to be expecting one: assuming that if there were a real ‘fire’, the fire alarm would go off and they could respond then without shame. For instance, maybe new progress would make AI obviously an imminent risk to humanity, instead of a finicky and expensive bad writing generator, and then everyone would see together that action was needed. Eliezer argues that this isn’t going to happen—and more strongly (though confusingly to me) that things will look basically similar until AGI—and so he seems to think that people should get a grip now and act on the current smoke or they will sit by forever.\n\n\nMy take\n-------\n\n\nI forcefully agree with about half of the things in that post, but this understanding of fire alarms—and the importance of there not being one for AGI—is in the other half.\n\n\nIt’s not that I expect a ‘fire alarm’ for AGI—I’m agnostic—it’s just that fire alarms like this don’t seem to be that much of a thing, and are not how we usually escape dangers—including fires—even when group action is encumbered by embarrassment. I doubt that people are waiting for a fire alarm or need one. More likely they are waiting for the normal dance of accumulating evidence and escalating discussion and brave people calling the problem early and eating the potential embarrassment. I do admit that this dance doesn’t look obviously up to the challenge, and arguably looks fairly unhealthy. But I don’t think it’s hopeless. In a world of uncertainty and a general dearth of fire alarms, there is much concern about things, and action, and I don’t think it is entirely uncalibrated. The public consciousness may well be oppressed by shame around showing fear, and so be slower and more cautious than it should be. But I think we should be thinking about ways to free it and make it healthy. We should not be thinking of this as total paralysis waiting for a magical fire alarm that won’t come, in the face of which one chooses between acting now before conviction, or waiting to die.\n\n\nTo lay out these pictures side by side:\n\n\nEliezer’s model, as I understand it:\n\n\n* People generally don’t act on a risk if they feel like others might judge their demonstrated fear (which they misdescribe to themselves as uncertainty about the issue at hand)\n* This ‘uncertainty’ will continue fairly uniformly until AGI\n* This curse could be lifted by a ‘fire alarm’, and people act as if they think there will be one\n* ‘Fire alarms’ don’t exist for AGI\n* So people can choose whether to act in their current uncertainty or to sit waiting until it is too late\n* Recognizing that the default inaction stems not from reasonable judgment, but from a questionable aspect of social psychology that does not appear properly sensitive to the stakes, one should choose to act.\n\n\nMy model:\n\n\n* People act less on risks on average when observed. Across many people this means a slower ratcheting of concern and action (but way more than none).\n* The situation, the evidence and the social processing of these will continue to evolve until AGI.\n* (This process could be sped up by an event that caused global common knowledge that it is socially acceptable to act on the issue—assuming that that is the answer that would be reached—but this is also true of Eliezer having mind control, and fire alarms don’t seem that much more important to focus on than the hypothetical results of other implausible interventions on the situation)\n* People can choose at what point in a gradual escalation of evidence and public consciousness to act\n* Recognizing that the conversation is biased toward nonchalance by a questionable aspect of social psychology that does not appear properly sensitive to the stakes, one should try to adjust for this bias individually, and look for ways to mitigate its effects on the larger conversation.\n\n\n(It’s plausible that I misunderstand Eliezer, in which case I’m arguing with the sense of things I got from misreading his post, in case others have the same.)\n\n\nIf most people at some point believed that the world was flat, and weren’t excited about taking an awkward contrarian stance on the topic, then it would indeed be nice if an event took place that caused basically everyone to have common knowledge that the world is so blatantly round that it can no longer be embarrassing to believe it so. But that’s not a kind of thing that happens, and in the absence of that, there would still be a lot of hope from things like incremental evidence, discussion, and some individuals putting their necks out and making the way less embarrassing for others. You don’t need some threshold being hit, or even a change in the empirical situation, or common knowledge being produced, or or all of these things at once, for the group to become much more correct. And in the absence of hope for a world-is-round alarm, believing that the world is round in advance because you think it might be and know that there isn’t an alarm probably isn’t the right policy.\n\n\nIn sum, I think our interest here should actually be on the broader issue of social effects systematically dampening society’s responses to risks, rather than on ‘fire alarms’ per se. And this seems like a real problem with tractable remedies, which I shall go into.\n\n\nI. Do ‘fire alarms’ show up in the real world?\n==============================================\n\n\nClaim: there are not a lot of ‘fire alarms’ for anything, including fires.\n\n\nHow do literal alarms for fires work?\n-------------------------------------\n\n\n*Note: this section contains way more than you might ever want to think about how fire alarms work, and I don’t mean to imply that you should do so anyway. Just that if you want to assess my claim that fire alarms don’t work as Eliezer thinks, this is some reasoning.*\n\n\nEliezer:\n\n\n\n> \n> “One might think that the function of a fire alarm is to provide you with important evidence about a fire existing, allowing you to change your policy accordingly and exit the building.\n> \n> \n> In the classic experiment by Latane and Darley in 1968, eight groups of three students each were asked to fill out a questionnaire in a room that shortly after began filling up with smoke. Five out of the eight groups didn’t react or report the smoke, even as it became dense enough to make them start coughing. Subsequent manipulations showed that a lone student will respond 75% of the time; while a student accompanied by two actors told to feign apathy will respond only 10% of the time. This and other experiments seemed to pin down that what’s happening is pluralistic ignorance. We don’t want to look panicky by being afraid of what isn’t an emergency, so we try to look calm while glancing out of the corners of our eyes to see how others are reacting, but of course they are also trying to look calm…\n> \n> \n> …A fire alarm creates common knowledge, in the you-know-I-know sense, that there is a fire; after which it is socially safe to react. When the fire alarm goes off, you know that everyone else knows there is a fire, you know you won’t lose face if you proceed to exit the building.\n> \n> \n> The fire alarm doesn’t tell us with certainty that a fire is there. In fact, I can’t recall one time in my life when, exiting a building on a fire alarm, there was an actual fire. Really, a fire alarm is weaker evidence of fire than smoke coming from under a door.\n> \n> \n> But the fire alarm tells us that it’s socially okay to react to the fire. It promises us with certainty that we won’t be embarrassed if we now proceed to exit in an orderly fashion.”\n> \n> \n> \n\n\nI don’t think this is actually how fire alarms work. Which you might think is a nitpick, since fire alarms here are a metaphor for AI epistemology, but I think it matters, because it seems to be the basis for expecting this concept of a ‘fire alarm’ to show up in the world. As in, ‘if only AI risk were like fires, with their nice simple fire alarms’.\n\n\nBefore we get to that though, let’s restate Eliezer’s theory of fire response behavior here, to be clear (most of it also being posited but not quite favored by Darley and Latané):\n\n\n1. People don’t like to look overly scared\n2. Thus they respond less cautiously to ambiguous signs of danger when observed than when alone\n3. People look to one another for evidence about the degree of risk they are facing\n4. Individual underaction (2) is amplified in groups via each member observing the others’ underaction (3) and inferring greater safety, then underacting on top of that (2).\n5. The main function of a fire alarm is to create common knowledge that the situation is such that it is socially acceptable to take a precaution, e.g. run away.\n\n\nI’m going to call hypotheses in the vein of points 1-4 ‘fear shame’ hypotheses.\n\n\n**fear shame hypothesis: the expectation of negative judgments about fearfulness ubiquitously suppress public caution.**\n\n\nI’m not sure about this, but I’ll tentatively concede it and just dispute point 5.\n\n\n### Fire alarms don’t solve group paralysis\n\n\nA first thing to note is that fire alarms just actually don’t solve this kind of group paralysis, at least not reliably. For instance, if you look again closely at the rerun of the Darley and Latané experiment that I mentioned above, they just actually have a fire alarm[4](https://aiimpacts.org/feed/?paged=4#fn:4), as well as smoke, and this seems to be no impediment to the demonstration:\n\n\n \n\n\n\nThe fire alarm doesn’t seem to change the high level conclusion: the lone individual jumps up to investigate, and the people accompanied by a bunch of actors stay in the room even with the fire alarm ringing.\n\n\nAnd [here](https://www.fireco.uk/3-reasons-people-ignore-fire-alarms/) is a simpler experiment entirely focusing on what people do if they hear a fire alarm:\n\n\n \n\n\n\nAnswer: these people wait in place for someone to tell them what to do, many getting increasingly personally nervous. The participant’s descriptions of this are interesting. Quite a few seem to assume that someone else will come and lead them outside if it is important.\n\n\nMaybe it’s some kind of experiment thing? Or a weird British thing? But it seems at least fairly common for people not to react to fire alarms. Here are a recent month’s tweets on the topic:\n\n\n\n> \n> Lmaoo the fire alarm is going off in Newark Airport and everyone is ignoring it\n> \n> \n> — andy (@Andy\\_Val16)\n> [August 21, 2021](https://twitter.com/Andy_Val16/status/1429199567191482385?ref_src=twsrc%5Etfw)\n> \n> \n> \n\n\n\n> \n> Ignoring my fire alarm once again \n> \n> \n> — Socks  (@SockTheDogThing) [August 16, 2021](https://twitter.com/SockTheDogThing/status/1427259406488571904?ref_src=twsrc%5Etfw)\n> \n> \n> \n\n\n\n> \n> Fire alarm is going off in my building and only like 5 people are outside. So everyone is just ignoring the emergency.? There’s a fire btw)\n> \n> \n> — Gary? (@ProbsArmenian)\n> [August 17, 2021](https://twitter.com/ProbsArmenian/status/1427535510671544323?ref_src=twsrc%5Etfw)\n> \n> \n> \n\n\n\n> \n> I’m mad we really all just ignoring this fire alarm at the hospital \n> \n> \n> — ROXANNE (@medicyn22) [August 13, 2021](https://twitter.com/medicyn22/status/1426094169274077185?ref_src=twsrc%5Etfw)\n> \n> \n> \n\n\n\n> \n> That’s the fire alarm going off again with the [@WFANmornings](https://twitter.com/WFANmornings?ref_src=twsrc%5Etfw) in the background. I guess we’re just ignoring the fire alarm it keeps going off. [#safeworkplace](https://twitter.com/hashtag/safeworkplace?src=hash&ref_src=twsrc%5Etfw) [#ignorethealarm](https://twitter.com/hashtag/ignorethealarm?src=hash&ref_src=twsrc%5Etfw) [pic.twitter.com/uTc03ko7PI](https://t.co/uTc03ko7PI)\n> \n> \n> —  Matt M  (@MetsFanMatthew) [August 11, 2021](https://twitter.com/MetsFanMatthew/status/1425399633614938114?ref_src=twsrc%5Etfw)\n> \n> \n> \n\n\n\n> \n> \n> Had our fire alarms going off at work and I knew that one of our directors was having a meeting. I interrupted the meeting of men ignoring the fire alarm and I said they had to get out of the building. They hesitated, I persisted. The meeting was with town fire marshal reps.\n> \n> \n> — Chris Keleher-Pierce (@Acoustic1234) [August 5, 2021](https://twitter.com/Acoustic1234/status/1423302819357073414?ref_src=twsrc%5Etfw)\n> \n> \n> \n\n\n\n> \n> Howard girls ignoring the Quad fire alarm every day
Richardson, Philip L., Ewan D. Wakefield, and Richard A. Phillips. “Flight Speed and Performance of the Wandering Albatross with Respect to Wind.” Movement Ecology 6, no. 1 (March 7, 2018): 3. https://doi.org/10.1186/s40462-018-0121-9.
\n\n\n\nSee page on monarch butterflies for details of their soaring behavior.\") The energy gains from these techniques were not included in the final score, and entries were not penalized for spending a larger fraction of time gliding. It seems likely that paramotor pilots use similar techniques, since paramotors are well suited to gliding (being paragliders with propeller motors strapped to the backs of their pilots). Our energy efficiency estimate for the paramotor came from a record breaking distance flight in which the quantity of available fuel was limited, and so it is likely that some gliding was used to increase the distance traveled as much as possible.\n\n\nWhen multiple input values could have been used, such as the takeoff weight and the landing weight, or different estimates for the energetic costs of different kinds of flight for the Monarch butterfly, we generally calculated a high and a low estimate, taking the most optimistic and pessimistic inputs respectively. In all cases, the resulting best and worst estimates differed by less than a factor of ten. \n\n\n### Selection of case studies\n\n\nWe selected case studies informally, according to judgments about possible high energy efficiencies, and with an eye to exploring a wider range of case studies.\n\n\nWe started by looking at the Boeing 747-400 plane, the Wandering Albatross, and the Monarch Butterfly. We chose the animals for both being known for their abilities to fly long distances, and for both having fairly different body plans.\n\n\nAll three scored surprisingly similarly on distance times weight per energy (details below). This prompted us to look for engineered solutions that were optimized for fuel efficiency. To that end, we looked at paramotors and record breaking flying machines. In the latter category, we found the MacCready Gassomer Albatross, which was a human powered flying device that crossed the English Channel, and the Spirit of Butts’ Farm, which was a model airplane that crossed the Atlantic on one gallon of gasoline. \n\n\nFor reasons that are now obscure, we also included a number of different planes.\n\n\nWe would have liked to include microdrones, since they are different enough from other entries that they might be unusually efficient. However we did not find data on them.\n\n\n### Case studies\n\n\nThese are the full articles calculating the efficiencies of different flying machines and animals: \n\n\n* [Wright Flyer](https://aiimpacts.org/energy-efficiency-of-wright-flyer/)\n* [Wright model B](https://aiimpacts.org/energy-efficiency-of-wright-model-b/)\n* [Vickers Vimy](https://aiimpacts.org/energy-efficiency-of-vickers-vimy-plane/)\n* [North American P-51 Mustang](https://aiimpacts.org/energy-efficiency-of-north-american-p-51-mustang/)\n* [Paramotors](https://aiimpacts.org/energy-efficiency-of-paramotors/)\n* [The Spirit of Butt’s Farm](https://aiimpacts.org/energy-efficiency-of-the-spirit-of-butts-farm/)\n* [Monarch butterfly](https://aiimpacts.org/energy-efficiency-of-monarch-butterfly-flight/)\n* [MacCready Gossamer Albatross](https://aiimpacts.org/maccready-gossamer-albatross/)\n* [Airbus A-320](https://aiimpacts.org/energy-efficiency-of-airbus-a320/)\n* [Boeing 747-400](https://aiimpacts.org/energy-efficiency-of-boeing-747-400/)\n* [Wandering albatross](https://aiimpacts.org/energy-efficiency-of-wandering-albatross-flight/)\n\n\n### Summary results\n\n\nResults are available in Table 1 below, and in [this spreadsheet](https://docs.google.com/spreadsheets/d/1hMyKszvJx4A-A-qlL-frQATnb7Wv9bI51ennFbbi_wU/edit?usp=sharing). Figures 1 and 2 below illustrate the equivalent questions of how far each of these animals and machines can fly, given either the same amount of fuel energy, or fuel energy proportional to their body mass.\n\n\n\n\n| Name | natural or human-engineered | | kg⋅m/J | | | | | m/kJ | |\n| --- | --- | --- | --- | --- | --- | --- | --- | --- | --- |\n| | | worst | mean | best | | | worst | mean | best |\n| Monarch Butterfly | natural | 0.065 | 0.21 | 0.36 | | | 100000 | 350000 | 600000 |\n| Wandering Albatross | natural | 1.4 | 2.2 | 3 | | | 240 | 240 | 240 |\n| The Spirit of Butt’s Farm | human-engineered | 0.086 | 0.12 | 0.16 | | | 32 | 32 | 32 |\n| MacGready Gossamer Albatross | human-engineered | 0.19 | 0.32 | 0.46 | | | 2 | 3.3 | 4.6 |\n| Paramotor | human-engineered | 0.058 | 0.079 | 0.1 | | | 0.36 | 0.36 | 0.36 |\n| Wright model B | human-engineered | 0.036 | 0.078 | 0.12 | | | 0.1 | 0.16 | 0.21 |\n| Wright Flyer | human-engineered | 0.022 | 0.042 | 0.061 | | | 0.080 | 0.13 | 0.18 |\n| North American P-51 Mustang | human-engineered | 0.25 | 0.38 | 0.5 | | | 0.073 | 0.083 | 0.092 |\n| Vickers Vimy | human-engineered | 0.081 | 0.17 | 0.25 | | | 0.025 | 0.038 | 0.05 |\n| Airbus A320 | human-engineered | 0.33 | 0.47 | 0.61 | | | 0.0078 | 0.0078 | 0.0078 |\n| Boeing 747-400 | human-engineered | 0.39 | 0.61 | 0.83 | | | 0.0021 | 0.0021 | 0.0021 |\n\n\n\n**Table 1: Energy efficiency of flight for a variety of natural and man-made flying entities.**\n\n\n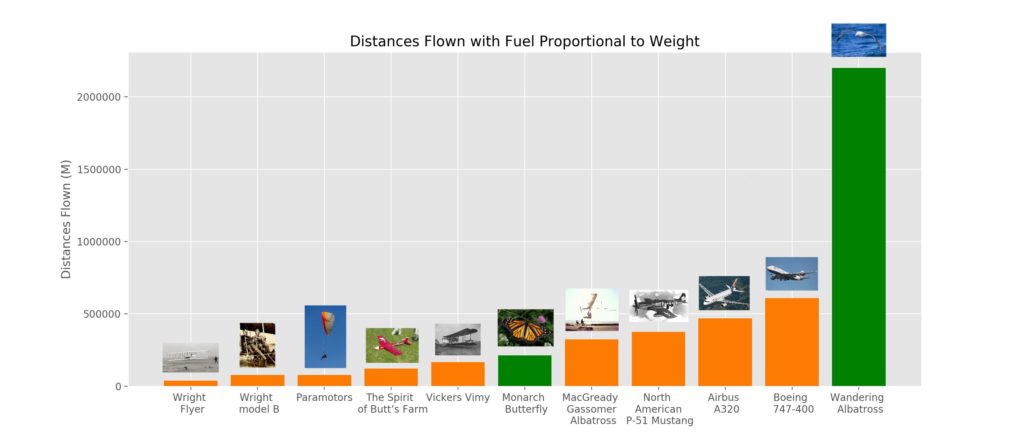**Figure 1: If you give each animal or machine energy proportional to its weight, how far can it fly?** \n\nOn mass⋅distance/energy, evolution beats engineers, but they are relatively evenly matched: the albatross (1.4-3.0 kg.m/J) and the Boeing 747-400 (0.39-0.83 kg.m/J) are the best in the natural and engineered classes respectively. Thus the best natural solution we found was roughly 2x-8x more efficient than the human-engineered one.[2](https://aiimpacts.org/are-human-engineered-flight-designs-better-or-worse-than-natural-ones/#easy-footnote-bottom-2-2715 \"For the best case for engineers we compare the Boeing 747-400’s best score to the Albatross’s worst, and for the best case for evolution we do the opposite. This gives an advantage for evolution by a factor of somewhere between 1.7 and 7.7.\") We found several flying machines more efficient on this metric than the monarch butterfly.\n\n\n**Figure 2: How far animals and machines can fly on the same amount of energy. Note that the vertical axis is log scaled, unlike that of Figure 1, so smaller looking differences are in fact much larger: over eight orders of magnitude (vs less than two in Figure 1).** \n\nOn distance/energy, the natural solutions have a much larger advantage. Both are better than all man-made solutions we considered. The best natural and engineered solutions respectively are the monarch butterfly (100,000-600,000 m/kJ) and the Spirit of Butts’ Farm (32 m/kJ), for roughly a 3,000x to 20,000x advantage to natural evolution.\n\n\n\n### Interpretation\n\n\nWe take this as weak evidence about the best possible distance/energy and distance.mass/energy measures achievable by human engineers or natural evolution. One reason for this is that this is a small set of examples. Another is that none of these animals or machines were optimized purely for either of these flight metrics—they all had other constraints or more complex goals. For instance, the [paramotor](https://aiimpacts.org/energy-efficiency-of-paramotors/) was competing for a record in which a paramotor had to be used, specifically. For the longest human flight, the flying machine had to be capable of carrying a human. The albatross’ body has many functions. Thus it seems plausible that either engineers or natural evolution could reach solutions far better on our metrics than those recorded here if they were directly aiming for those metrics. \n\n\nThe measurements for distance.mass/energy covered a much narrower band than those for distance/energy: a factor of under two orders of magnitude versus around eight. Comparing best scores between evolution and engineering, the gap is also much smaller, as noted above (a factor of less than one order of magnitude versus three orders of magnitude). This seems like some evidence that that band of performance is natural for some reason, and so that more pointed efforts to do better on these metrics would not readily lead to much higher performance.\n\n\n \n \n*Primary author: Ronny Fernandez*\n\n\nNotes\n-----\n\n", "url": "https://aiimpacts.org/are-human-engineered-flight-designs-better-or-worse-than-natural-ones/", "title": "How energy efficient are human-engineered flight designs relative to natural ones?", "source": "aiimpacts.org", "source_type": "wordpress", "date_published": "2020-12-10T22:48:00+00:00", "paged_url": "https://aiimpacts.org/feed?paged=4", "authors": ["Katja Grace"], "id": "816e02d537ad2ae42968891d9717a406", "summary": ["When forecasting AI timelines from <@biological anchors@>(@Draft report on AI timelines@), one important subquestion is how well we expect human-made artifacts to compare to natural artifacts (i.e. artifacts made by evolution). This post gathers empirical data for flight, by comparing the Monarch butterfly and the Wandering Albatross to various types of planes. The albatross is the most efficient, with a score of 2.2 kg-m per Joule (that is, a ~7 kg albatross spends ~3 Joules for every meter it travels). This is 2-8x better than the most efficient manmade plane that the authors considered, the Boeing 747-400, which in turn is better than the Monarch butterfly. (The authors also looked at distance per Joule without considering mass, in which case unsurprisingly the butterfly wins by miles; it is about 3 orders of magnitude better than the albatross, which is in turn better than all the manmade solutions.)"]}
{"text": "Energy efficiency of monarch butterfly flight\n\n*Updated Nov 25, 2020*\n\n\nAccording to very rough estimates, the monarch butterfly:\n\n\n* can fly around 100,000-600,000 m/kJ\n* and move mass at around 0.065-0.36 kg⋅m/J\n\n\nDetails\n-------\n\n\nThe **Monarch Butterfly** is a butterfly known for its migration across North America.[1](https://aiimpacts.org/energy-efficiency-of-monarch-butterfly-flight/#easy-footnote-bottom-1-2776 \"“The monarch butterfly, Danaus plexippus, is famous for its spectacular annual migration across
North America”
Zhan, Shuai, Wei Zhang, Kristjan Niitepõld, Jeremy Hsu, Juan Fernández Haeger, Myron P. Zalucki, Sonia Altizer, Jacobus C. de Roode, Steven M. Reppert, and Marcus R. Kronforst. “The Genetics of Monarch Butterfly Migration and Warning Colouration.” Nature 514, no. 7522 (October 2014): 317–21. https://doi.org/10.1038/nature13812.\")\n\n### Mass\n\n\nThe average mass of a monarch butterfly prior to its annual migration has been estimated to be 600mg[2](https://aiimpacts.org/energy-efficiency-of-monarch-butterfly-flight/#easy-footnote-bottom-2-2776 \"“Each year in late summer and fall in southern Ontario, monarch butterflies, Danaus plexippus plexippus L., engage in migratory flight to the southern U.S.A. and Mexico…
\n\n\n\n…Late summer monarchs average approximately 600mg.”
Gibo, David L., and Pallett, Megan J., “Soaring Flight of Monarch Butterflies, Danaus Plexippus (Lepidoptera: Danaidae), during the Late Summer Migration in Southern Ontario.” Canadian Journal of Zoology, July 1979. https://doi.org/10.1139/z79-180.\")\n### Distance per Joule\n\n\nThe following table gives some very rough estimates of energy expenditures, speeds and distances for several modes of flight, based on confusing information from a small number of papers (see footnotes for details).\n\n\n\n\n| | | | | | |\n| --- | --- | --- | --- | --- | --- |\n| Activity | Description | Energy expenditure per mass ( J/g⋅hr) | Energy expenditure for 600mg butterfly (J/s) | Speed (m/s) | distance/energy (m/J) |\n| Soaring/gliding | Unpowered flight, including gradual decline and ascent via air currents | 8-33[3](https://aiimpacts.org/energy-efficiency-of-monarch-butterfly-flight/#easy-footnote-bottom-3-2776 \"Gibo and Pallet (1979) appear to think energy expenditure of soaring is well approximated by energy expenditure for resting:
“The most efficient flying technique, in terms of
cost per unit of distance travelled, is soaring (Pennycuick 1969, 1975). During soaring flight, altitude
is gained or maintained by gliding in rising air currents. Since a soaring animal is actually gliding,
the wings are held more or less motionless and
the high-energy expenditure of powered flight is
avoided…
…if soaring requires approximately
the basal level of metabolic expenditure, an average D. piesippus with an initial fat supply of 140 mg,
which could fly under power for only I1 h, may be
able to soar for 1060 h.”
Gibo, David L., and Pallett, Megan J., “Soaring Flight of Monarch Butterflies, Danaus Plexippus (Lepidoptera: Danaidae), during the Late Summer Migration in Southern Ontario.” Canadian Journal of Zoology, July 1979. https://doi.org/10.1139/z79-180.
They say, “Flying Lepidoptera have a metabolic rate that is as
much as 100 times above the basal rate (Zebe 1954).”
Zhan et al 2014 measure metabolic rates for monarch butterflies specifically, but only report that the resting rate is 25x lower than a flying rate they prompted:
“…we tested it by measuring flight metabolic
rates. We found active flight to be exceptionally demanding energetically, utilizing 25 times
more energy than resting…”
Zhan, Shuai, Wei Zhang, Kristjan Niitepõld, Jeremy Hsu, Juan Fernández Haeger, Myron P. Zalucki, Sonia Altizer, Jacobus C. de Roode, Steven M. Reppert, and Marcus R. Kronforst. “The Genetics of Monarch Butterfly Migration and Warning Colouration.” Nature 514, no. 7522 (October 2014): 317–21. https://doi.org/10.1038/nature13812.
Also, their data makes very little sense to us. For instance, the figure suggests that flying is less energy intensive than resting. However it seems likely that this is a misunderstanding on our part, since for instance their y-axis in not labeled. Given this and the earlier claim that the difference between resting and flying can be 100x for butterflies, we use the relative number 25-100x, in combination with the flight and cruising energy estimates given below.
high estimate:
837/25 J/g⋅hr = 33 J/g⋅hr (see below for flying rate)
The lowest estimate would be the cruising speed energy expenditure divided by 100, but it seems like the 100 figure was meant as an upper bound on the difference, so probably referring to rest vs. maximal flight energy.
Thus we take the lowest of the other combinations, as low end estimate:
min(209/25, 837/100) = min(8.4, 8.4) = 8.4 J/g⋅hr\") | ~0.0014 – 0.0056[4](https://aiimpacts.org/energy-efficiency-of-monarch-butterfly-flight/#easy-footnote-bottom-4-2776 \"8-33 J/g⋅hr * 0.6g= ~5-20 J/hr = 0.0014 – 0.0056 J/s\") | Very roughly 2.5-3.6 on average[5](https://aiimpacts.org/energy-efficiency-of-monarch-butterfly-flight/#easy-footnote-bottom-5-2776 \"Gibo & Pallett (1979) assume this in estimating flight range possible via soaring:
“Consequently, if soaring requires approximately
the basal level of metabolic expenditure, an average D. piesippus with an initial fat supply of 140 mg,
which could fly under power for only I1 h, may be
able to soar for 1060 h. For gliding speeds ranging
from approximately 9 to 13 km/hr, the theoretical
maximum range, without pauses for feeding, would
fall between 9500 and 13 800 km.”
Gibo, David L., and Pallett, Megan J., “Soaring Flight of Monarch Butterflies, Danaus Plexippus (Lepidoptera: Danaidae), during the Late Summer Migration in Southern Ontario.” Canadian Journal of Zoology, July 1979. https://doi.org/10.1139/z79-180.
9-13km/hr = 2.5-3.6 m/s\") | 446- 2571[6](https://aiimpacts.org/energy-efficiency-of-monarch-butterfly-flight/#easy-footnote-bottom-6-2776 \"2.5/.0056 = 446
3.6/.0014 = 2571
These numbers sound surprisingly high, but they are at least in line with Gibo & Pallett’s estimate for maximal distance possibly flown with the 140mg of fat in a butterfly, if it could soar for the entire time:
“Consequently, if soaring requires approximately
the basal level of metabolic expenditure, an average D. piesippus with an initial fat supply of 140 mg,
which could fly under power for only 11 h, may be
able to soar for 1060 h. For gliding speeds ranging
from approximately 9 to 13 km/hr, the theoretical
maximum range, without pauses for feeding, would
fall between 9500 and 13 800 km.”
Gibo, David L., and Pallett, Megan J., “Soaring Flight of Monarch Butterflies, Danaus Plexippus (Lepidoptera: Danaidae), during the Late Summer Migration in Southern Ontario.” Canadian Journal of Zoology, July 1979. https://doi.org/10.1139/z79-180.
Our understanding is that this much soaring without the need for powered flight is implausible, but this efficiency figure should still be approximately correct for shorter distances where soaring is feasible.\") |\n| Cruising | Low speed powered flight | Very roughly 209[7](https://aiimpacts.org/energy-efficiency-of-monarch-butterfly-flight/#easy-footnote-bottom-7-2776 \"Gibo and Pallett estimate cruising flight to be about one fourth as costly as sustained flapping flight:
“Since profile drag is proportional to the square of the speed, doubling the speed increases the profile drag by four (Irving 1977). Consequently, it seems reasonable to assume that the slower, less energetic cruising flight of D. plexippus requires approximately 25% of the energy expenditure of vigorous flight.”
Gibo, David L., and Pallett, Megan J., “Soaring Flight of Monarch Butterflies, Danaus Plexippus (Lepidoptera: Danaidae), during the Late Summer Migration in Southern Ontario.” Canadian Journal of Zoology, July 1979. https://doi.org/10.1139/z79-180.
Given an estimate of 837 J/g⋅hr for sustained flapping flight (see below), this gives us 209 J/g⋅hr for cruising.\") | 0.035[8](https://aiimpacts.org/energy-efficiency-of-monarch-butterfly-flight/#easy-footnote-bottom-8-2776 \"209 J/g⋅hr * 0.6g = 125J/hr = 0.035 J/s\") | Maximum: >5[9](https://aiimpacts.org/energy-efficiency-of-monarch-butterfly-flight/#easy-footnote-bottom-9-2776 \"“However, during migration D.
plexippus adults usually adopt a slower cruising
flight at an airspeed of 18 km/hr (Urquhart 1960), a
flying strategy that should result in less fuel being
consumed as a result of reduced drag at lower
airspeeds.”
Gibo, David L., and Pallett, Megan J., “Soaring Flight of Monarch Butterflies, Danaus Plexippus (Lepidoptera: Danaidae), during the Late Summer Migration in Southern Ontario.” Canadian Journal of Zoology, July 1979. https://doi.org/10.1139/z79-180.\") | Maximum: >143[10](https://aiimpacts.org/energy-efficiency-of-monarch-butterfly-flight/#easy-footnote-bottom-10-2776 \">5/0.035 = 143\") |\n| Sustained flapping | High speed powered flight | Very roughly 837[11](https://aiimpacts.org/energy-efficiency-of-monarch-butterfly-flight/#easy-footnote-bottom-11-2776 \"We were not able to find the flight metabolic rate of monarch butterflies. Instead we use the flight metabolic rate of 200 calories per gram per hour (837 J/g⋅hr) that was measured as a minimum for another butterfly species during energetic flight, as Gibo and Pallet (1979) seem to think is somewhat reasonable, in their paper on soaring flight of monarch butterflies:
“If we assume that the metabolic rate of D. plexippus during sustained flapping flight is only 200 cal/g h^-1, the minimal value determined by Zebe (1954) for another butterfly (Vanessa sp.)…”
Gibo, David L., and Pallett, Megan J., “Soaring Flight of Monarch Butterflies, Danaus Plexippus (Lepidoptera: Danaidae), during the Late Summer Migration in Southern Ontario.” Canadian Journal of Zoology, July 1979. https://doi.org/10.1139/z79-180.\") | ~0.14[12](https://aiimpacts.org/energy-efficiency-of-monarch-butterfly-flight/#easy-footnote-bottom-12-2776 \"837 J/g⋅hr * 0.6g = 502 J/hr = 0.14 J/s\") | Maximum: >13.9[13](https://aiimpacts.org/energy-efficiency-of-monarch-butterfly-flight/#easy-footnote-bottom-13-2776 \"Maximal observed in one study:
“On some days, the butterflies were achieving estimated ground speeds of more than 50 km/hr.”
Gibo, David L., and Pallett, Megan J., “Soaring Flight of Monarch Butterflies, Danaus Plexippus (Lepidoptera: Danaidae), during the Late Summer Migration in Southern Ontario.” Canadian Journal of Zoology, July 1979. https://doi.org/10.1139/z79-180.
Also, airspeed during sustained flapping is around 40km/hr, and it seems unlikely that the motion of air can’t add a further 10km/hr to ground speed:
“In D. plexippus vigorous flight of this type produces an airspeed
of approximately 40 kmlh (Urquhart 1960).”
Gibo, David L., and Pallett, Megan J., “Soaring Flight of Monarch Butterflies, Danaus Plexippus (Lepidoptera: Danaidae), during the Late Summer Migration in Southern Ontario.” Canadian Journal of Zoology, July 1979. https://doi.org/10.1139/z79-180.
\") | Maximum: >99[14](https://aiimpacts.org/energy-efficiency-of-monarch-butterfly-flight/#easy-footnote-bottom-14-2776 \">13.9/0.14 = 99\") |\n\n**Table 1: Statistics for several modes of flight. All figures are very rough estimates, based on incomplete and confusing information from a small number of papers (see footnotes for details).**\n \nSoaring is estimated to be potentially very energy efficient (see Table 1), since it mostly makes use of air currents for energy. It seems likely that at least a small amount of powered flight is needed for getting into the air, however monarch butterflies can apparently fly for hundreds of kilometers in a day[15](https://aiimpacts.org/energy-efficiency-of-monarch-butterfly-flight/#easy-footnote-bottom-15-2776 \"“The farthest ranging monarch butterfly recorded traveled 265 miles in one day.” [265 miles = 426km]
“Monarch Butterfly Migration and Overwintering.” Accessed November 25, 2020. https://www.fs.fed.us/wildflowers/pollinators/Monarch_Butterfly/migration/index.shtml.\"), so supposing that they don’t stop many times in a day, taking off seems likely a negligible part of the flight.[16](https://aiimpacts.org/energy-efficiency-of-monarch-butterfly-flight/#easy-footnote-bottom-16-2776 \"For instance, if it pessimistically takes 100 meters of powered flight to take off, then it would be .02% of the distance, so if it was 25x as much energy as usual for that distance, it would add .5% to the total energy use, which is far within the margin of error for this very rough calculation.\")\nThis would require ideal wind conditions, and our impression is that in practice, butterflies do not often fly very long distances without using at least a small amount of powered flight.[17](https://aiimpacts.org/energy-efficiency-of-monarch-butterfly-flight/#easy-footnote-bottom-17-2776 \"For instance, in this video of soaring butterflies, most of them appear to flap their wings occasionally: https://www.youtube.com/watch?v=a-8SPgG–6I
Usa Monarch. Soaring MONARCH BUTTERFLIES at Their Mexico Migration Site, 2019. https://www.youtube.com/watch?v=a-8SPgG–6I.\")\nThere is stronger evidence that monarch butterflies can realistically soar around 85% of the time, from Gibo & Pallett, who report their observations of butterflies under relatively good conditions.[18](https://aiimpacts.org/energy-efficiency-of-monarch-butterfly-flight/#easy-footnote-bottom-18-2776 \"“A description of the thermal soaring activity observed on September 7, a particularly favourable day, provides a clear picture of the relative importance of this type of flight. On this day we recorded the greatest proportion of soaring flights for any single day of observation.
\n\n\n\nSoaring accounted for 1964 s or 83.5% of this time, and powered flight for 359 s or 15.3%.”
\n\n\n\nGibo, David L., and Pallett, Megan J., “Soaring Flight of Monarch Butterflies, Danaus Plexippus (Lepidoptera: Danaidae), during the Late Summer Migration in Southern Ontario.” Canadian Journal of Zoology, July 1979. https://doi.org/10.1139/z79-180.\") So as a high estimate, we use this fraction of the time for soaring, and suppose that the remaining time is the relatively energy-efficient cruising, and take the optimistic end of all ranges. This gives us:\n\n\nOne second of flight = 0.15 seconds cruising + 0.85 seconds soaring\n\n\n\\_\\_\\_\\_\\_\\_\\_\\_\\_\\_\\_\\_\\_\\_\\_\\_= 0.15s \\* 5 m/s cruising + 0.85s \\* 3.6m/s soaring\n\n\n\\_\\_\\_\\_\\_\\_\\_\\_\\_\\_\\_\\_\\_\\_\\_\\_= 0.75m cruising + 3.06m soaring \n\n\n\\_\\_\\_\\_\\_\\_\\_\\_\\_\\_\\_\\_\\_\\_\\_\\_= 3.81m total\n\n\nThis also gives us:\n\n\n= 0.75m / 143 m/J cruising + 3.06m / 2571 m/J soaring \n\n\n= 0.0064 J total\n\n\nThus we have:\n\n\ndistance/energy = 3.81m/0.0064 J = 595 m/J\n\n\nFor a low estimate of efficiency, we will assume that all of the powered flight is the most energetic flight, that powered flight is required half the time on average, and that the energy cost of gliding is twice that of resting. This gives us:\n\n\nEnergy efficiency = (50% \\* soaring distance + 50% \\* powered distance) / (50% \\* soaring energy + 50% \\* powered energy)\n\n\n= (50% \\* soaring distance/time + 50% \\* powered distance/time) / (50% \\* soaring energy/time + 50% \\* powered energy/time)\n\n\n= (0.5 \\* 2.5m/s + 0.5 \\* 13.9m/s) / (0.5 \\* (0.0056 \\* 2) J/s + 0.5 \\* 0.14 J/s)\n\n\n= 108 m/J\n\n\nThus we have, very roughly:\n\n\ndistance/energy = 100,000-600,000 m/kJ\n\n\nFor concreteness, a kJ is the energy in around a quarter of a raspberry. [19](https://aiimpacts.org/energy-efficiency-of-monarch-butterfly-flight/#easy-footnote-bottom-19-2776 \"“FoodData Central.” Accessed December 10, 2020. https://fdc.nal.usda.gov/fdc-app.html#/food-details/167755/nutrients.\")\n### Mass⋅distance per Joule\n\n\nAs noted earlier, the average mass of a monarch butterfly prior to its annual migration has been estimated to be 600mg[20](https://aiimpacts.org/energy-efficiency-of-monarch-butterfly-flight/#easy-footnote-bottom-20-2776 \"“Each year in late summer and fall in southern Ontario, monarch butterflies, Danaus plexippus plexippus L., engage in migratory flight to the southern U.S.A. and Mexico…
\n\n\n\n…Late summer monarchs average approximately 600mg.”
Gibo, David L., and Pallett, Megan J., “Soaring Flight of Monarch Butterflies, Danaus Plexippus (Lepidoptera: Danaidae), during the Late Summer Migration in Southern Ontario.” Canadian Journal of Zoology, July 1979. https://doi.org/10.1139/z79-180.\")\nThus we have:\n\n\nmass\\*distance/energy = 0.0006 kg \\* 108 — 0.0006 kg \\* 595 m/J\n\n\n= 0.065 — 0.36 kg⋅m/J \n \n \n\n\n\n\n*Primary author: Ronny Fernandez*\n\n\nNotes\n-----\n\n\n\n\n\n\n\n\n\n\n\n\n\n", "url": "https://aiimpacts.org/energy-efficiency-of-monarch-butterfly-flight/", "title": "Energy efficiency of monarch butterfly flight", "source": "aiimpacts.org", "source_type": "wordpress", "date_published": "2020-11-26T06:30:47+00:00", "paged_url": "https://aiimpacts.org/feed?paged=5", "authors": ["Katja Grace"], "id": "6788ab7ecbdd59b5a07916d63d340051", "summary": []}
{"text": "Energy efficiency of wandering albatross flight\n\n*Updated Nov 25, 2020*\n\n\nThe wandering albatross:\n\n\n* can fly around 240m/kJ\n* and move mass at around 1.4—3.0kg.m/J\n\n\nDetails\n-------\n\n\nThe wandering albatross is a very large seabird that flies long distances on wings with the largest span of any bird.[1](https://aiimpacts.org/energy-efficiency-of-wandering-albatross-flight/#easy-footnote-bottom-1-2772 \"“The wandering albatross, snowy albatross, white-winged albatross or goonie[3] (Diomedea exulans) is a large seabird from the family Diomedeidae, which has a circumpolar range in the Southern Ocean…It is one of the largest, best known, and most studied species of bird in the world, with it possessing the greatest known wingspan of any living bird. …Some individual wandering albatrosses are known to circumnavigate the Southern Ocean three times, covering more than 120,000 km (75,000 mi), in one year”
“Wandering Albatross.” In Wikipedia, October 27, 2020. https://en.wikipedia.org/w/index.php?title=Wandering_albatross&oldid=985673754.\") \n\n\n### Distance per Joule\n\n\n#### Speed\n\n\nIn a study of wandering albatrosses flying in various wind speeds and directions, average ground speed was 12 m/s, though the fastest ground speed measured appears to be around 24m/s, [2](https://aiimpacts.org/energy-efficiency-of-wandering-albatross-flight/#easy-footnote-bottom-2-2772 \"“The average ground speed is 12.0 (± 0.1) m/s.”
\n\n\n\nSee Figure 3 for all ground speed measurements. Though also,
“Notably, due to the combination of fast airspeeds and leeway the fastest ground speeds (~ 22 m/s) tend to be located in the diagonal downwind direction.
Richardson, Philip L., Ewan D. Wakefield, and Richard A. Phillips. “Flight Speed and Performance of the Wandering Albatross with Respect to Wind.” Movement Ecology 6, no. 1 (March 7, 2018): 3. https://doi.org/10.1186/s40462-018-0121-9.\") We use average ground speed for this estimate because we only have data on average energy expenditure, though it is likely that higher ground speeds involve more energy efficient flight, since albatross flight speed is dependent on wind and it appears that higher speeds are substantially due to favorable winds.[3](https://aiimpacts.org/energy-efficiency-of-wandering-albatross-flight/#easy-footnote-bottom-3-2772 \"“Notably, due to the combination of fast airspeeds and leeway the fastest ground speeds (~ 22 m/s) tend to be located in the diagonal downwind direction.”
\n\n\n\nRichardson, Philip L., Ewan D. Wakefield, and Richard A. Phillips. “Flight Speed and Performance of the Wandering Albatross with Respect to Wind.” Movement Ecology 6, no. 1 (March 7, 2018): 3. https://doi.org/10.1186/s40462-018-0121-9.\")\n#### Energy expenditure\n\n\nOne study produced an estimate that when flying, albatrosses use 2.35 times their basal metabolic rate[4](https://aiimpacts.org/energy-efficiency-of-wandering-albatross-flight/#easy-footnote-bottom-4-2772 \"“Energy cost of flight was estimated to be 2.35 times measured BMR.”
\n\n\n\nAdams, N. J., C. R. Brown, and K. A. Nagy. “Energy Expenditure of Free-Ranging Wandering Albatrosses Diomedea Exulans.” Physiological Zoology 59, no. 6 (November 1, 1986): 583–91. https://doi.org/10.1086/physzool.59.6.30158606.\") which same paper implies is around 1,833 kJ/bird.day.[5](https://aiimpacts.org/energy-efficiency-of-wandering-albatross-flight/#easy-footnote-bottom-5-2772 \"“This is equivalent to an overall energy expenditure of 3,354 kJ bird⁻¹ day⁻¹ or 1.83 times measured basal metabolic rate (BMR).”
\n\n\n\nAdams, N. J., C. R. Brown, and K. A. Nagy. “Energy Expenditure of Free-Ranging Wandering Albatrosses Diomedea Exulans.” Physiological Zoology 59, no. 6 (November 1, 1986): 583–91. https://doi.org/10.1086/physzool.59.6.30158606.
\n\n\n\nFrom this we infer that the basal metabolic rate is 1,833 kJ/ bird.day.\") \n\n\nThat gives us a flight cost for flying of 0.050 kJ/second.[6](https://aiimpacts.org/energy-efficiency-of-wandering-albatross-flight/#easy-footnote-bottom-6-2772 \"2.35 * 3,354 kJ/1.83 * 1/86400 seconds/day\") \n\n\n#### Distance per Joule calculation\n\n\nThis gives us a distance per energy score of:\n\n\ndistance/energy\n\n\n= 12 m/s / 0.050 kJ/s \n\n\n= 240m/kJ\n\n\n### Mass.distance per Joule\n\n\nAlbatrosses weigh 5.9 to 12.7 kg.[7](https://aiimpacts.org/energy-efficiency-of-wandering-albatross-flight/#easy-footnote-bottom-7-2772 \"“Adults can weigh from 5.9 to 12.7 kg (13 to 28 lb)”
\n\n\n\n“Wandering Albatross.” In Wikipedia, October 27, 2020. https://en.wikipedia.org/w/index.php?title=Wandering_albatross&oldid=985673754.\")\nThus we can estimate:\n\n\nmass.distance/Joule\n\n\n= 5.9kg \\* 240 m/kJ to 12.7kg\\*240 m/kJ\n\n\n= 1.4—3.0kg.m/J\n\n\n \n \n*Primary author: Ronny Fernandez*\n\n\nNotes\n-----\n\n\n\n\n\n", "url": "https://aiimpacts.org/energy-efficiency-of-wandering-albatross-flight/", "title": "Energy efficiency of wandering albatross flight", "source": "aiimpacts.org", "source_type": "wordpress", "date_published": "2020-11-25T00:13:13+00:00", "paged_url": "https://aiimpacts.org/feed?paged=5", "authors": ["Katja Grace"], "id": "10b2c0fe4644c6aa0568f72498088b50", "summary": []} {"text": "Energy efficiency of paramotors\n\n*Updated Nov 24, 2020*\n\n\nWe estimate that a record-breaking two-person paramotor:\n\n\n* covered around = 0.36 m/kJ\n* and moved mass at around 0.058 – 0.10 kg⋅m/J\n\n\nDetails\n-------\n\n\nParamotors are powered parachutes that allow the operator to steer.[1](https://aiimpacts.org/energy-efficiency-of-paramotors/#easy-footnote-bottom-1-2765 \"“Powered paragliding, also known as paramotoring or PPG, is a form of ultralight aviation where the pilot wears a back-mounted motor (a paramotor) which provides enough thrust to take off using a paraglider. It can be launched in still air, and on level ground, by the pilot alone — no assistance is required….Powered paragliders are smaller, use more efficient (but more difficult to manage) paraglider wings, and steer with brake toggles like sport parachutists.”
\n\n\n\n“Powered Paragliding.” In Wikipedia, October 31, 2020. https://en.wikipedia.org/w/index.php?title=Powered_paragliding&oldid=986450866.\")\n### Distance per Joule\n\n\nThe Fédération Aéronautique Internationale (FAI) maintains records for a number of classes of paramotor contest. We look at subclass RPF2T—(Paramotors : Paraglider Control / Foot-launched / Flown with two persons / Thermal Engine)—which is appears to be the most recent paramotor record for ‘Distance in a straight line with limited fuel’.[2](https://aiimpacts.org/energy-efficiency-of-paramotors/#easy-footnote-bottom-2-2765 \"Recent paramotor records for distance in a straight line with limited fuel:
\n\n\n\n“Records | World Air Sports Federation.” Accessed November 18, 2020. https://www.fai.org/records?f%5B0%5D=field_record_sport%3A2025&f%5B1%5D=field_type_of_record%3A488&record=&order=field_date_single_custom&sort=desc.
\n\n\n\nDetails of Mark Morgan’s 2013 record:
\n\n\n\n“Mark Morgan (GBR) (16956),” October 10, 2017. https://www.fai.org/record/16956.\")\nThe record distance was 123.18 km.[3](https://aiimpacts.org/energy-efficiency-of-paramotors/#easy-footnote-bottom-3-2765 \"“Mark Morgan (GBR) (16956),” October 10, 2017. https://www.fai.org/record/16956.\") The FAI rules state that no more than 7.5 kg of fuel may be used.[4](https://aiimpacts.org/energy-efficiency-of-paramotors/#easy-footnote-bottom-4-2765 \"“Special rules for distance in a straight line with limited fuel…
\n\n\n\nThe aircraft must carry no more than 7.5 kg of fuel which may be used as required.”
\n\n\n\nFAI. “FAI Sporting Code: Section 10 – Microlights and Paramotors,” 2017.\") We will assume that in the process of breaking this record, all of the available fuel was used. We will also assume that regular gasoline was used. Gasoline has an energy density of 45 MJ/kg.[5](https://aiimpacts.org/energy-efficiency-of-paramotors/#easy-footnote-bottom-5-2765 \"“Energy Density of Gasoline – The Physics Factbook.” Accessed November 18, 2020. https://hypertextbook.com/facts/2003/ArthurGolnik.shtml.\")\nDistance per energy = 123.18 km / (7.5 kg \\* 45 MJ/kg) \n\n\n= 0.36 m/kJ\n\n\n### Mass.distance per Joule\n\n\nThe weight of an entire paramotoring apparatus appears to be the weights of the passengers plus motor plus wing plus clothing and incidentals, based on forum posts.[6](https://aiimpacts.org/energy-efficiency-of-paramotors/#easy-footnote-bottom-6-2765 \"“You are 102kg, the motor is probably 25kg, wing weight say 5kg, clothing and incidentals about 8kg. So you total is 140kg.”
\n\n\n\nwww.Paramotorclub.org. “Is This Wing for Me.” Accessed November 24, 2020. https://www.paramotorclub.org/topic/13451-is-this-wing-for-me/.
\n\n\n\n“Wife at 59kg, plus a 20kg motor (light) plus clothing and instruments say 7kg plus weight of wing (should be included) 5.6kg, that equals 91.6kg.”
\n\n\n\nwww.Paramotorclub.org. “Roadster 3 Weight/Sizing Question.” Accessed November 24, 2020. https://www.paramotorclub.org/topic/12973-roadster-3-weightsizing-question/.\") These posts put clothing and incidentals at around 8kg, but are estimates for single person flying, whereas this record was a two person flight. We guess that two people need around 1.5x as much additional weight, for 12kg.\n\n\nWikipedia says that the weight of a paramotor varies from 18kg to 34 kg.[7](https://aiimpacts.org/energy-efficiency-of-paramotors/#easy-footnote-bottom-7-2765 \"“A typical paramotor will weigh on average around 50 lbs. (23 kg) with some models as light at 40 lbs. (18 kg) and some models as high as 75 lbs. (34 kg.)”
\n\n\n\n“Paramotor.” In Wikipedia, October 1, 2020. https://en.wikipedia.org/w/index.php?title=Paramotor&oldid=981354167.\") However it is unclear whether this means the motor itself, or all of the equipment involved. \n\n\nThe glider used appears to be MagMax brand, a typical example of which weighs around 8kg, though this may have been different in 2013, or they may have used a different specific glider.[8](https://aiimpacts.org/energy-efficiency-of-paramotors/#easy-footnote-bottom-8-2765 \"“Aircraft Mag Max”
\n\n\n\n“Mark Morgan (GBR) (16956),” October 10, 2017. https://www.fai.org/record/16956.
\n\n\n\n“Glider Weight (kg) 8 8.4”
\n\n\n\nOzone Paramotor. “MagMax.” Accessed November 18, 2020. https://www.flyozone.com/paramotor/products/gliders/magmax.\") To account for this uncertainty, we shall add the glider weight to the high estimate, and so estimate the weight of the glider and motor together at 18-42kg.\n\n\nWe will assume that the apparently male pilots weighed between 65 and 115 kgs each, based on normal male weights[9](https://aiimpacts.org/energy-efficiency-of-paramotors/#easy-footnote-bottom-9-2765 \"Pilots appear to be male in this picture: https://www.fai.org/sites/default/files/record/recs-documents/16956-2_0.jpg
\n\n\n\n
10th to 90th percentile male weights, from:
\n\n\n\nDQYDJ – Don’t Quit Your Day Job… “Weight Percentile Calculator for Men and Women in the United States,” February 13, 2019. https://dqydj.com/weight-percentile-calculator-men-women/.\"). \n\n\nThus we have:\n\n\nweight = motor + wing + people + clothing and incidentals\n\n\nweight (low estimate) = 18 + 65\\*2 + 12 = 160kg\n\n\nweight (high estimate) = 42 + 115\\*2 + 12 = 284kg\n\n\nHigh efficiency estimate:\n\n\n284kg \\* 0.36 m/kJ = 0.10 kg⋅m/J \n\n\nLow efficiency estimate:\n\n\n160kg \\* 0.36 m/kJ = .058 kg⋅m/J\n\n\nThis gives us a range of 0.058 – 0.10 kg⋅m/J\n\n\n \n \n \n*Primary author: Ronny Fernandez*\n\n\nNotes\n-----\n\n\n\n\n\n\n\n", "url": "https://aiimpacts.org/energy-efficiency-of-paramotors/", "title": "Energy efficiency of paramotors", "source": "aiimpacts.org", "source_type": "wordpress", "date_published": "2020-11-24T21:11:22+00:00", "paged_url": "https://aiimpacts.org/feed?paged=5", "authors": ["Katja Grace"], "id": "a3decd48e10845a40365256c25c9a0e1", "summary": []} {"text": "Misalignment and misuse: whose values are manifest?\n\n*By Katja Grace, 18 November 2020, Crossposted from [world spirit sock puppet](https://worldspiritsockpuppet.com/).*\n\n\nAI related disasters are often categorized as involving misaligned AI, or misuse, or accident. Where:\n\n\n* misuse means the bad outcomes were wanted by the people involved,\n* misalignment means the bad outcomes were wanted by AI (and not by its human creators), and\n* accident means that the bad outcomes were not wanted by those in power but happened anyway due to error.\n\n\nIn thinking about specific scenarios, these concepts seem less helpful.\n\n\nI think a likely scenario leading to bad outcomes is that AI can be made which gives a set of people things they want, at the expense of future or distant resources that the relevant people do not care about or do not own.\n\n\nFor example, consider autonomous business strategizing AI systems that are profitable additions to many companies, but in the long run accrue resources and influence and really just want certain businesses to nominally succeed, resulting in a worthless future. Suppose Bob is considering whether to get a business strategizing AI for his business. It will make the difference between his business thriving and struggling, which will change his life. He suspects that within several hundred years, if this sort of thing continues, the AI systems will control everything. Bob probably doesn’t hesitate, in the way that businesses don’t hesitate to use gas vehicles even if the people involved genuinely think that climate change will be a massive catastrophe in hundreds of years.\n\n\nWhen the business strategizing AI systems finally plough all of the resources in the universe into a host of thriving 21st Century businesses, was this misuse or misalignment or accident? The strange new values that were satisfied were those of the AI systems, but the entire outcome only happened because people like Bob chose it knowingly (let’s say). Bob liked it more than the long glorious human future where his business was less good. That sounds like misuse. Yet also in a system of many people, letting this decision fall to Bob may well have been an accident on the part of others, such as the technology’s makers or legislators.\n\n\nOutcomes are the result of the interplay of choices, driven by different values. Thus it isn’t necessarily sensical to think of them as flowing from one entity’s values or another’s. Here, AI technology created a better option for both Bob and some newly-minted misaligned AI values that it also created—‘Bob has a great business, AI gets the future’—and that option was worse for the rest of the world. They chose it together, and the choice needed both Bob to be a misuser and the AI to be misaligned. But this isn’t a weird corner case, this is a natural way for the future to be destroyed in an economy.\n\n\n*Thanks to Joe Carlsmith for conversation leading to this post.*\n\n", "url": "https://aiimpacts.org/misalignment-and-misuse-whose-values-are-manifest/", "title": "Misalignment and misuse: whose values are manifest?", "source": "aiimpacts.org", "source_type": "wordpress", "date_published": "2020-11-19T00:06:34+00:00", "paged_url": "https://aiimpacts.org/feed?paged=5", "authors": ["Katja Grace"], "id": "52eabb0877f4b48fec3322e8536f6aeb", "summary": []} {"text": "Energy efficiency of The Spirit of Butt’s Farm\n\n*Updated Nov 18, 2020*\n\n\nThe Spirit of Butt’s Farm:\n\n\n* covered around 31.67 m/kJ\n* and moved mass at around 0.16 – 0.086 kg⋅m/J\n\n\nDetails\n-------\n\n\nThe Spirit of Butt’s Farm was a record setting model airplane that crossed the Atlantic on one gallon of fuel.[1](https://aiimpacts.org/energy-efficiency-of-the-spirit-of-butts-farm/#easy-footnote-bottom-1-2759 \"“The Spirit of Butts’ Farm (also known as TAM 5) was the first model aircraft to cross the Atlantic Ocean on August 11, 2003…Fuel tank: Approx. 118 US fluid ounces (3.5 l)” [118 US fluid ounces = 0.92 US liquid gallons according to Google]\n\n\n\n
“The Spirit of Butts’ Farm.” In Wikipedia, September 29, 2019. https://en.wikipedia.org/w/index.php?title=The_Spirit_of_Butts%27_Farm&oldid=918639855.\") Fully fueled it weighed 4.987 kg, dry it weighed 2.705 kg.[2](https://aiimpacts.org/energy-efficiency-of-the-spirit-of-butts-farm/#easy-footnote-bottom-2-2759 \"From Wikipedia:
\n\n\n\n| Weight: | Dry: 5.96 lb (2.705 kg); Fully fueled: 10.99 lb (4.987 kg)[11] |
“The Spirit of Butts’ Farm.” In Wikipedia, September 29, 2019. https://en.wikipedia.org/w/index.php?title=The_Spirit_of_Butts%27_Farm&oldid=918639855.\")\n The record setting flight used 117.1 fluid ounces of fuel.[3](https://aiimpacts.org/energy-efficiency-of-the-spirit-of-butts-farm/#easy-footnote-bottom-3-2759 \"“The flight used 99.2% of its fuel…Fuel tank: Approx. 118 US fluid ounces (3.5 l)”
“The Spirit of Butts’ Farm.” In Wikipedia, September 29, 2019. https://en.wikipedia.org/w/index.php?title=The_Spirit_of_Butts%27_Farm&oldid=918639855.
Multiplying these values we find that the vehicle crossed the Atlantic using 99.2%*118 = 117.1 fluid ounces\") The straight line distance of the flight was 3,028.1 km.[4](https://aiimpacts.org/energy-efficiency-of-the-spirit-of-butts-farm/#easy-footnote-bottom-4-2759 \"“It was recognized by the FAI as a double world record[2] flight for its duration of 38h 52 min 19 sec[3] and straight-line distance of 1,881.6 mi (3,028.1 km) using an autopilot,[4]…”
“The Spirit of Butts’ Farm.” In Wikipedia, September 29, 2019. https://en.wikipedia.org/w/index.php?title=The_Spirit_of_Butts%27_Farm&oldid=918639855.\") It was powered by 88% Coleman lantern fuel, mixed with lubricant.[5](https://aiimpacts.org/energy-efficiency-of-the-spirit-of-butts-farm/#easy-footnote-bottom-5-2759 \"From Wikipedia:
\n\n\n\n| Fuel: | Coleman lantern fuel with 16 US fl oz (470 ml) of Indopol L-50 lubricant additive per 1 US gal (3,785 ml). Single fuel tank in the fuselage at the CG point [12] (normal: alcohol) |
“The Spirit of Butts’ Farm.” In Wikipedia, September 29, 2019. https://en.wikipedia.org/w/index.php?title=The_Spirit_of_Butts%27_Farm&oldid=918639855.\") Coleman fuel is based on naphtha [6](https://aiimpacts.org/energy-efficiency-of-the-spirit-of-butts-farm/#easy-footnote-bottom-6-2759 \"“…Coleman Camp Fuel, which is a common naphtha-based fuel used in many lanterns and stoves”
\n\n\n\n“Coleman Fuel.” In Wikipedia, August 22, 2019. https://en.wikipedia.org/w/index.php?title=Coleman_fuel&oldid=911926038.\"), so we can use the energy density of naphtha—31.4 MJ/L[7](https://aiimpacts.org/energy-efficiency-of-the-spirit-of-butts-farm/#easy-footnote-bottom-7-2759 \"“
\n\n\n\n| Liquid Fuel | MJ / liter |
…
\n\n\n\n| Naphtha | 31.4 |
“List of Common Conversion Factors (Engineering Conversion Factors) – IOR Energy Pty Ltd.” Accessed November 17, 2020. http://w.astro.berkeley.edu/~wright/fuel_energy.html.\")—as a rough guide to its energy content, though naphtha appears to vary in its content, and it is unclear whether Coleman fuel consists entirely of naphtha. \n\n\nFrom all this, we have:\n\n\nDistance per energy = 3,028.1 km / (117.1 fl oz \\* 0.88 \\* 31.4 MJ/L) \n\n\n= 31.67 m/kJ\n\n\nFor weight times distance per energy we will calculate a best and a worst score. To calculate the best score we will use the fully fueled weight, and to calculate the worst score we will use the dry weight. All other values are the same in both calculations. \n\n\nBest score: \n \nDistance\\*mass/energy = 4.987 kg \\* 31.67 m/kJ\n\n\n= 0.16 kg⋅m/J\n\n\n(4.987 kg \\* 3,028.1km) / (117.1 US fluid ounces \\* 31.4MJ/litre) = 0.1389 kg\\*m/j\n\n\nWorst score:\n\n\nDistance\\*mass/energy = 2.705 kg \\* 31.67 m/kJ\n\n\n= .086 kg⋅m/J\n\n\n \n \n*Primary author: Ronny Fernandez*\n\n\nNotes\n-----\n\n\n[Photo](https://commons.wikimedia.org/wiki/File:Tam5.jpg) by Ronan Coyne, licensed under the [Creative Commons](https://en.wikipedia.org/wiki/en:Creative_Commons) [Attribution-Share Alike 3.0 Unported](https://creativecommons.org/licenses/by-sa/3.0/deed.en) license, unaltered.\n\n\n\n\n", "url": "https://aiimpacts.org/energy-efficiency-of-the-spirit-of-butts-farm/", "title": "Energy efficiency of The Spirit of Butt’s Farm", "source": "aiimpacts.org", "source_type": "wordpress", "date_published": "2020-11-18T23:53:25+00:00", "paged_url": "https://aiimpacts.org/feed?paged=5", "authors": ["Katja Grace"], "id": "915253a573e26b9e206f72f5d24fb6aa", "summary": []} {"text": "Was the industrial revolution a drastic departure from historic trends?\n\n*Updated Nov 18, 2020*\n\n\nWe do not have a considered view on this topic.\n\n\nDetails\n-------\n\n\nWe have not investigated this topic. This is an incomplete list of evidence that we know of:\n\n\n* David Roodman’s analysis of the surprisingness of the industrial revolution under his 2020 model of economic history.[1](https://aiimpacts.org/was-the-industrial-revolution-a-drastic-departure-from-historic-trends/#easy-footnote-bottom-1-2760 \"Open Philanthropy. “Modeling the Human Trajectory,” June 15, 2020. https://www.openphilanthropy.org/blog/modeling-human-trajectory.\")\n* Ben Garfinkel’s analysis of whether economic history suggests a singularity[2](https://aiimpacts.org/was-the-industrial-revolution-a-drastic-departure-from-historic-trends/#easy-footnote-bottom-2-2760 \"“Does Economic History Point Toward a Singularity? – EA Forum.” Accessed November 17, 2020. https://forum.effectivealtruism.org/posts/CWFn9qAKsRibpCGq8/does-economic-history-point-toward-a-singularity.\")\n* Robin Hanson’s analysis of historic economic growth understood as a sequence of exponential modes.[3](https://aiimpacts.org/was-the-industrial-revolution-a-drastic-departure-from-historic-trends/#easy-footnote-bottom-3-2760 \"Hanson, Robin. “Long-Term Growth As A Sequence of Exponential Modes,” 2000, 24.\")\n* On a [log(GWP)-log(doubling time) graph](https://aiimpacts.org/historical-growth-trends/), the industrial revolution appears to be almost perfectly on trend, according to our very crude analysis.\n\n\n### Relevance\n\n\nThe nature of the industrial revolution is relevant to AI forecasting in the following ways:\n\n\n* If growth during the industrial revolution is a highly improbable aberration from longer term trends, it suggests that it is a consequence of specific developments at the time, most saliently new technologies. This suggests that new technologies can sometimes alone cause changes at the level of the global economy.\n* ‘The impact of the industrial revolution’ is sometimes used as a measure against which to compare consequences of AI developments. Thinking here may be sharpened by clarification on the nature of the industrial revolution. This use is likely related to the point above, where ‘the scale of the industrial revolution’ is taken to be a historically plausible scale of impact for the most ambitious technologies.\n* If economic history is best understood as a sequence of ‘growth modes’, per Hanson 2000,[4](https://aiimpacts.org/was-the-industrial-revolution-a-drastic-departure-from-historic-trends/#easy-footnote-bottom-4-2760 \"Hanson, Robin. “Long-Term Growth As A Sequence of Exponential Modes,” 2000, 24.\") the industrial revolution being one, this changes our best extrapolation to the future. For instance, we might expect the continuation of the current mode to be slower than in a continuously super-exponential model, but may also expect to meet a new growth mode at some point, which may be substantially faster (and have other characteristics recognizable from past ‘growth mode’ changes). See Hanson 2000 for more on this.\n\n\nNotes\n-----\n\n", "url": "https://aiimpacts.org/was-the-industrial-revolution-a-drastic-departure-from-historic-trends/", "title": "Was the industrial revolution a drastic departure from historic trends?", "source": "aiimpacts.org", "source_type": "wordpress", "date_published": "2020-11-17T22:14:30+00:00", "paged_url": "https://aiimpacts.org/feed?paged=5", "authors": ["Katja Grace"], "id": "d3ccf0f0675f16ab3f52d9ed8a735821", "summary": []} {"text": "Energy efficiency of MacCready Gossamer Albatross\n\n*Updated Nov 9, 2020*\n\n\nThe MacCready *Gossamer Albatross*:\n\n\n* covered around 2.0—4.6 m/kJ\n* and moved mass at around 0.1882 —0.4577 kg⋅m/J\n\n\nDetails\n-------\n\n\nThe **MacCready *Gossamer Albatross*** was a human-powered flying machine that crossed the English Channel in 1979.[1](https://aiimpacts.org/maccready-gossamer-albatross/#easy-footnote-bottom-1-2756 \"“The Gossamer Albatross is a human-powered aircraft built by American aeronautical engineer Dr. Paul B. MacCready‘s company AeroVironment. On June 12, 1979, it completed a successful crossing of the English Channel to win the second £100,000 (£509644 today) Kremer prize.[1]“
\n\n\n\n“MacCready Gossamer Albatross.” In Wikipedia, October 7, 2020. https://en.wikipedia.org/w/index.php?title=MacCready_Gossamer_Albatross&oldid=982283381.\") The pilot pedaled the craft, seemingly as if on a bicycle. It had a gross mass of 100kg, flying across the channel,[2](https://aiimpacts.org/maccready-gossamer-albatross/#easy-footnote-bottom-2-2756 \"“The empty mass of the structure was only 71 lb (32 kg), although the gross mass for the Channel flight was almost 220 lb (100 kg). “
\n\n\n\n“MacCready Gossamer Albatross.” In Wikipedia, October 7, 2020. https://en.wikipedia.org/w/index.php?title=MacCready_Gossamer_Albatross&oldid=982283381.\") and flew 35.7 km in 2 hours and 49 minutes.[3](https://aiimpacts.org/maccready-gossamer-albatross/#easy-footnote-bottom-3-2756 \"“Allen completed the 22.2 mi (35.7 km) crossing in 2 hours and 49 minutes, achieving a top speed of 18 mph (29 km/h) and an average altitude of 5 ft (1.5 m).”
\n\n\n\n“MacCready Gossamer Albatross.” In Wikipedia, October 7, 2020. https://en.wikipedia.org/w/index.php?title=MacCready_Gossamer_Albatross&oldid=982283381.\") The crossing was difficult however, so it seems plausible that the *Gossamer Albatross* could fly more efficiently in better conditions.\n\n\nWe do not know the pilot’s average power output, however:\n\n\n* Wikipedia claims at least 300W was required to fly the craft[4](https://aiimpacts.org/maccready-gossamer-albatross/#easy-footnote-bottom-4-2756 \"“To maintain the craft in the air, it was designed with very long, tapering wings (high aspect ratio), like those of a glider, allowing the flight to be undertaken with a minimum of power. In still air, the required power was on the order of 300 W (0.40 hp), though even mild turbulence made this figure rise rapidly.[2]“
“MacCready Gossamer Albatross.” In Wikipedia, October 7, 2020. https://en.wikipedia.org/w/index.php?title=MacCready_Gossamer_Albatross&oldid=982283381.\")\n* Chung 2006, an engineering textbook, claims that the driver, a cyclist, could produce around 200W of power.[5](https://aiimpacts.org/maccready-gossamer-albatross/#easy-footnote-bottom-5-2756 \"Chung, Yip-Wah. Introduction to Materials Science and Engineering. CRC Press, 2006. p89\")\n* Our impression is that 200W is a common power output over houres for amateur cycling. For instance, one of our researchers is able to achieve this for three hours.[6](https://aiimpacts.org/maccready-gossamer-albatross/#easy-footnote-bottom-6-2756 \"https://www.strava.com/activities/272615649/overview\")\n\n\nThe best documented human cycling wattage that we could easily find is from professional rider Giulio Ciccone who won a stage of the Tour de France, then uploaded power data to the fitness tracking site Strava.[7](https://aiimpacts.org/maccready-gossamer-albatross/#easy-footnote-bottom-7-2756 \"Strava. “Yellow Jersey – Giulio Ciccone’s 158.8 Km Bike Ride.” Accessed November 9, 2020. https://www.strava.com/activities/2525139293.\") His performance suggests around 318W is a reasonable upper bound, supposing that the pilot of the *Gossamer Albatross* would have had lower performance.[8](https://aiimpacts.org/maccready-gossamer-albatross/#easy-footnote-bottom-8-2756 \"For an upper value, we used a combination of two metrics given on the website. The first metric is his “weighted average power” for the Tour de France stage, which was 318W. Weighted average power is a way of averaging power over a ride with highly variable power which gives higher weight to higher power portions of the ride, and is used by athletes and coaches to estimate the maximum power that a rider could sustain for a long time, if they had a steady power output. The second metric is Ciccone’s maximum power from his Tour race applied over the duration of the MacCready flight (2 hours and 40 min) which is 5W/kg body weight. For the pilot, Allen, riding with the same power per body weight (65 kg), this would be equivalent to 322W, a similar value to his weighted average power. We use the lower of the two values, 318W.\")\nTo find the energy used by the cyclist, we divided power output by typical efficiency for a human on a bicycle, which according to Wikipedia ranges from .18 to .26.[9](https://aiimpacts.org/maccready-gossamer-albatross/#easy-footnote-bottom-9-2756 \"“The required food can also be calculated by dividing the output power by the muscle efficiency. This is 18–26%. “
“Bicycle Performance.” In Wikipedia, October 9, 2020. https://en.wikipedia.org/w/index.php?title=Bicycle_performance&oldid=982652996.\")\n### Distance per Joule\n\n\nFor distance per energy this gives us a highest measure of:\n\n\n35.7 km / ((200W \\* (2 hours + 49 minutes))/0.26) = 4,577 m/MJ\n\n\nAnd a lowest measure of:\n\n\n35.7 km / ((318W \\* (2 hours + 49 minutes))/0.18) = 1,993 m/MJ\n\n\n### Mass per Joule\n\n\nFor weight times distance per energy this gives us a highest measure of:\n\n\n(100kg \\* 35.7 km) / ((200W \\* (2 hours + 49 minutes))/0.26) = 0.4577 kg⋅m/j\n\n\nAnd a lowest measure of:\n\n\n(100kg \\* 35.7 km) / ((318W \\* (2 hours + 49 minutes))/0.17) = 0.1882 kg⋅m/j\n\n\n \n \n*Primary author: Ronny Fernandez*\n\n\nNotes\n-----\n\n\n\n\n\n", "url": "https://aiimpacts.org/maccready-gossamer-albatross/", "title": "Energy efficiency of MacCready Gossamer Albatross", "source": "aiimpacts.org", "source_type": "wordpress", "date_published": "2020-11-10T02:15:26+00:00", "paged_url": "https://aiimpacts.org/feed?paged=5", "authors": ["Katja Grace"], "id": "0e6394bc19e52d1c1ea87c179fe1c4b7", "summary": []} {"text": "Energy efficiency of Boeing 747-400\n\n*Updated Nov 5, 2020*\n\n\nThe Boeing 747-400:\n\n\n* covers around 0.0021m/kJ.\n* and moves mass at around 0.39 – 0.83 kg.m/J\n\n\nDetails\n-------\n\n\nThe *Boeing 747-400* is a 1987 passenger plane.[1](https://aiimpacts.org/energy-efficiency-of-boeing-747-400/#easy-footnote-bottom-1-2745 \"“The Boeing 747-400 is a wide-body airliner produced by Boeing Commercial Airplanes, an advanced variant of the initial Boeing 747. The “Advanced Series 300” was announced at the September 1984 Farnborough Airshow, targeting a 10% cost reduction with more efficient engines and 1,000 nmi (1,850 km) more range. ”
\n\n\n\n“Boeing 747-400.” In Wikipedia, November 2, 2020. https://en.wikipedia.org/w/index.php?title=Boeing_747-400&oldid=986725646.\")\n### Distance per Joule\n\n\nThe plane uses 10.77 kg/km of fuel on a medium haul flight.[2](https://aiimpacts.org/energy-efficiency-of-boeing-747-400/#easy-footnote-bottom-2-2745 \"“Fuel Economy in Aircraft.” In Wikipedia, October 22, 2020. https://en.wikipedia.org/w/index.php?title=Fuel_economy_in_aircraft&oldid=984919809.\") We do not know what type of fuel it uses, but typical values for aviation fuel are around 44MJ/kg.[3](https://aiimpacts.org/energy-efficiency-of-boeing-747-400/#easy-footnote-bottom-3-2745 \"“The net energy content for aviation fuels depends on their composition. Some typical values are:[15]
\n\n\n\n- BP Avgas 80, 44.65 MJ/kg, density at 15 °C is 690 kg/m3 (30.81 MJ/litre).
- Kerosene type BP Jet A-1, 43.15 MJ/kg, density at 15 °C is 804 kg/m3 (34.69 MJ/litre).
- Kerosene type BP Jet TS-1 (for lower temperatures), 43.2 MJ/kg, density at 15 °C is 787 kg/m3 (34.00 MJ/litre).”
“Aviation Fuel.” In Wikipedia, September 13, 2020. https://en.wikipedia.org/w/index.php?title=Aviation_fuel&oldid=978262126.\") Thus to fly a kilometer, the plane needs 10.77 kg of fuel, which is 10.77 x 44 MJ = 474 MJ of fuel. This gives us 0.0021m/kJ.\n\n\n### Mass.distance per Joule\n\n\nAccording to Wikipedia, the 747’s ‘operating empty weight’ is 183,523 kg and its ‘maximum take-off weight’ is 396,893 kg.[4](https://aiimpacts.org/energy-efficiency-of-boeing-747-400/#easy-footnote-bottom-4-2745 \"“Boeing 747-400.” In Wikipedia, November 2, 2020. https://en.wikipedia.org/w/index.php?title=Boeing_747-400&oldid=986725646.\") We use the range 183,523 kg—396,893 kg since we do not know at what weight in that range the relevant speeds were measured.\n\n\nWe have: \n\n\n* Distance per kilojoule: 0.0021m/kJ\n* Mass: 183,523 kg—396,893 kg\n\n\nThis gives us a range of 0.39 – 0.83 kg.m/J\n\n\n \n \n*Primary author: Ronny Fernandez*\n\n\nNotes\n-----\n\n\n\n", "url": "https://aiimpacts.org/energy-efficiency-of-boeing-747-400/", "title": "Energy efficiency of Boeing 747-400", "source": "aiimpacts.org", "source_type": "wordpress", "date_published": "2020-11-06T05:10:05+00:00", "paged_url": "https://aiimpacts.org/feed?paged=5", "authors": ["Katja Grace"], "id": "9b20e8f9ab152acea5c6a047ac86c96c", "summary": []} {"text": "Energy efficiency of Airbus A320\n\n*Updated Nov 5, 2020*\n\n\nThe Airbus A320:\n\n\n* covers around 0.0078 m/kJ\n* and moves mass at around 0.33 – 0.61 kg.m/J\n\n\nDetails\n-------\n\n\nThe *Airbus A320* is a 1987 passenger plane.[1](https://aiimpacts.org/energy-efficiency-of-airbus-a320/#easy-footnote-bottom-1-2743 \"“The Airbus A320 family are narrow-body airliners designed and produced by Airbus. The A320 was launched in March 1984, first flew on 22 February 1987, and was introduced in April 1988 by Air France.”
\n\n\n\n“Airbus A320 Family.” In Wikipedia, October 30, 2020. https://en.wikipedia.org/w/index.php?title=Airbus_A320_family&oldid=986182483.\")\n### Distance per Joule\n\n\nThe plane uses 2.91 kg of fuel per km on a medium haul flight.[2](https://aiimpacts.org/energy-efficiency-of-airbus-a320/#easy-footnote-bottom-2-2743 \"“Fuel Economy in Aircraft.” In Wikipedia, October 22, 2020. https://en.wikipedia.org/w/index.php?title=Fuel_economy_in_aircraft&oldid=984919809.\") We do not know what type of fuel it uses, but typical values for aviation fuel are around 44MJ/kg.[3](https://aiimpacts.org/energy-efficiency-of-airbus-a320/#easy-footnote-bottom-3-2743 \"“The net energy content for aviation fuels depends on their composition. Some typical values are:[15]
\n\n\n\n- BP Avgas 80, 44.65 MJ/kg, density at 15 °C is 690 kg/m3 (30.81 MJ/litre).
- Kerosene type BP Jet A-1, 43.15 MJ/kg, density at 15 °C is 804 kg/m3 (34.69 MJ/litre).
- Kerosene type BP Jet TS-1 (for lower temperatures), 43.2 MJ/kg, density at 15 °C is 787 kg/m3 (34.00 MJ/litre).”
“Aviation Fuel.” In Wikipedia, September 13, 2020. https://en.wikipedia.org/w/index.php?title=Aviation_fuel&oldid=978262126.\") Thus to fly a kilometer, the plane needs 2.91kg of fuel, which is 2.91 x 44 MJ = 128MJ of fuel. This gives us 0.0078 m/kJ\n\n\n### Mass.distance per Joule\n\n\nAccording to modernairliners.com, the A320’s ‘operating empty weight’ is 42,600 kg and its ‘maximum take-off weight’ is 78,000 kg.[4](https://aiimpacts.org/energy-efficiency-of-airbus-a320/#easy-footnote-bottom-4-2743 \"“Airbus A320 Specs – Modern Airliners.” Accessed November 5, 2020. https://modernairliners.com/airbus-a320-introduction/airbus-a320-specs/.\") We use the range 42,600—78,000 kg, since we do not know at what weight in that range the relevant speeds were measured.\n\n\nWe have: \n\n\n* Distance per kilojoule: 0.0078 m/kJ\n* Mass: 42,600—78,000 kg\n\n\nThis gives us a range of 0.33 – 0.61 kg.m/J\n\n\n \n \n*Primary author: Ronny Fernandez*\n\n\nNotes\n-----\n\n\n\n", "url": "https://aiimpacts.org/energy-efficiency-of-airbus-a320/", "title": "Energy efficiency of Airbus A320", "source": "aiimpacts.org", "source_type": "wordpress", "date_published": "2020-11-06T04:44:03+00:00", "paged_url": "https://aiimpacts.org/feed?paged=5", "authors": ["Katja Grace"], "id": "0c3e7d03605e3dd9d61beff0c2a913b3", "summary": []} {"text": "Energy efficiency of North American P-51 Mustang\n\n*Updated Nov 5, 2020*\n\n\nThe North American P-51 Mustang:\n\n\n* flew around 0.073—0.092 m/kJ\n* and moved mass at around 0.25 – 0.50 kg.m/J\n\n\nDetails\n-------\n\n\nThe *North American P-51 Mustang* was a 1940 US WWII fighter and fighter-bomber.[1](https://aiimpacts.org/energy-efficiency-of-north-american-p-51-mustang/#easy-footnote-bottom-1-2737 \"The North American Aviation P-51 Mustang is an American long-range, single-seat fighter and fighter-bomber used during World War II and the Korean War, among other conflicts. The Mustang was designed in April 1940 by a design team headed by James Kindelberger[6] of North American Aviation (NAA) in response to a requirement of the British Purchasing Commission.”
\n\n\n\n“North American P-51 Mustang.” In Wikipedia, October 19, 2020. https://en.wikipedia.org/w/index.php?title=North_American_P-51_Mustang&oldid=984347874.\")\n### Mass\n\n\nAccording to Wikipedia[2](https://aiimpacts.org/energy-efficiency-of-north-american-p-51-mustang/#easy-footnote-bottom-2-2737 \"“North American P-51 Mustang.” In Wikipedia, October 19, 2020. https://en.wikipedia.org/w/index.php?title=North_American_P-51_Mustang&oldid=984347874.\"):\n\n\n* **Empty weight:** 7,635 lb (3,465 kg)\n* **Gross weight:** 9,200 lb (4,175 kg)\n* **Max takeoff weight:** 12,100 lb (5,488 kg)\n\n\nWe use the range 3,465—5,488 kg, since we do not know at what weight in that range the relevant speeds were measured.\n\n\n### Distance per Joule\n\n\nWikipedia tells us that cruising speed was 362 mph (162 m/s)[3](https://aiimpacts.org/energy-efficiency-of-north-american-p-51-mustang/#easy-footnote-bottom-3-2737 \"“North American P-51 Mustang.” In Wikipedia, October 19, 2020. https://en.wikipedia.org/w/index.php?title=North_American_P-51_Mustang&oldid=984347874.\")\nA table from *WWII Aircraft Performance* gives combinations of flight parameters apparently for a version of the P-51, however it has no title or description, so we cannot be confident. [4](https://aiimpacts.org/energy-efficiency-of-north-american-p-51-mustang/#easy-footnote-bottom-4-2737 \"“P-51D_15342_AppendixB.Pdf.” Accessed November 5, 2020. http://www.wwiiaircraftperformance.org/mustang/P-51D_15342_AppendixB.pdf.\") We extracted some data from it [here](https://docs.google.com/spreadsheets/d/1RsewNj8d8JDlL9628xioi2vcVeG0oPMKlC8u59FVvA4/edit?usp=sharing). This data suggests the best combination of parameters gives a fuel economy of 6.7 miles/gallon (10.8km)\n\n\nWe don’t know what fuel was used, but fuel energy density seems likely to be between 31—39 MJ/L = 117—148 MJ/gallon.[5](https://aiimpacts.org/energy-efficiency-of-north-american-p-51-mustang/#easy-footnote-bottom-5-2737 \"Wikipedia lists energy densities for a variety of fuels, and those for petroleum, 100LL avgas, diesel, and jet fuel are within this range and seem likely to be similar to that used.
\n\n\n\n“Energy Density.” In Wikipedia, September 21, 2020. https://en.wikipedia.org/w/index.php?title=Energy_density&oldid=979608484.\")\nThus the plane flew about 10.8km on 117—148 MJ of fuel, for 0.073—0.092 m/kJ\n\n\n### Mass.distance per Joule\n\n\nWe have: \n\n\n* Distance per kilojoule: 0.073—0.092 m/kJ\n* Mass: 3,465—5,488 kg\n\n\nThis gives us a range of 0.25 – 0.50 kg.m/J\n\n\n \n \n*Primary author: Ronny Fernandez*\n\n\nNotes\n-----\n\n\n\n\n\n\n\n", "url": "https://aiimpacts.org/energy-efficiency-of-north-american-p-51-mustang/", "title": "Energy efficiency of North American P-51 Mustang", "source": "aiimpacts.org", "source_type": "wordpress", "date_published": "2020-11-06T01:04:24+00:00", "paged_url": "https://aiimpacts.org/feed?paged=5", "authors": ["Katja Grace"], "id": "6c0283f82a62f1b6dea5cdde105e0c7f", "summary": []} {"text": "Energy efficiency of Vickers Vimy plane\n\n*Updated Nov 5, 2020*\n\n\nThe Vickers Vimy:\n\n\n* flew around 0.025—0.050 m/kJ\n* and moved mass at around 0.081 – 0.25 kg.m/J\n\n\nDetails\n-------\n\n\nThe *Vickers Vimy* was a 1917 British WWI bomber.[1](https://aiimpacts.org/energy-efficiency-of-vickers-vimy-plane/#easy-footnote-bottom-1-2734 \"“The Vickers Vimy was a British heavy bomber aircraft developed and manufactured by Vickers Limited. Developed during the latter stages of the First World War to equip the Royal Flying Corps (RFC), the Vimy was designed by Reginald Kirshaw “Rex” Pierson, Vickers’ chief designer…On 16 August 1917 Vickers was issued with a contract for three prototype aircraft… the manufacture of the three prototypes was completed within four months.”
\n\n\n\n“Vickers Vimy.” In Wikipedia, October 27, 2020. https://en.wikipedia.org/w/index.php?title=Vickers_Vimy&oldid=985669067.\") It was used in the [first non-stop transatlantic flight](https://aiimpacts.org/historic-trends-in-transatlantic-passenger-travel/).\n\n\n### Mass\n\n\nAccording to Wikipedia[2](https://aiimpacts.org/energy-efficiency-of-vickers-vimy-plane/#easy-footnote-bottom-2-2734 \"“Vickers Vimy.” In Wikipedia, October 27, 2020. https://en.wikipedia.org/w/index.php?title=Vickers_Vimy&oldid=985669067.\"):\n\n\n* **Empty weight:** 7,104 lb (3,222 kg)\n* **Max takeoff weight:** 10,884 lb (4,937 kg)\n\n\nWe use the range 3,222—4,937 kg, since we do not know at what weight in that range the relevant speeds were measured.\n\n\n### Energy use per second\n\n\nWe also have:\n\n\n* **Power:** 360 horsepower = 270 kW[3](https://aiimpacts.org/energy-efficiency-of-vickers-vimy-plane/#easy-footnote-bottom-3-2734 \"“Powerplant: 2 × Rolls-Royce Eagle VIII water-cooled V12 engines, 360 hp (270 kW) each”
“Vickers Vimy.” In Wikipedia, October 27, 2020. https://en.wikipedia.org/w/index.php?title=Vickers_Vimy&oldid=985669067.\")\n* **Efficiency of use of energy from fuel:** we did not find data on this, so use an estimate of 15%-30%, based on what we know about the [energy efficiency of the Wright Flyer](https://aiimpacts.org/energy-efficiency-of-wright-flyer/#Efficiency_of_energy_conversion_from_fuel_to_motor_power).\n\n\nFrom these we can calculate:\n\n\nEnergy use per second \n= power of engine x 1/efficiency in converting energy to engine power \n= 270kJ/s / .15—270kJ/s / .30 \n= 900—1800 kJ/s\n\n\n### Distance per second\n\n\nWikipedia gives us:\n\n\n* ****Maximum speed:****100 mph (160 km/h, 87 kn)[4](https://aiimpacts.org/energy-efficiency-of-vickers-vimy-plane/#easy-footnote-bottom-4-2734 \"“Wright Model B.” In Wikipedia, September 16, 2020. https://en.wikipedia.org/w/index.php?title=Wright_Model_B&oldid=978792334.\")\n\n\nNote that the figures for power do not obviously correspond to the highest measured speed. This is a rough estimate.\n\n\n### Distance per Joule\n\n\nWe now have (from above):\n\n\n* speed = 100 miles/h = 44.7m/s\n* energy use = 900—1800 kJ/s\n\n\nThus, on average each second the plane flies 44.7 m and uses 900—1800 kJ, for 0.025—0.050 m/kJ.\n\n\n### Mass.distance per Joule\n\n\nWe have: \n\n\n* Distance per kilojoule: 0.025—0.050 m/kJ\n* Mass: 3,222—4,937 kg\n\n\nThis gives us a range of 0.081 – 0.25 kg.m/J\n\n\n \n \n*Primary author: Ronny Fernandez*\n\n\nNotes\n-----\n\n", "url": "https://aiimpacts.org/energy-efficiency-of-vickers-vimy-plane/", "title": "Energy efficiency of Vickers Vimy plane", "source": "aiimpacts.org", "source_type": "wordpress", "date_published": "2020-11-05T20:54:31+00:00", "paged_url": "https://aiimpacts.org/feed?paged=6", "authors": ["Katja Grace"], "id": "69092bb11abfe9f46773863de03cf4f1", "summary": []}
{"text": "Energy efficiency of Wright model B\n\n*Updated Nov 5, 2020*\n\n\nThe Wright model B:\n\n\n* flew around 0.10—0.21m/kJ\n* and moved mass at around 0.036 – 0.12 kg.m/J\n\n\nDetails\n-------\n\n\nThe *Wright Model B* was a 1910 plane developed by the Wright Brothers.[1](https://aiimpacts.org/energy-efficiency-of-wright-model-b/#easy-footnote-bottom-1-2731 \"“The Wright Model B was an early pusher biplane designed by the Wright brothers in the United States in 1910. It was the first of their designs to be built in quantity. “
“Wright Model B.” In Wikipedia, September 16, 2020. https://en.wikipedia.org/w/index.php?title=Wright_Model_B&oldid=978792334.\")\n### Mass\n\n\nAccording to Wikipedia[2](https://aiimpacts.org/energy-efficiency-of-wright-model-b/#easy-footnote-bottom-2-2731 \"“Wright Model B.” In Wikipedia, September 16, 2020. https://en.wikipedia.org/w/index.php?title=Wright_Model_B&oldid=978792334.\"):\n\n\n* **Empty weight:** 800 lb (363 kg)\n* **Gross weight:** 1,250 lb (567 kg)\n\n\nWe use the range 363—567 kg, since we do not know at what weight in that range the relevant speeds were measured.\n\n\n### Energy use per second\n\n\nFrom Wikipedia, we have[3](https://aiimpacts.org/energy-efficiency-of-wright-model-b/#easy-footnote-bottom-3-2731 \"“Wright Model B.” In Wikipedia, September 16, 2020. https://en.wikipedia.org/w/index.php?title=Wright_Model_B&oldid=978792334.\"):\n\n\n* **Power:** 35 horsepower = 26kW\n* **Efficiency of use of energy from fuel:** we could not find data on this, so use an estimate of 15%-30%, based on what we know about the [energy efficiency of the Wright Flyer](https://aiimpacts.org/energy-efficiency-of-wright-flyer/#Efficiency_of_energy_conversion_from_fuel_to_motor_power).\n\n\nFrom these we can calculate:\n\n\nEnergy use per second \n= power of engine x 1/efficiency in converting energy to engine power \n= 26kJ/s / .15—26kJ/s / .30 \n= 86.6—173 kJ/s\n\n\n### Distance per second\n\n\nWikipedia gives us[4](https://aiimpacts.org/energy-efficiency-of-wright-model-b/#easy-footnote-bottom-4-2731 \"“Wright Model B.” In Wikipedia, September 16, 2020. https://en.wikipedia.org/w/index.php?title=Wright_Model_B&oldid=978792334.\"):\n\n\n* **Maximum speed:** 45 mph (72 km/h, 39 kn)\n* **Cruise speed:** 40 mph (64 km/h, 35 kn)\n\n\nWe use the cruise speed, as it seems more likely to represent speed achieved with the energy usages reported. \n\n\n### Distance per Joule\n\n\nWe now have (from above):\n\n\n* speed = 40miles/h = 17.9m/s\n* energy use = 86.6—173 kJ/s\n\n\nThus, on average each second the plane flies 17.9m and uses 86.6—173 kJ, for 0.10—0.21m/kJ.\n\n\n### Mass.distance per Joule\n\n\nWe have: \n\n\n* Distance per kilojoule: 0.10—0.21m/kJ\n* Mass: 363—567kg\n\n\nThis gives us a range of 0.036 – 0.12 kg.m/J\n\n\n \n \n*Primary author: Ronny Fernandez*\n\n\nNotes\n-----\n\n\n\n", "url": "https://aiimpacts.org/energy-efficiency-of-wright-model-b/", "title": "Energy efficiency of Wright model B", "source": "aiimpacts.org", "source_type": "wordpress", "date_published": "2020-11-05T20:09:52+00:00", "paged_url": "https://aiimpacts.org/feed?paged=6", "authors": ["Katja Grace"], "id": "923ecaa5bb64292ef85b509ae470db40", "summary": []} {"text": "Energy efficiency of Wright Flyer\n\n*Updated Dec 10, 2020*\n\n\nThe Wright Flyer:\n\n\n* flew around 0.080-0.18m/kJ\n* and moved mass at around .022 – .061 kg.m/J\n\n\nDetails\n-------\n\n\nThe *Wright Flyer* (*Flyer I*) was the first successful plane, built in 1903.[1](https://aiimpacts.org/energy-efficiency-of-wright-flyer/#easy-footnote-bottom-1-2729 \"“The Wright Flyer (often retrospectively referred to as Flyer I or 1903 Flyer) was the first successful heavier-than-air powered aircraft….The Wrights built the aircraft in 1903 using giant spruce wood as their construction material.[2]“
\n\n\n\n“Wright Flyer.” In Wikipedia, October 30, 2020. https://en.wikipedia.org/w/index.php?title=Wright_Flyer&oldid=986246127.\")\n### Mass\n\n\nAccording to Wikipedia[2](https://aiimpacts.org/energy-efficiency-of-wright-flyer/#easy-footnote-bottom-2-2729 \"“Wright Flyer.” In Wikipedia, October 30, 2020. https://en.wikipedia.org/w/index.php?title=Wright_Flyer&oldid=986246127.\"):\n\n\n* **Empty weight:** 605 lb (274 kg)\n* **Max takeoff weight:** 745 lb (338 kg)\n\n\n### Energy use per second\n\n\n#### Fuel use per hour\n\n\nA 1904 article in the Minneapolis Journal says the plane consumed ‘a little less than than ten pounds of gasoline per hour’.[3](https://aiimpacts.org/energy-efficiency-of-wright-flyer/#easy-footnote-bottom-3-2729 \"“At the speed of 1200 revolutions per minute the engine develops sixteen-brake horsepower, with a consumption of a little less than ten pounds of gasoline per hour.” \") A pound of gasoline contains around 20MJ[4](https://aiimpacts.org/energy-efficiency-of-wright-flyer/#easy-footnote-bottom-4-2729 \"“Gasoline has an energy density of about 45 megajoules per kilogram (MJ/kg)”
“Energy Density of Gasoline – The Physics Factbook.” Accessed November 3, 2020. https://hypertextbook.com/facts/2003/ArthurGolnik.shtml.
45MJ/kg = 20.4MJ/lb\") So we have:\n\n\nHourly fuel consumption: 10lb/h x 20MJ/lb = 200MJ/h = 55kJ/s\n\n\nWe don’t know how reliable this source is. For instance, a 1971 book, *The Write Brothers’ Engines and their Design* does not give data on fuel consumption in their table of engine characteristics for lack of available comprehensive data[5](https://aiimpacts.org/energy-efficiency-of-wright-flyer/#easy-footnote-bottom-5-2729 \"“No fuel consumption figures are given, primarily because no comprehensive data have been found. This is most probably because in the early flight years, when the Wrights were so meticulously measuring and recording technical information on the important factors affecting their work, the flights were of such short duration that fuel economy was of very minor importance.”
Hobbs, Leonard S. The Wright Brothers’ Engines and Their Design. [For sale by Supt. of Docs., U.S. Govt. Print. Off.]; First Edition. Smithsonian Institution Press, 1971. https://www.gutenberg.org/files/38739/38739-h/38739-h.htm.\"), suggesting that its authors did not consider the article strong evidence, though it is also possible that they didn’t have access to the 1904 article. \n\n\n#### Utilized motor power / efficiency\n\n\nTo confirm, we can estimate the plane’s energy use per second by a second means: combining the claimed power (energy/second) made use of by the engine, and a guess about how much fuel is needed to deliver that amount of energy.\n\n\n##### Utilized motor power\n\n\nAccording to Wikipedia, the plane had a 12 horsepower (9 kJ/s), gasoline engine.[6](https://aiimpacts.org/energy-efficiency-of-wright-flyer/#easy-footnote-bottom-6-2729 \"“Since they could not find a suitable automobile engine for the task, they commissioned their employee Charlie Taylor to build a new design from scratch, effectively a crude 12-horsepower (9-kilowatt) gasoline engine.[4]
“Wright Flyer.” In Wikipedia, October 30, 2020. https://en.wikipedia.org/w/index.php?title=Wright_Flyer&oldid=986246127.\") The 1904 Minneapolis Journal article put it at 16 horsepower (12 kJ/s), and Orville Wright, quoted by Hobbs (1971), puts it at ‘almost 16 horsepower’ at one point.[7](https://aiimpacts.org/energy-efficiency-of-wright-flyer/#easy-footnote-bottom-7-2729 \"“Speaking of the first engine, Orville Wright wrote, “Since putting in heavier springs to actuate the valves on our engine we have increased its power to nearly 16 hp and at the same time reduced the amount of gasoline consumed per hour to about one-half of what it was.””
Hobbs, Leonard S. The Wright Brothers’ Engines and Their Design. [For sale by Supt. of Docs., U.S. Govt. Print. Off.]; First Edition. Smithsonian Institution Press, 1971. https://www.gutenberg.org/files/38739/38739-h/38739-h.htm.\") Hobbs says that at one point this engine achieved 25 horsepower, though this probably isn’t representative of what was ‘actually utilized’.[8](https://aiimpacts.org/energy-efficiency-of-wright-flyer/#easy-footnote-bottom-8-2729 \"“In the table, performance is given in ranges which are thought to be the most representative of those actually utilized. Occasionally performances were attained even beyond the ranges given. For example, the 4×4-in. flat development engine eventually demonstrated 25 hp at an MEP of approximately 65 psi.”
\n\n\n\nHobbs, Leonard S. The Wright Brothers’ Engines and Their Design. [For sale by Supt. of Docs., U.S. Govt. Print. Off.]; First Edition. Smithsonian Institution Press, 1971. https://www.gutenberg.org/files/38739/38739-h/38739-h.htm.\") For that he gives a range of 8.25-16 horsepower.[9](https://aiimpacts.org/energy-efficiency-of-wright-flyer/#easy-footnote-bottom-9-2729 \"See first table in Appendix. It appears that the lower number is for the first flight, though this is confusing:
\n\n\n\n“One important figure—the horsepower actually utilized during the first flight—is quite accurately known. In 1904 the 1904-1905 flight engine, after having been calibrated by their prony-brake test-fan method, was used to turn the 1903 flight propellers, and Orville Wright calculated this power to be 12.05 bhp by comparing the calibrated engine results with those obtained with the flight engine at Kitty Hawk when tested under similar conditions. However, since the tests were conducted in still air with the engine stationary, this did not exactly represent the flight condition. No doubt the rotational speed of the engine and propellers increased somewhat with the forward velocity of the airplane so that unless the power-rpm curve of the engine was flat, the actual horsepower utilized was probably a small amount greater than Orville’s figures. The lowest power figure shown for this engine is that of its first operation.”
\n\n\n\nHobbs, Leonard S. The Wright Brothers’ Engines and Their Design. [For sale by Supt. of Docs., U.S. Govt. Print. Off.]; First Edition. Smithsonian Institution Press, 1971. https://www.gutenberg.org/files/38739/38739-h/38739-h.htm.\") In light of these estimates, we will use 8.25-16 horsepower, which is 6.15-12 kJ/s.\n\n\n##### Efficiency of energy conversion from fuel to motor power\n\n\nA quote from Orville Wright suggests fuel consumption as 0.580lb of fuel per horsepower hour.[10](https://aiimpacts.org/energy-efficiency-of-wright-flyer/#easy-footnote-bottom-10-2729 \"“Orville Wright quotes an early figure of brake thermal efficiency for the 1903 engine that gives a specific fuel consumption of .580 lb of fuel per bhp/hr based on an estimate of the heating value of the fuel they had. This seems low, considering the compression ratio and probable leakage past their rather weak piston rings, but it is possible.”
\n\n\n\nHobbs, Leonard S. The Wright Brothers’ Engines and Their Design. [For sale by Supt. of Docs., U.S. Govt. Print. Off.]; First Edition. Smithsonian Institution Press, 1971. https://www.gutenberg.org/files/38739/38739-h/38739-h.htm.
\n\n\n\nNote that the quote says bhp/h, but we think it must mean bhp.h.
\n\n\n\nAlso, bhp is ‘brake horsepower’, meaning horsepower measured empirically through a particular mechanism:
\n\n\n\n‘Brake horsepower (bhp) is the power measured using a brake type (load) dynamometer at a specified location, such as the crankshaft, output shaft of the transmission, rear axle or rear wheels.’
“Horsepower.” In Wikipedia, November 3, 2020. https://en.wikipedia.org/w/index.php?title=Horsepower&oldid=986863945. \") This would imply 23% of energy was utilized from the fuel.[11](https://aiimpacts.org/energy-efficiency-of-wright-flyer/#easy-footnote-bottom-11-2729 \"fuel/power = 0.580lb fuel / hp.h
= 0.580 * 20MJ / hp.h
= 11.6MJ/ 745J.h/s
= 11600kJ / (0.745 * 3600 kJ)
= 4.3.
Thus power/fuel = 0.23.\")\nHobbs notes that this seems low, but assumes a similar efficiency: 24.50%. Thus he presumably doesn’t find it implausible.[12](https://aiimpacts.org/energy-efficiency-of-wright-flyer/#easy-footnote-bottom-12-2729 \"“Assuming a rich mixture, consumption of all the air, and an airbrake thermal efficiency of 24.50% for the original engine…”
Hobbs, Leonard S. The Wright Brothers’ Engines and Their Design. [For sale by Supt. of Docs., U.S. Govt. Print. Off.]; First Edition. Smithsonian Institution Press, 1971. https://www.gutenberg.org/files/38739/38739-h/38739-h.htm.\")\nAccording to Wikipedia, the thermal efficiency of a typical gasoline engine is 20%[13](https://aiimpacts.org/energy-efficiency-of-wright-flyer/#easy-footnote-bottom-13-2729 \"“Typically, most petrol engines have approximately 20%(avg.) thermal efficiency, which is nearly half of diesel engines. However some newer engines are reported to be much more efficient (thermal efficiency up to 38%) than previous spark-ignition engines.[5]“
“Petrol Engine.” In Wikipedia, August 20, 2020. https://en.wikipedia.org/w/index.php?title=Petrol_engine&oldid=973981680.\"). It seems that this has increased[14](https://aiimpacts.org/energy-efficiency-of-wright-flyer/#easy-footnote-bottom-14-2729 \"See above note.\"), which would suggest that the typical figure was lower in 1903. We don’t think this undermines the more specific figures given above.\n\n\nIt seems likely that Hobbs number is best here, since he knows about Wright’s number, and may have more information than us about for instance the exact fuel being used. So we use 24.5%.\n\n\n##### Calculation of energy use from motor power/efficiency\n\n\nCombining these numbers, we have:\n\n\npower spent = 6.15-12 kJ/s used by engine x 1 / 24.5% fuel energy needed to get one unit of energy used by engine, given inefficiency\n\n\n= 25-49 kJ/s\n\n\n#### Calculation of energy use\n\n\nWe now have: \n\n\n* energy expenditure calculated via motor power and efficiency: 25-49 kJ/s\n* energy expenditure calculated via hourly fuel use: 55kJ/s\n\n\nNeither figure seems clearly more reliable, so we will use the range 25-55kJ/s\n\n\n### Distance per second\n\n\nTwo of the Wright Flyer’s first flights were 120 feet in 12 seconds and 852 feet in 59 seconds.[15](https://aiimpacts.org/energy-efficiency-of-wright-flyer/#easy-footnote-bottom-15-2729 \"“His first flight lasted 12 seconds for a total distance of 120 feet (37 m) – shorter than the wingspan of a Boeing 747, as noted by observers in the 2003 commemoration of the first flight.[1][5]…The last flight, by Wilbur, was 852 feet (260 m) in 59 seconds, much longer than each of the three previous flights of 120, 175 and 200 feet (37, 53 and 61 m).”
“Wright Flyer.” In Wikipedia, October 30, 2020. https://en.wikipedia.org/w/index.php?title=Wright_Flyer&oldid=986246127.\") This gives speeds of 3m/s and 4.4m/s. We will use the second, since it better represents successful flight, still within the first days.\n\n\n### Distance per Joule\n\n\nWe now have (from above):\n\n\n* speed = 4.4 m/s\n* energy use = 25-55 kJ/s\n\n\nThus, on average each second the plane flies 4.4m and uses 25-55kJ, for 0.080-0.18m/kJ.\n\n\n### Mass.distance per Joule\n\n\nWe have: \n\n\n* Distance per kilojoule: 0.080-0.18m/kJ\n* Mass: 274-338kg\n\n\nThis gives us a range of .022 – .061 kg.m/J\n\n\n \n \n*Primary author: Ronny Fernandez*\n\n\nNotes\n-----\n\n\n\n\n\n\n\n", "url": "https://aiimpacts.org/energy-efficiency-of-wright-flyer/", "title": "Energy efficiency of Wright Flyer", "source": "aiimpacts.org", "source_type": "wordpress", "date_published": "2020-11-04T18:58:55+00:00", "paged_url": "https://aiimpacts.org/feed?paged=6", "authors": ["Katja Grace"], "id": "e7fb471b3aebf931277cd4486b871fe8", "summary": []} {"text": "Automated intelligence is not AI\n\n*By Katja Grace, 1 November 2020, Crossposted from [world spirit sock puppet](https://worldspiritsockpuppet.com).*\n\n\nSometimes we think of ‘artificial intelligence’ as whatever technology ultimately automates human cognitive labor.\n\n\nI question this equivalence, looking at past automation. In practice human cognitive labor is replaced by things that don’t seem at all cognitive, or like what we otherwise mean by AI.\n\n\nSome examples:\n\n\n1. Early in the existence of bread, it might have been toasted by someone holding it close to a fire and repeatedly observing it and recognizing its level of doneness and adjusting. Now we have machines that hold the bread exactly the right distance away from a predictable heat source for a perfect amount of time. You could say that the shape of the object embodies a lot of intelligence, or that intelligence went into creating this ideal but non-intelligent tool.\n2. Self-cleaning ovens replace humans cleaning ovens. Humans clean ovens with a lot of thought—looking at and identifying different materials and forming and following plans to remove some of them. Ovens clean themselves by getting very hot.\n3. Carving a rabbit out of chocolate takes knowledge of a rabbit’s details, along with knowledge of how to move your hands to translate such details into chocolate with a knife. A rabbit mold automates this work, and while this route may still involve intelligence in the melting and pouring of the chocolate, all rabbit knowledge is now implicit in the shape of the tool, though I think nobody would call a rabbit-shaped tin ‘artificial intelligence’.\n4. Human pouring of orange juice into glasses involves various mental skills. For instance, classifying orange juice and glasses and judging how they relate to one another in space, and moving them while keeping an eye on this. Automatic orange juice pouring involves for instance a button that can only be pressed with a glass when the glass is in a narrow range of locations, which opens an orange juice faucet running into a spot common to all the possible glass-locations.\n\n\nSome of this is that humans use intelligence where they can use some other resource, because it is cheap on the margin where the other resource is expensive. For instance, to get toast, you could just leave a lot of bread at different distances then eat the one that is good. That is bread-expensive and human-intelligence-cheap (once you come up with the plan at least). But humans had lots of intelligence and not much bread. And if later we automate a task like this, before we have computers that can act very similarly to brains, then the alternate procedure will tend to be one that replaces human thought with something that actually is cheap at the time, such as metal.\n\n\nI think a lot of this is that to deal with a given problem you can either use flexible intelligence in the moment, or you can have an inflexible system that happens to be just what you need. Often you will start out using the flexible intelligence, because being flexible it is useful for lots of things, so you have some sitting around for everything, whereas you don’t have an inflexible system that happens to be just what you need. But if a problem seems to be happening a lot, it can become worth investing the up-front cost of getting the ideal tool, to free up your flexible intelligence again.\n\n", "url": "https://aiimpacts.org/automated-intelligence-is-not-ai/", "title": "Automated intelligence is not AI", "source": "aiimpacts.org", "source_type": "wordpress", "date_published": "2020-11-01T23:38:44+00:00", "paged_url": "https://aiimpacts.org/feed?paged=6", "authors": ["Katja Grace"], "id": "ce4f896cd5bcadcffe6ed9b8d5665436", "summary": []} {"text": "Time for AI to cross the human range in English draughts\n\n*Updated 26 Oct 2020*\n\n\nAI progress in English draughts performance crossed the following ranges in the following times:\n\n\n\n\n| | | | |\n| --- | --- | --- | --- |\n| **Range** | **Start** | **End** | **Duration (years)** |\n| First attempt to beginner level | 1951 | ~1956, <1961 | ~4, <10 |\n| Beginner to superhuman | ~1956, <1961 | 1994 | ~38, >33 |\n| Above superhuman | 1994 | 2007\\* | 13\\* |\n\n\\* treating perfect play as the end of progress, though progress could potentially be made in performing better against imperfect play.\n \n\n\nDetails\n-------\n\n\n### Metric\n\n\n‘English Draughts’ is a popular variety of draughts, or checkers. \n\n\nHere we look at direct success of AI in beating human players, rather than measuring humans and AI on a separate metric of strength.\n\n\n### Data\n\n\nData here comes mostly from Wikipedia. We found several discrepancies in Wikipedia’s accounts of these events, so consider the remaining data to be somewhat unreliable.\n\n\n### AI achievement of human milestones\n\n\n#### Earliest attempt\n\n\nAccording to Wikipedia, the first checkers program was run in 1951.[1](https://aiimpacts.org/time-for-ai-to-cross-the-human-range-in-english-draughts/#easy-footnote-bottom-1-2704 \"“The first English draughts computer program was written by Christopher Strachey, M.A. at the National Physical Laboratory, London.[5] Strachey finished the programme, written in his spare time, in February 1951. It ran for the first time on NPL’s Pilot ACE on 30 July 1951. He soon modified the programme to run on the Manchester Mark 1.”
\n\n\n\n“English Draughts.” In Wikipedia, October 8, 2020. https://en.wikipedia.org/w/index.php?title=English_draughts&oldid=982525532.\")\n#### Beginner level\n\n\nThere seems to be some ambiguity around the timing and performance of Arthur Samuel’s early draughts programs, but it appears that he worked on them from around 1952. In 1956, he demonstrated a program on television. [2](https://aiimpacts.org/time-for-ai-to-cross-the-human-range-in-english-draughts/#easy-footnote-bottom-2-2704 \"“It didn’t take long before Samuel had a program that played a respectable game of checkers, capable of easily defeating novice players. It was first publicly demonstrated on television on February 24, 1956. Thomas Watson, President of IBM, arranged for the program to be exhibited to shareholders. He predicted that it would result in a fifteen-point rise in the IBM stock price. It did.”
\n\n\n\nSchaeffer, Jonathan. One Jump Ahead: Challenging Human Supremacy in Checkers. 1st Edition. New York: Springer, 1997.
\n\n\n\nquoted in:
\n\n\n\n“Legacy – Chinook – World Man-Machine Checkers Champion.” Accessed October 26, 2020. http://webdocs.cs.ualberta.ca/~chinook/project/legacy.html.\") It is unclear how good the program’s play was, but it is said to have resulted in a fifteen-point rise in the stock price of IBM when demonstrated to IBM shareholders, seemingly at around that time. This weakly suggests that the program played at at least beginner level.\n\n\nIn 1962 Samuel’s program apparently beat an ambiguously skilled player who would by four-years later become a state champion in Connecticut.[3](https://aiimpacts.org/time-for-ai-to-cross-the-human-range-in-english-draughts/#easy-footnote-bottom-3-2704 \"The historical record is fuzzy, but for some reason he chose to have his program debut against Robert Nealey a blind checkers champion from Stamford, Connecticut. IBM’s Research News claimed that Nealey was “a former Connecticut checkers champion, and one of the nation’s foremost players.”
\n\n\n\nAlthough a self-proclaimed master, Nealey’s tournament results never justified such a claim. At the time of the game, he was not a former Connecticut state champion, although he did win the title in 1966, four years after the game with Samuel’s program. In the history of the state championship, no recognized master had won the event. Nealey didn’t play in any of the premier checkers events, such as the U.S. championship, and apparently acquired his reputation by beating local players.”
\n\n\n\nSchaeffer, Jonathan. One Jump Ahead: Challenging Human Supremacy in Checkers. 1st Edition. New York: Springer, 1997.
\n\n\n\nquoted in:
\n\n\n\n“Legacy – Chinook – World Man-Machine Checkers Champion.” Accessed October 26, 2020. http://webdocs.cs.ualberta.ca/~chinook/project/legacy.html.\") Thus progress was definitely beyond beginner level by 1962.\n\n\n#### Superhuman level\n\n\nIn 1994, computer program Chinook drew six times against world champion Marius Tinsley, before Tinsley withdrew due to pancreatic cancer and Chinook officially won.[4](https://aiimpacts.org/time-for-ai-to-cross-the-human-range-in-english-draughts/#easy-footnote-bottom-4-2704 \"“In a rematch, Chinook was declared the Man-Machine World Champion in checkers in 1994 in a match against Marion Tinsley after six drawn games, and Tinsley’s withdrawal due to pancreatic cancer. While Chinook became the world champion, it never defeated the best checkers player of all time, Tinsley, who was significantly superior to even his closest peer.[1]“
\n\n\n\n“Chinook (Computer Program).” In Wikipedia, August 24, 2020. https://en.wikipedia.org/w/index.php?title=Chinook_(computer_program)&oldid=974711515.\") Thus Chinook appears to have been close to as good as the best player in 1994.\n\n\n#### End of progress\n\n\nIn 2007 checkers was ‘weakly solved’, which is to say that perfect play guaranteeing a draw for both sides from the start of the game is known, from the starting state[5](https://aiimpacts.org/time-for-ai-to-cross-the-human-range-in-english-draughts/#easy-footnote-bottom-5-2704 \"“English draughts was weakly solved in 2007 by the team of Canadian computer scientist Jonathan Schaeffer. From the standard starting position, both players can guarantee a draw with perfect play.”
\n\n\n\n“Draughts.” In Wikipedia, October 25, 2020. https://en.wikipedia.org/w/index.php?title=Draughts&oldid=985336948.\") (this does not imply that if someone plays imperfectly, perfect moves following this are known).[6](https://aiimpacts.org/time-for-ai-to-cross-the-human-range-in-english-draughts/#easy-footnote-bottom-6-2704 \"“A two-player game can be solved on several levels:[1][2]…
Weak
Provide an algorithm that secures a win for one player, or a draw for either, against any possible moves by the opponent, from the beginning of the game. That is, produce at least one complete ideal game (all moves start to end) with proof that each move is optimal for the player making it. It does not necessarily mean a computer program using the solution will play optimally against an imperfect opponent.”
“Solved Game.” In Wikipedia, September 11, 2020. https://en.wikipedia.org/w/index.php?title=Solved_game&oldid=977794097.\") This is not the best possible performance by all measures, since further progress could presumably be made on reliably beating worse players. \n\n\n### Times for AI to cross human-relative ranges\n\n\nGiven the above dates, we have:\n\n\n\n\n| | | | |\n| --- | --- | --- | --- |\n| **Range** | **Start** | **End** | **Duration (years)** |\n| First attempt to beginner level | 1951 | ~1956, <1961 | ~4, <10 |\n| Beginner to superhuman | ~1956, <1961 | 1994 | ~38, >33 |\n| Above superhuman | 1994 | 2007\\* | 13\\* |\n\n\\* treating perfect play as the end of progress, though progress could potentially be made in performing better against imperfect play.\n\n**Primary author: Katja Grace**\n\n\nNotes\n-----\n\n\n\n", "url": "https://aiimpacts.org/time-for-ai-to-cross-the-human-range-in-english-draughts/", "title": "Time for AI to cross the human range in English draughts", "source": "aiimpacts.org", "source_type": "wordpress", "date_published": "2020-10-26T22:28:36+00:00", "paged_url": "https://aiimpacts.org/feed?paged=6", "authors": ["Katja Grace"], "id": "7ef6110a1a82e766b5c1a87ca7a71116", "summary": []} {"text": "Time for AI to cross the human range in StarCraft\n\n*Published 20 Oct 2020; updated 22 Oct 2020*\n\n\nProgress in AI StarCraft performance took:\n\n\n* ~0 years to reach the level of an untrained human\n* ~21 years to pass from beginner level to high professional human level\n* ~2 years to continue from trained human to current performance (2020), with no particular end in sight.\n\n\nDetails\n-------\n\n\n### Metric\n\n\nWe compare human and AI players on their direct ability to beat one another (rather than a measure of the overall performance of each).\n\n\n### AI milestones\n\n\n#### Earliest attempt\n\n\nStarcraft was released in 1998[1](https://aiimpacts.org/time-for-ai-to-cross-the-human-range-in-starcraft/#easy-footnote-bottom-1-2684 \"“The series debuted with the video game StarCraft in 1998.”
\n\n\n\n“StarCraft.” In Wikipedia, September 29, 2020. https://en.wikipedia.org/w/index.php?title=StarCraft&oldid=980937551.\") The game allows the player to play against a computer opponent, however this built-in AI has access to information that a normal player would not have. For instance, it has real-time information about what the other player is doing at all times, which is normally hidden. We do not have detailed knowledge about early StarCraft AIs that do not have this advantage, but our impression is that it was possible to write them from the start (see next section).\n\n\n#### Beginner level\n\n\nOur impression is that since StarCraft Brood War came out in 1998, it has been possible to write a bot that can beat a player who recently learned the game, without “cheating” in the way that the game’s built-in computer opponents do. This is uncertain, and based on private discussion with people who write Starcraft AIs that compete in tournaments.\n\n\n#### Professional level\n\n\nIn 2018, DeepMind’s AlphaStar beat MaNa[2](https://aiimpacts.org/time-for-ai-to-cross-the-human-range-in-starcraft/#easy-footnote-bottom-2-2684 \"“In a series of test matches held on 19 December, AlphaStar decisively beat Team Liquid’s Grzegorz “MaNa” Komincz, one of the world’s strongest professional StarCraft players, 5-0, following a successful benchmark match against his team-mate Dario “TLO” Wünsch. The matches took place under professional match conditions on a competitive ladder map and without any game restrictions.”
\n\n\n\nDeepmind. “AlphaStar: Mastering the Real-Time Strategy Game StarCraft II.” Accessed October 22, 2020. /blog/article/alphastar-mastering-real-time-strategy-game-starcraft-ii.\"), a strong professional player (seemingly 13th place in the 2018 StarCraft II World Championship Series Circuit)[3](https://aiimpacts.org/time-for-ai-to-cross-the-human-range-in-starcraft/#easy-footnote-bottom-3-2684 \"Liquipedia StarCraft 2 Wiki. “2018 StarCraft II World Championship Series Circuit: Standings.” Accessed October 20, 2020. https://liquipedia.net/starcraft2/2018_StarCraft_II_World_Championship_Series_Circuit/Standings.\"). This does not imply that AlphaStar was in general a stronger player than MaNa, but suggests AlphaStar was at a broadly high professional level. How AlphaStar’s performance compares to humans will depend on how narrowly the task is defined, so that if the AI is not allowed to give commands faster than a human is able, it will compare less favorably than if it is allowed to give commands very quickly[4](https://aiimpacts.org/time-for-ai-to-cross-the-human-range-in-starcraft/#easy-footnote-bottom-4-2684 \"AI Impacts researcher Rick Korzekwa details this controversy in a blog post:
\n\n\n\n“The Unexpected Difficulty of Comparing AlphaStar to Humans – AI Impacts.” Accessed October 22, 2020. https://aiimpacts.org/the-unexpected-difficulty-of-comparing-alphastar-to-humans/.\").\n\n\n### Times for AI to cross human-relative ranges\n\n\nGiven the above dates, we have:\n\n\n\n\n| | | | |\n| --- | --- | --- | --- |\n| **Range** | **Start** | **End** | **Duration (years)** |\n| First attempt to beginner level | 1998 | 1998 | ~0 |\n| Beginner to superhuman | 1998 | 2018 | ~21 |\n| Above superhuman | 2018 | ? | >2 |\n\n\n\n*Primary author: Rick Korzekwa*\n\n\nNotes\n-----\n\n", "url": "https://aiimpacts.org/time-for-ai-to-cross-the-human-range-in-starcraft/", "title": "Time for AI to cross the human range in StarCraft", "source": "aiimpacts.org", "source_type": "wordpress", "date_published": "2020-10-20T20:55:24+00:00", "paged_url": "https://aiimpacts.org/feed?paged=6", "authors": ["Katja Grace"], "id": "ddeca98ba8a1afc29f34e1fdc08f16ac", "summary": []} {"text": "Time for AI to cross the human performance range in ImageNet image classification\n\n*Published 19 Oct 2020*\n\n\nProgress in computer image classification performance took:\n\n\n* Over 14 years to reach the level of an untrained human\n* 3 years to pass from untrained human level to trained human level\n* 5 years to continue from trained human to current performance (2020)\n\n\nDetails\n-------\n\n\n### Metric\n\n\nImageNet[1](https://aiimpacts.org/time-for-ai-to-cross-the-human-performance-range-in-imagenet-image-classification/#easy-footnote-bottom-1-2683 \"“ImageNet is an image database organized according to the WordNet hierarchy (currently only the nouns), in which each node of the hierarchy is depicted by hundreds and thousands of images. Currently we have an average of over five hundred images per node. “
\n\n\n\n“ImageNet.” Accessed October 19, 2020. http://www.image-net.org/.\") is a large collection of images organized into a hierarchy of noun categories. We looked at ‘top-5 accuracy’ in categorizing images. In this task, the player is given an image, and can guess five different categories that the image might represent. It is judged as correct if the image is in fact in any of those five categories.\n\n\n### Human performance milestones\n\n\n#### Beginner level\n\n\nWe used Andrej Karpathy’s interface[2](https://aiimpacts.org/time-for-ai-to-cross-the-human-performance-range-in-imagenet-image-classification/#easy-footnote-bottom-2-2683 \"Karpathy, Andrej. “Ilsvrc.” Accessed October 19, 2020. https://cs.stanford.edu/people/karpathy/ilsvrc/.\") for doing the ImageNet top-5 accuracy task ourselves, and asked a few friends to do it. Five people did it, with performances ranging from 74% to 89%, with a median performance of 81%. \n\n\nThis was not a random sample of people, and conditions for taking the test differed. Most notably, there was no time limit, so time allocated was set by patience for trying to marginally improve guesses.\n\n\n#### Trained human-level\n\n\nImageNet categorization is not a popular activity for humans, so we do not know what highly talented and trained human performance would look like. The best relatively high human performance measure we have comes from Russakovsky et al, who report on performance of two ‘expert annotators’, who they say learned many of the categories. [3](https://aiimpacts.org/time-for-ai-to-cross-the-human-performance-range-in-imagenet-image-classification/#easy-footnote-bottom-3-2683 \"‘Therefore, in evaluating the human accuracy we relied primarily on expert annotators who learned to recognize a large portion of the 1000 ILSVRC classes. During training, the annotators labeled a few hundred validation images for practice and later switched to the test set images’
\n\n\n\nRussakovsky, Olga, Jia Deng, Hao Su, Jonathan Krause, Sanjeev Satheesh, Sean Ma, Zhiheng Huang, et al. “ImageNet Large Scale Visual Recognition Challenge.” ArXiv:1409.0575 [Cs], January 29, 2015. http://arxiv.org/abs/1409.0575.\") The better performing annotator there had a 5.1% error rate.[4](https://aiimpacts.org/time-for-ai-to-cross-the-human-performance-range-in-imagenet-image-classification/#easy-footnote-bottom-4-2683 \"“Annotator A1 evaluated a total of 1500 test set images. The GoogLeNet classi\fcation error on this sample was estimated to be 6.8% (recall that the error on full test set of 100,000 images is 6.7%, as shown in Table 7). The human error was estimated to be 5.1%.”
Also see Table 9
Russakovsky, Olga, Jia Deng, Hao Su, Jonathan Krause, Sanjeev Satheesh, Sean Ma, Zhiheng Huang, et al. “ImageNet Large Scale Visual Recognition Challenge.” ArXiv:1409.0575 [Cs], January 29, 2015. http://arxiv.org/abs/1409.0575.\")\n### AI achievement of human milestones\n\n\n#### Earliest attempt\n\n\nThe ImageNet database was released in 2009.[5](https://aiimpacts.org/time-for-ai-to-cross-the-human-performance-range-in-imagenet-image-classification/#easy-footnote-bottom-5-2683 \"“They presented their database for the first time as a poster at the 2009 Conference on Computer Vision and Pattern Recognition (CVPR) in Florida.”
“ImageNet.” In Wikipedia, September 9, 2020. https://en.wikipedia.org/w/index.php?title=ImageNet&oldid=977585441.
\"). An annual contest, the ImageNet Large Scale Visual Recognition Challenge, began in 2010.[6](https://aiimpacts.org/time-for-ai-to-cross-the-human-performance-range-in-imagenet-image-classification/#easy-footnote-bottom-6-2683 \"“…The ImageNet Large Scale Visual Recognition Challenge (ILSVRC) has been running annually for five years (since 2010) and has become the standard benchmark for large-scale object recognition.”
Russakovsky, Olga, Jia Deng, Hao Su, Jonathan Krause, Sanjeev Satheesh, Sean Ma, Zhiheng Huang, et al. “ImageNet Large Scale Visual Recognition Challenge.” ArXiv:1409.0575 [Cs], January 29, 2015. http://arxiv.org/abs/1409.0575.\")\nIn the 2010 contest, the best top-5 classification performance had 28.2% error.[7](https://aiimpacts.org/time-for-ai-to-cross-the-human-performance-range-in-imagenet-image-classification/#easy-footnote-bottom-7-2683 \"See table 6.
\n\n\n\nRussakovsky, Olga, Jia Deng, Hao Su, Jonathan Krause, Sanjeev Satheesh, Sean Ma, Zhiheng Huang, et al. “ImageNet Large Scale Visual Recognition Challenge.” ArXiv:1409.0575 [Cs], January 29, 2015. http://arxiv.org/abs/1409.0575.\") \n\n\nHowever image classification broadly is older. Pascal VOC was a similar previous contest, which ran from 2005.[8](https://aiimpacts.org/time-for-ai-to-cross-the-human-performance-range-in-imagenet-image-classification/#easy-footnote-bottom-8-2683 \"“The PASCAL Visual Object Classes (VOC) challenge is a benchmark in visual object category recognition and detection, providing the vision and machine learning communities with a standard dataset of images and annotation, and standard evaluation procedures. Organised annually from 2005 to present, the challenge and its associated dataset has become accepted as the benchmark for object detection.”
\n\n\n\nEveringham, Mark, Luc Van Gool, Christopher K. I. Williams, John Winn, and Andrew Zisserman. “The Pascal Visual Object Classes (VOC) Challenge.” International Journal of Computer Vision 88, no. 2 (June 2010): 303–38. https://doi.org/10.1007/s11263-009-0275-4.\") We do not know when the first successful image classification systems were developed. In a blog post, Amidi & Amidi point to LeNet as pioneering work in image classification[9](https://aiimpacts.org/time-for-ai-to-cross-the-human-performance-range-in-imagenet-image-classification/#easy-footnote-bottom-9-2683 \"See section ‘LeNet’.
“The Evolution of Image Classification Explained.” Accessed October 19, 2020. https://stanford.edu/~shervine/blog/evolution-image-classification-explained#lenet.\"), and it appears to have been developed in 1998.[10](https://aiimpacts.org/time-for-ai-to-cross-the-human-performance-range-in-imagenet-image-classification/#easy-footnote-bottom-10-2683 \"“LeNet is a convolutional neural network structure proposed by Yann LeCun et al. in 1998.”
“LeNet.” In Wikipedia, June 19, 2020. https://en.wikipedia.org/w/index.php?title=LeNet&oldid=963418885.\")\n#### Beginner level\n\n\nThe first entrant in the ImageNet contest to perform better than our beginner level benchmark was SuperVision (commonly known as AlexNet) in 2012, with a 15.3% error rate.[11](https://aiimpacts.org/time-for-ai-to-cross-the-human-performance-range-in-imagenet-image-classification/#easy-footnote-bottom-11-2683 \"“We also entered a variant of this model in the
ILSVRC-2012 competition and achieved a winning top-5 test error rate of 15.3%”
Krizhevsky, Alex, Ilya Sutskever, and Geoffrey E Hinton. “ImageNet Classification with Deep Convolutional Neural Networks.” In Advances in Neural Information Processing Systems 25, edited by F. Pereira, C. J. C. Burges, L. Bottou, and K. Q. Weinberger, 1097–1105. Curran Associates, Inc., 2012. http://papers.nips.cc/paper/4824-imagenet-classification-with-deep-convolutional-neural-networks.pdf.
Also, see Table 6 for a list of other entrants:
Russakovsky, Olga, Jia Deng, Hao Su, Jonathan Krause, Sanjeev Satheesh, Sean Ma, Zhiheng Huang, et al. “ImageNet Large Scale Visual Recognition Challenge.” ArXiv:1409.0575 [Cs], January 29, 2015. http://arxiv.org/abs/1409.0575.\")\n#### Superhuman level\n\n\nIn 2015 He et al apparently achieved a 4.5% error rate, slightly better than our high human benchmark.[12](https://aiimpacts.org/time-for-ai-to-cross-the-human-performance-range-in-imagenet-image-classification/#easy-footnote-bottom-12-2683 \"“Our 152-layer ResNet has a single-model top-5 validation error of 4.49%.”
Also see Table 4
He, Kaiming, Xiangyu Zhang, Shaoqing Ren, and Jian Sun. “Deep Residual Learning for Image Recognition.” ArXiv:1512.03385 [Cs], December 10, 2015. http://arxiv.org/abs/1512.03385.\")\n#### Current level\n\n\nAccording to paperswithcode.com, performance has continued to climb, to 2020, though slower than earlier.[13](https://aiimpacts.org/time-for-ai-to-cross-the-human-performance-range-in-imagenet-image-classification/#easy-footnote-bottom-13-2683 \"See figure:
“Papers with Code – ImageNet Benchmark (Image Classification).” Accessed October 19, 2020. https://paperswithcode.com/sota/image-classification-on-imagenet.\")\n### Times for AI to cross human-relative ranges\n\n\nGiven the above dates, we have:\n\n\n\n\n| | | | |\n| --- | --- | --- | --- |\n| Range | Start | End | Duration (years) |\n| First attempt to beginner level | <1998 | 2012 | >14 |\n| Beginner to superhuman | 2012 | 2015 | 3 |\n| Above superhuman | 2015 | >2020 | >5 |\n\n\n\n*Primary author: Rick Korzekwa*\n\n\nNotes\n-----\n\n\n\n\n\n\n\n\n\n\n\n\n\n", "url": "https://aiimpacts.org/time-for-ai-to-cross-the-human-performance-range-in-imagenet-image-classification/", "title": "Time for AI to cross the human performance range in ImageNet image classification", "source": "aiimpacts.org", "source_type": "wordpress", "date_published": "2020-10-19T23:52:50+00:00", "paged_url": "https://aiimpacts.org/feed?paged=6", "authors": ["Katja Grace"], "id": "354ff95b57e6deef01ef745e221e1f4f", "summary": []}
{"text": "Time for AI to cross the human performance range in Go\n\n*Posted 15 Oct 2020; updated 19 Oct 2020*\n\n\nProgress in computer Go performance took:\n\n\n* 0-19 years to go from the first attempt to playing at human beginner level (<1987)\n* >30 years to go from human beginner level to superhuman level (<1987-2017)\n* 3 years to go from superhuman level to the the current highest performance (2017-2020)\n\n\nDetails\n-------\n\n\n### Human performance milestones\n\n\nHuman go ratings range from 30 kyu (beginner), through 7 dan to at least 9 professional dan.[1](https://aiimpacts.org/time-for-ai-to-cross-the-human-performance-range-in-go/#easy-footnote-bottom-1-2680 \"“Go Ranks and Ratings.” In Wikipedia, June 20, 2020. https://en.wikipedia.org/w/index.php?title=Go_ranks_and_ratings&oldid=963489455.\") These ratings go downwards through kyu levels, then upward through dan levels, then upward through professional dan levels. The top ratings seem to be [closer together](http://en.wikipedia.org/wiki/Go_ranks_and_ratings#Elo-like_rating_systems_as_used_in_Go) than the lower ones, though there are apparently [multiple systems](https://en.wikipedia.org/wiki/Go_ranks_and_ratings#Winning_probabilities) which vary)[2](https://aiimpacts.org/time-for-ai-to-cross-the-human-performance-range-in-go/#easy-footnote-bottom-2-2680 \"See table:
“Go Ranks and Ratings.” In Wikipedia, June 20, 2020. https://en.wikipedia.org/w/index.php?title=Go_ranks_and_ratings&oldid=963489455.\")\n### AI achievement of human milestones\n\n\n#### Earliest attempt\n\n\nWikipedia says the first Go program was written in 1968.[3](https://aiimpacts.org/time-for-ai-to-cross-the-human-performance-range-in-go/#easy-footnote-bottom-3-2680 \"“The first Go program was written by Albert Lindsey Zobrist in 1968 as part of his thesis on pattern recognition.[11] It introduced an influence function to estimate territory and Zobrist hashing to detect ko.”\") We do not know how well it performed.\n\n\n#### Beginner level\n\n\nWe have not investigated early Go performance in depth. Figure 1 includes informed guesses about early performance by David Fotland, author of successful Go program, *The Many Faces of Go*, and *Sensei’s Library*, a Go wiki.[4](https://aiimpacts.org/time-for-ai-to-cross-the-human-performance-range-in-go/#easy-footnote-bottom-4-2680 \"“Figure 25 shows estimates from two
sources: David Fotland—author of The Many Faces of Go, an Olympiad-winning Go program—and Sensei’s Library, a collaborative Go wiki. David Fotland warns that the data from before bots played on KGS is poor, as programs tended not to play in human tournaments and so failed to get ratings.”
Grace, Katja. “Algorithmic Progress in Six Domains.” Berkeley, CA: Machine Intelligence Research Institute, 2013.\") Fotland says that early data on AI Go performance is poor, since bots did not play in tournaments, so were not rated.\n\n\n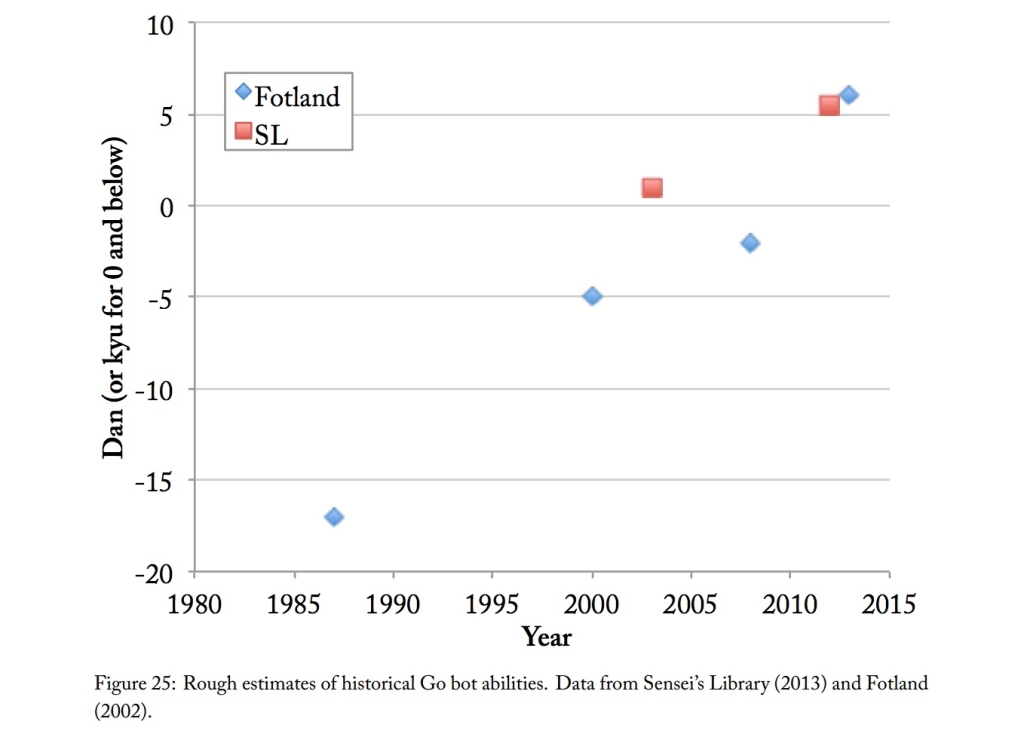**Figure 1**: From [Grace 2013](http://intelligence.org/files/AlgorithmicProgress.pdf).\nThis suggests that by 1987 Go bots were performing better than human beginners. We do not have evidence to pin down the date of human beginner level AI better, but have also not investigated thoroughly (there appears to be more evidence).\n\n\n#### Superhuman level\n\n\nIn May 2017 AlphaGo beat the top ranked Go player in the world.[5](https://aiimpacts.org/time-for-ai-to-cross-the-human-performance-range-in-go/#easy-footnote-bottom-5-2680 \"“In May 2017, AlphaGo beat Ke Jie, who at the time was ranked top in the world,[27][28] in a three-game match during the Future of Go Summit.[29]“
“Computer Go.” In Wikipedia, July 27, 2020. https://en.wikipedia.org/w/index.php?title=Computer_Go&oldid=969736537\") This does not imply that AlphaGo was overall better, but a new version in October could beat the May version in 89 games out of 100[6](https://aiimpacts.org/time-for-ai-to-cross-the-human-performance-range-in-go/#easy-footnote-bottom-6-2680 \"“In October 2017, DeepMind revealed a new version of AlphaGo, trained only through self play, that had surpassed all previous versions, beating the Ke Jie version in 89 out of 100 games.[30]“
“Computer Go.” In Wikipedia, July 27, 2020. https://en.wikipedia.org/w/index.php?title=Computer_Go&oldid=969736537\"), suggesting that if in May it would have beaten Ke Jie in more than 11% of games, the new version would beat Ke Jie more than half the time, i.e. perform better than the best human player. Thus 2017 seems like a reasonable date for top human-level play.\n\n\n### Times for AI to cross human-relative ranges\n\n\nGiven the above dates, we have:\n\n\n\n\n| | | | |\n| --- | --- | --- | --- |\n| Range | Start | End | Duration (years) |\n| First attempt to beginner level | 1968 | <1987 | <19 |\n| Beginner to superhuman | <1987 | 2017 | >30 |\n| Above superhuman | 2017 | >2020 | >3 |\n\n\n\n**Primary author: Katja Grace**\n\n\nNotes\n-----\n\n\n\n", "url": "https://aiimpacts.org/time-for-ai-to-cross-the-human-performance-range-in-go/", "title": "Time for AI to cross the human performance range in Go", "source": "aiimpacts.org", "source_type": "wordpress", "date_published": "2020-10-16T00:05:43+00:00", "paged_url": "https://aiimpacts.org/feed?paged=6", "authors": ["Katja Grace"], "id": "105ce2013e102358bcb666d099ef5069", "summary": []}
{"text": "Time for AI to cross the human performance range in chess\n\n**Published 15 Oct 2020**\n\n\nProgress in computer chess performance took: \n\n\n* ~0 years to go from from playing chess at all to playing it at human beginner level\n* ~49 years to go from human beginner level to superhuman level\n* ~11 years to go from superhuman level to the the current highest performance\n\n\nDetails\n-------\n\n\n### Human range performance milestones\n\n\nWe use the common Elo system for measuring chess performance. Human chess Elo ratings range from around 800 (beginner)[1](https://aiimpacts.org/time-for-ai-to-cross-the-human-performance-range-in-chess/#easy-footnote-bottom-1-2673 \"“In general, a beginner (non-scholastic) is 800, the average player is 1500, and professional level is 2200.”
“Elo Rating System.” In Wikipedia, October 12, 2020. https://en.wikipedia.org/w/index.php?title=Elo_rating_system&oldid=983064897.\") to 2882 (highest recorded).[2](https://aiimpacts.org/time-for-ai-to-cross-the-human-performance-range-in-chess/#easy-footnote-bottom-2-2673 \" “Table of top 20 rated players of all-time, with date their best ratings were first achieved…1 2882 Magnus Carlsen May 2014 23 years, 5 months”
“Comparison of Top Chess Players throughout History.” In Wikipedia, July 27, 2020. https://en.wikipedia.org/w/index.php?title=Comparison_of_top_chess_players_throughout_history&oldid=969714742.\") The highest recorded human score is likely higher than it would have been without chess AI existing, since top players can learn from the AI.[3](https://aiimpacts.org/time-for-ai-to-cross-the-human-performance-range-in-chess/#easy-footnote-bottom-3-2673 \"For instance, the highest ranked player Magnus Carlsen has called AlphaZero his hero, and his strategy was noted by some to be reminiscent of it:
“This original strategy drew comparisons with the neural network program Alphazero, which Carlsen called his “hero” in a recent interview.”
the Guardian. “Chess: Magnus Carlsen Scores in Alphazero Style in Hunt for Further Records,” June 28, 2019. http://www.theguardian.com/sport/2019/jun/28/chess-magnus-carlsen-scores-in-alphazero-style-hunts-new-record.\") \n\n\n### Times for machines to cross ranges\n\n\n#### Beginner to superhuman range\n\n\nWe could not find transparent sources for low computer chess Elo records, but it seems common to place Elo scores of 800-1200 in the 1950s and 1960s. In his book *Robot* (1999)[/note]Moravec, Hans. *Robot: Mere Machine to Transcendent Mind*, n.d., p71, also at
reddit. “R/Chess – Deep Blue’s True Elo Rating?” Accessed October 13, 2020. https://www.reddit.com/r/chess/comments/7bm361/deep_blues_true_elo_rating/.\")\nAccording to the [Swedish Chess Computer Association records](https://aiimpacts.org/historic-trends-in-chess-ai/), 2006 is the year when the highest machine Elo rating surpassed the highest human Elo (both the highest at the time, and the highest in 2020). In particular Rybka 1.2 was rated 2902. At the time, the highest human Elo rating was Garry Kasparov at 2851.[9](https://aiimpacts.org/time-for-ai-to-cross-the-human-performance-range-in-chess/#easy-footnote-bottom-9-2673 \"“Comparison of Top Chess Players throughout History.” In Wikipedia, July 27, 2020. https://en.wikipedia.org/w/index.php?title=Comparison_of_top_chess_players_throughout_history&oldid=969714742.\")\nThus it took around 49 years for computers to progress from beginner human level chess to superhuman chess. \n\n\n#### Pre-human range\n\n\nThe Chess Programming Wiki says that the 1957 Bernstein Chess program was the first complete chess program.[10](https://aiimpacts.org/time-for-ai-to-cross-the-human-performance-range-in-chess/#easy-footnote-bottom-10-2673 \"“The Bernstein Chess Program,
was the first complete chess program, developed around 1957“
“The Bernstein Chess Program.” In Chess Programming WIKI. Accessed October 13, 2020. https://www.chessprogramming.org/The_Bernstein_Chess_Program.\") This seems likely to be the same Bernstein program noted by Moravec as having an 800 Elo in 1957 (see above). Thus if correct, this means that once machines could complete the task of playing chess at all, they could already do it at human beginner level. This may not be accurate (none of these sources appear to be very reliable), but it strongly suggests that the time between lowest possible performance and beginner human performance was not as long as decades.\n\n\n#### Superhuman performance range\n\n\nThe Swedish Chess Computer Association has measured continued progress. As of July 2020, the best chess machine is rated 3558[11](https://aiimpacts.org/time-for-ai-to-cross-the-human-performance-range-in-chess/#easy-footnote-bottom-11-2673 \"“The SSDF Rating List.” Accessed October 15, 2020. https://ssdf.bosjo.net/list.htm.\"), whereas in 2019 sometime, the highest rating was 3529.[12](https://aiimpacts.org/time-for-ai-to-cross-the-human-performance-range-in-chess/#easy-footnote-bottom-12-2673 \"“Swedish Chess Computer Association.” In Wikipedia, September 19, 2020. https://en.wikipedia.org/w/index.php?title=Swedish_Chess_Computer_Association&oldid=979229545.\") Alphazero also appeared to have an Elo just below 3500 in 2017, according to its creators (from a small figure with unclear labels).[13](https://aiimpacts.org/time-for-ai-to-cross-the-human-performance-range-in-chess/#easy-footnote-bottom-13-2673 \"See Figure 1:
\n\n\n\nSilver, David, Thomas Hubert, Julian Schrittwieser, Ioannis Antonoglou, Matthew Lai, Arthur Guez, Marc Lanctot, et al. “Mastering Chess and Shogi by Self-Play with a General Reinforcement Learning Algorithm.” ArXiv:1712.01815 [Cs], December 5, 2017. http://arxiv.org/abs/1712.01815.\") \n\n\nWe know of no particular upper bound to chess performance.\n\n\nThis suggests that so far the superhuman range in chess playing has permitted at least least 14 years of further progress, and may permit much more.\n\n\n***Primary author: Katja Grace***\n\n\nNotes\n-----\n\n\n\n\n\n\n", "url": "https://aiimpacts.org/time-for-ai-to-cross-the-human-performance-range-in-chess/", "title": "Time for AI to cross the human performance range in chess", "source": "aiimpacts.org", "source_type": "wordpress", "date_published": "2020-10-15T23:36:00+00:00", "paged_url": "https://aiimpacts.org/feed?paged=6", "authors": ["Katja Grace"], "id": "32af19cf17ea9e0d76b6f177d5f3238c", "summary": []}
{"text": "Relevant pre-AGI possibilities\n\n*By Daniel Kokotajlo*[1](https://aiimpacts.org/relevant-pre-agi-possibilities/#easy-footnote-bottom-1-2336 \"Many thanks to Katja Grace, Asya Bergal, Rick Korzekwa, Charlie Giattino, Carl Shulman, Max Daniel, Tobias Baumann, and Greg Lewis for comments on drafts.\"), *18 June 2020.*\n\n\n*Epistemic status: I started this as an AI Impacts research project, but given that it’s fundamentally a fun speculative brainstorm, it worked better as a blog post.*\n\n\nThe default, when reasoning about advanced artificial general intelligence (AGI), is to imagine it appearing in a world that is basically like the present. Yet almost everyone agrees the world will likely be importantly different by the time advanced AGI arrives. \n\n\nOne way to address this problem is to reason in abstract, general ways that are hopefully robust to whatever unforeseen developments lie ahead. Another is to brainstorm particular changes that might happen, and check our reasoning against the resulting list.\n\n\n\n\nThis is an attempt to begin the second approach.[2](https://aiimpacts.org/relevant-pre-agi-possibilities/#easy-footnote-bottom-2-2336 \"Both approaches seem valuable to me. Most of the time I do the first approach, so it seemed there might be low-hanging fruit to pick by trying the second.\") I sought things that might happen that seemed both (a) within the realm of plausibility, and (b) probably strategically relevant to AI safety or AI policy.\n\n\n\n\nI collected potential list entries via brainstorming, asking others for ideas, googling, and reading lists that seemed relevant (e.g. Wikipedia’s list of emerging technologies,[3](https://aiimpacts.org/relevant-pre-agi-possibilities/#easy-footnote-bottom-3-2336 \"“List of Emerging Technologies.” In Wikipedia, March 2, 2020. https://en.wikipedia.org/w/index.php?title=List_of_emerging_technologies&oldid=943560081\") a list of Ray Kurzweil’s predictions[4](https://aiimpacts.org/relevant-pre-agi-possibilities/#easy-footnote-bottom-4-2336 \"“Ray Kurzweil’s Mind-Boggling Predictions for the Next 25 Years.” Accessed March 24, 2020. https://singularityhub.com/2015/01/26/ray-kurzweils-mind-boggling-predictions-for-the-next-25-years/\"), and DARPA’s list of projects.[5](https://aiimpacts.org/relevant-pre-agi-possibilities/#easy-footnote-bottom-5-2336 \"“Our Research.” Accessed April 26, 2020. https://www.darpa.mil/our-research?ppl=viewall.\"))\n\n\n\n\nI then shortened the list based on my guesses about the plausibility and relevance of these possibilities. I did not put much time into evaluating any particular possibility, so my guesses should not be treated as anything more. I erred on the side of inclusion, so the entries in this list vary greatly in plausibility and relevance. I made some attempt to categorize these entries and merge similar ones, but this document is fundamentally a brainstorm, not a taxonomy, so keep your expectations low.\n\n\n\n\nI hope to update this post as new ideas find me and old ideas are refined or refuted. I welcome suggestions and criticisms; email me (gmail kokotajlod) or leave a comment.\n\n\n### **Interactive “Generate Future” button**\n\n\nAsya Bergal and I made an interactive button to go with the list. The button randomly generates a possible future according to probabilities that you choose. It is very crude, but it has been fun to play with, and perhaps even slightly useful. For example, once I decided that my credences were probably systematically too high because the futures generated with them were too crazy. Another time I used the alternate method (described below) to recursively generate a detailed future trajectory, [written up here](https://docs.google.com/document/d/1gd6qQx-SP6rfAVQE5rzfPH0zXYOOHXBa13JSUd2zROQ/edit?usp=sharing). I hope to make more trajectories like this in the future, since I think this method is less biased than the usual method for imagining detailed futures.[6](https://aiimpacts.org/relevant-pre-agi-possibilities/#easy-footnote-bottom-6-2336 \"In my experience at least, the usual method is to think about some important feature of the scenario — maybe it’s a slow takeoff, maybe it involves an AI takeover, maybe it involves population-based training — and gradually add details that seem to fit. This often means I fill in the past of my story to justify the present, wheras in the real world the future flows from the past. Moreover I worry that the brain is not good at simulating randomness; if I go down a list of possibilities and mark my credences that each will be realized, and then ask myself to imagine a random future, I doubt very much my ability to randomly sample from the list according to my credences. So I made an app to do it for me.\")\nTo choose probabilities, scroll down to the list below and fill each box with a number representing how likely you think the entry is to occur in a strategically relevant way prior to the advent of advanced AI. (1 means certainly, 0 means certainly not.**The boxes are all 0 by default.**) Once you are done, scroll back up and click the button.\n\n\nA major limitation is that the button doesn’t take correlations between possibilities into account. The user needs to do this themselves, e.g. by redoing any generated future that seems silly, or by flipping a coin to choose between two generated possibilities that seem contradictory, or by choosing between them based on what else was generated.\n\n\nHere is an alternate way to use this button that mostly avoids this limitation:\n\n\n1. Fill all the boxes with probability-of-happening-in-the-next-5-years (instead of happening before advanced AGI, as in the default method)\n2. Click the “Generate Future” button and record the results, interpreted as what happens in the next 5 years.\n3. Update the probabilities accordingly to represent the upcoming 5-year period, in light of what has happened so far.\n4. Repeat steps 2 – 4 until satisfied. I used [a random number generator](https://www.random.org/) to determine whether AGI arrived each year.\n\n\nIf you don’t want to choose probabilities yourself, click “fill with pre-set values” to populate the fields with my non-expert, hasty guesses.[7](https://aiimpacts.org/relevant-pre-agi-possibilities/#easy-footnote-bottom-7-2336 \"This document is a brainstorm of possibilities potentially worth thinking about, not an attempt to quantify how likely they are. I only spent about a few seconds per question estimating these probabilities, and the resolution criteria are ambiguous anyway, so don’t take them seriously. They are there so that people who don’t have time to make their own estimates can at least have fun clicking the button.\")\n\n\nGENERATE FUTURE\n \n\nFill with pre-set values (default method)\n \n\nFill with pre-set values (alternate method)\n\n\n\n\n\n### Key\n\n\nLetters after list titles indicate that I think the change might be relevant to:\n\n\n* TML: Timelines—how long it takes for advanced AI to be developed\n* TAS: Technical AI safety—how easy it is (on a technical level) to make advanced AI safe, or what sort of technical research needs to be done\n* POL: Policy—how easy it is to coordinate relevant actors to mitigate risks from AI, and what policies are relevant to this.\n* CHA: Chaos—how chaotic the world is.[8](https://aiimpacts.org/relevant-pre-agi-possibilities/#easy-footnote-bottom-8-2336 \"This is relevant for several reasons. For example, it might make flexible long-term strategies more valuable relative to strategies that depend on specific predictions. It also might make wars, new ideologies, and shifts in the balance of power more likely.\")\n* MIS: Miscellaneous\n\n\nEach possibility is followed by some explanation or justification where necessary, and a non-exhaustive list of ways the possibility may be relevant to AI outcomes in particular (which is not guaranteed to cover the most important ones). Possibilities are organized into loose categories created after the list was generated. \n\n\n### **List of strategically relevant possibilities**\n\n\n#### Inputs to AI\n\n\n\n1. Advanced science automation and research tools (TML, TAS, CHA, MIS)\n\n\n \n\n \n\nNarrow research and development tools might speed up technological progress in general or in specific domains. For example, several of the other technologies on this list might be achieved with the help of narrow research and development tools.\n\n\n\n2. Dramatically improved computing hardware (TML, TAS, POL, MIS)\n\n\n \n\n \n\nBy this I mean computing hardware improves at least as fast as Moore’s Law. Computing hardware has [historically](https://aiimpacts.org/trends-in-the-cost-of-computing/) become steadily cheaper, though it is unclear [whether this trend will continue](https://aiimpacts.org/2019-recent-trends-in-gpu-price-per-flops/). Some example pathways by which hardware might improve at least moderately include:\n\n\n* Ordinary scale economies[9](https://aiimpacts.org/relevant-pre-agi-possibilities/#easy-footnote-bottom-9-2336 \"Because computing hardware has been improving, it has been designed not to last more than a few years, and the fixed costs of designing and manufacturing are amortized over supply runs of only a few years. Therefore, even if technology stops improving, costs will continue to improve for a while as hardware is redesigned to last longer and fixed costs are amortized over many years. Credit to Carl Shulman for pointing this out.\")\n* Improved data locality[10](https://aiimpacts.org/relevant-pre-agi-possibilities/#easy-footnote-bottom-10-2336 \"By putting memory closer to computing hardware, time and energy can be saved. Cerebras describes a chip under development: “The WSE has 18 GB of on-chip memory, all accessible within a single clock cycle, and provides 9 PB/s memory bandwidth. This is 3000x more capacity and 10,000x greater bandwidth than the leading competitor. More cores with more local memory enables fast, flexible computation, at lower latency and with less energy.” Cerebras. “Product.” Accessed April 26, 2020. https://www.cerebras.net/product/.\")\n* Increased specialization for specific AI applications[11](https://aiimpacts.org/relevant-pre-agi-possibilities/#easy-footnote-bottom-11-2336 \"”When it comes to the compute-intensive field of AI, hardware vendors are reviving the performance gains we enjoyed at the height of Moore’s Law. The gains come from a new generation of specialized chips for AI applications like deep learning.” IEEE Spectrum: Technology, Engineering, and Science News. “Specialized AI Chips Hold Both Promise and Peril for Developers – IEEE Spectrum.” Accessed April 26, 2020. https://spectrum.ieee.org/tech-talk/semiconductors/processors/specialized-ai-chips-hold-both-promise-and-peril-for-developers. “Because of their unique features, AI chips are tens or even thousands of times faster and more efficient than CPUs for training and inference of AI algorithms. State-of-the-art AI chips are also dramatically more cost-effective than state-of-the-art CPUs as a result of their greater efficiency for AI algorithms.” Center for Security and Emerging Technology. “AI Chips: What They Are and Why They Matter.” Accessed June 8, 2020. https://cset.georgetown.edu/research/ai-chips-what-they-are-and-why-they-matter/.\")\n* Optical computing[12](https://aiimpacts.org/relevant-pre-agi-possibilities/#easy-footnote-bottom-12-2336 \"”Fathom Computing is developing high-performance machine learning computers, built to run both training and inference workflows for very-large-scale artificial neural networks. Data movements, not math or logic operations, are the bottleneck in computing. Fathom’s all digital electro-optical architecture focuses innovation precisely in this area, enabling orders of magnitude more data bandwidth at the chip, rack, and warehouse-scale. This high-bandwidth architecture brings ML performance improvements significantly beyond what is possible in electronics-only systems.One of our long-term goals is to build the hardware to train neural networks with the same number of parameters as the human brain has synapses (>100 trillion).” Fathom Computing. “Fathom Computing.” Accessed April 16, 2020. https://www.fathomcomputing.com/.\")\n* Neuromorphic chips[13](https://aiimpacts.org/relevant-pre-agi-possibilities/#easy-footnote-bottom-13-2336 \" “Members of the neuromorphics research community soon discovered that they could take a deep-learning network and run it on their new style of hardware. And they could take advantage of the technology’s power efficiency: The TrueNorth chip, which is the size of a postage stamp and holds a million “neurons,” is designed to use a tiny fraction of the power of a standard processor.” “Neuromorphic Chips Are Destined for Deep Learning—or Obscurity – ” IEEE Spectrum: Technology, Engineering, and Science News. Accessed April 26, 2020. https://spectrum.ieee.org/semiconductors/design/neuromorphic-chips-are-destined-for-deep-learningor-obscurity.\")\n* 3D integrated circuits[14](https://aiimpacts.org/relevant-pre-agi-possibilities/#easy-footnote-bottom-14-2336 \"”While traditional CMOS scaling processes improves signal propagation speed, scaling from current manufacturing and chip-design technologies is becoming more difficult and costly, in part because of power-density constraints, and in part because interconnects do not become faster while transistors do.[13] 3D ICs address the scaling challenge by stacking 2D dies and connecting them in the 3rd dimension. This promises to speed up communication between layered chips, compared to planar layout.”“Three-Dimensional Integrated Circuit.” In Wikipedia, April 14, 2020. https://en.wikipedia.org/w/index.php?title=Three-dimensional_integrated_circuit&oldid=950952374.\")\n* Wafer-scale chips[15](https://aiimpacts.org/relevant-pre-agi-possibilities/#easy-footnote-bottom-15-2336 \" According to Cerebras Systems, “A single CS-1 delivers orders of magnitude greater deep learning performance than a graphics processor. As such, far fewer CS-1 systems are needed to achieve the same effective compute as large-scale cluster deployments of traditional machines.” Cerebras. “Product.” Accessed April 26, 2020. https://www.cerebras.net/product/.\")\n* Quantum computing[16](https://aiimpacts.org/relevant-pre-agi-possibilities/#easy-footnote-bottom-16-2336 \"”We think quantum computing will help us develop the innovations of tomorrow, including AI.” From Google Research page, accessed online April 16, 2020. https://research.google/teams/applied-science/quantum/\")\n* Carbon nanotube field-effect transistors[17](https://aiimpacts.org/relevant-pre-agi-possibilities/#easy-footnote-bottom-17-2336 \"“According to Moore’s law, the dimensions of individual devices in an integrated circuit have been decreased by a factor of approximately two every two years. This scaling down of devices has been the driving force in technological advances since the late 20th century. However, as noted by ITRS 2009 edition, further scaling down has faced serious limits related to fabrication technology and device performances as the critical dimension shrunk down to sub-22 nm range.[3] The limits involve electron tunneling through short channels and thin insulator films, the associated leakage currents, passive power dissipation, short channel effects, and variations in device structure and doping.[4] These limits can be overcome to some extent and facilitate further scaling down of device dimensions by modifying the channel material in the traditional bulk MOSFET structure with a single carbon nanotube or an array of carbon nanotubes.” “Carbon Nanotube Field-Effect Transistor.” In Wikipedia, March 30, 2020.https://en.wikipedia.org/w/index.php?title=Carbon_nanotube_field-effect_transistor&oldid=948242190 \")\n\n\nDramatically improved computing hardware may: \n\n\n* Cause any given AI capability to arrive earlier\n* Increase the probability of [hardware overhang](https://aiimpacts.org/hardware-overhang/).\n* Affect which kinds of AI are developed first (e.g. those which are more compute-intensive.)\n* Affect AI policy, e.g. by changing the relative importance of hardware vs. research talent\n\n\n\n3. Stagnation in computing hardware progress (TML, TAS, POL, MIS)\n\n\n \n\n \n\nMany forecasters think Moore’s Law will be ending soon (as of 2020).[18](https://aiimpacts.org/relevant-pre-agi-possibilities/#easy-footnote-bottom-18-2336 \"”Most forecasters, including Gordon Moore,[153] expect Moore’s law will end by around 2025.[154][155][156]” “Moore’s Law.” In Wikipedia, April 16, 2020. https://en.wikipedia.org/w/index.php?title=Moore%27s_law&oldid=951366634.\") In the absence of successful new technologies, computing hardware could progress substantially more slowly than Moore’s Law would predict.\n\n\nStagnation in computing hardware progress may: \n\n\n* Cause any given AI capability to arrive later\n* Decrease the probability of [hardware overhang](https://aiimpacts.org/hardware-overhang/).\n* Affect which kinds of AI are developed first (e.g. those which are less compute-intensive.)\n* Influence the relative strategic importance of hardware compared to researchers\n* Make energy and raw materials a greater part of the cost of computing\n\n\n\n4. Manufacturing consolidation (POL)\n\n\n \n\n \n\nChip fabrication has become more specialized and consolidated over time, to the point where all of the hardware relevant to AI research depends on production from a handful of locations.[19](https://aiimpacts.org/relevant-pre-agi-possibilities/#easy-footnote-bottom-19-2336 \" “Fixed costs increasing faster than variable costs has created higher barriers of entry, squeezing fab profits and shrinking the number of chipmakers operating fabs at the leading nodes.” “AI-Chips%E2%80%94What-They-Are-and-Why-They-Matter.Pdf.” Accessed April 17, 2020. https://cset.georgetown.edu/ai-chips/. ”The fact that the complex supply chains needed to produce leading-edge AI chips are concentrated in the United States and a small number of allied democracies provides an opportunity for export control policies.” Center for Security and Emerging Technology. “AI Chips: What They Are and Why They Matter.” Accessed June 8, 2020. https://cset.georgetown.edu/research/ai-chips-what-they-are-and-why-they-matter/.\") Perhaps this trend will continue.\n\n\nOne country (or a small number working together) could control or restrict AI research by controlling the production and distribution of necessary hardware.\n\n\n\n5. Advanced additive manufacturing (e.g. 3D printing or nanotechnology) (TML, CHA)\n\n\n \n\n \n\nAdvanced additive manufacturing could lead to various materials, products and forms of capital being cheaper and more broadly accessible, as well as to new varieties of them becoming feasible and quicker to develop. For example, sufficiently advanced 3D printing could destabilize the world by allowing almost anyone to secretly produce terror weapons. If nanotechnology advances rapidly, so that nanofactories can be created, the consequences could be dramatic:[20](https://aiimpacts.org/relevant-pre-agi-possibilities/#easy-footnote-bottom-20-2336 \"“Nanofactories.” Accessed April 16, 2020. https://foresight.org/nano/nanofactories.html.\") \n\n\n* Greatly reduced cost of most manufactured products\n* Greatly faster growth of capital formation\n* Lower energy costs\n* New kinds of materials, such as stronger, lighter spaceship hulls\n* Medical nanorobots\n* New kinds of weaponry and other disruptive technologies\n\n\n\n6. Massive resource glut (TML, TAS, POL, CHA)\n\n\n \n\n \n\nBy “glut” I don’t necessarily mean that there is too much of a resource. Rather, I mean that the real price falls dramatically. Rapid decreases in the price of important resources have happened before.[21](https://aiimpacts.org/relevant-pre-agi-possibilities/#easy-footnote-bottom-21-2336 \"Many times in the past, resources which were once expensive became cheap, sometimes very quickly. For example, Aluminum went from $12/lb to $0.78/lb in 13 years. “And the price of aluminum began to drop, from $12 a pound in 1880, to $4.86 in 1888, to 78 cents in 1893 to, by the 1930s, just 20 cents a pound.” Laskow, Sarah. “Aluminum Was Once One of the Most Expensive Metals in the World.” The Atlantic, November 7, 2014.https://www.theatlantic.com/technology/archive/2014/11/aluminum-was-once-one-of-the-most-expensive-metals-in-the-world/382447/. \") It could happen again via:\n\n\n* Cheap energy (e.g. fusion power, He-3 extracted from lunar regolith,[22](https://aiimpacts.org/relevant-pre-agi-possibilities/#easy-footnote-bottom-22-2336 \"”Cosmochemist and geochemist Ouyang Ziyuan from the Chinese Academy of Sciences who is now in charge of the Chinese Lunar Exploration Program has already stated on many occasions that one of the main goals of the program would be the mining of helium-3, from which operation “each year, three space shuttle missions could bring enough fuel for all human beings across the world.”” “Helium-3.” In Wikipedia, April 18, 2020. https://en.wikipedia.org/w/index.php?title=Helium-3&oldid=951699417.\") methane hydrate extracted from the seafloor,[23](https://aiimpacts.org/relevant-pre-agi-possibilities/#easy-footnote-bottom-23-2336 \"”This source of carbon, the most abundant in the world, may be one of the last new forms of fossil fuel to be extracted on a commercial scale.”Henriques, Martha. “Why ‘Flammable Ice’ Could Be the Future of Energy.” Accessed April 26, 2020. https://www.bbc.com/future/article/20181119-why-flammable-ice-could-be-the-future-of-energy.\") cheap solar energy[24](https://aiimpacts.org/relevant-pre-agi-possibilities/#easy-footnote-bottom-24-2336 \" Roberts, David. “The Falling Costs of US Solar Power, in 7 Charts.” Vox, August 24, 2016. https://www.vox.com/2016/8/24/12620920/us-solar-power-costs-falling. \"))\n* A source of abundant cheap raw materials (e.g. asteroid mining,[25](https://aiimpacts.org/relevant-pre-agi-possibilities/#easy-footnote-bottom-25-2336 \" “The “gold at the end of the rainbow,” he added, is the extraction and exploitation of platinum-group metals, which are rare here on Earth but are extremely important in the manufacture of electronics and other high-tech goods.” August 11, Mike Wall, and 2015. “Asteroid Mining May Be a Reality by 2025.” Space.com. Accessed April 26, 2020. https://www.space.com/30213-asteroid-mining-planetary-resources-2025.html.\") undersea mining[26](https://aiimpacts.org/relevant-pre-agi-possibilities/#easy-footnote-bottom-26-2336 \" Hylton, Story by Wil S. “History’s Largest Mining Operation Is About to Begin.” The Atlantic. Accessed April 26, 2020. https://www.theatlantic.com/magazine/archive/2020/01/20000-feet-under-the-sea/603040/. \"))\n* Automation of relevant human labor. Where human labor is an important part of the cost of manufacturing, resource extraction, or energy production, automating labor might substantially increase economic growth, which might result in a greater amount of resources devoted to strategically relevant things (such as AI research) which is relevantly similar to a price drop even if technically the price doesn’t drop.[27](https://aiimpacts.org/relevant-pre-agi-possibilities/#easy-footnote-bottom-27-2336 \"”These models also suggest that wholesale use of machine intelligence could increase economic growth rates by an order of magnitude or more. These increased growth rates are due to our assumptions that computer technology improves faster than general technology, and that the labor population of machine intelligences could grow as fast as desired to meet labor demand.” Hanson, Robin (2001), “Economic growth given machine intelligence,” Technical Report, University of California, Berkeley. https://www.economicsofai.com/economic-growth \") and therefore investment in AI.\n\n\nMy impression is that energy, raw materials, and unskilled labor combined are less than half the cost of computing, so a decrease in the price of one of these (and possibly even all three) would probably not have large direct consequences on the price of computing.[28](https://aiimpacts.org/relevant-pre-agi-possibilities/#easy-footnote-bottom-28-2336 \"An unofficial analysis claims that computing hardware makes up 57% of the cost of running a data center, with the remainder being energy, cooling, networking equipment, and other infrastructure. This was based on using the hardware for three years, and the infrastructure for ten years. “Overall Data Center Costs – Perspectives.” Accessed April 30, 2020. https://perspectives.mvdirona.com/2010/09/overall-data-center-costs/. I do not know what the cost breakdown is for computing hardware but I imagine it involves lots of skilled labor to design the chips and chip fabs.\") But a resource glut might lead to general economic prosperity, with many subsequent effects on society, and moreover the cost structure of computing may change in the future, creating a situation where a resource glut could dramatically lower the cost of computing.[29](https://aiimpacts.org/relevant-pre-agi-possibilities/#easy-footnote-bottom-29-2336 \"For example, energy efficiency improvements may fail to keep up with other improvements, or progress in computing hardware technology might stagnate. In either scenario, skilled labor and capital could become less important relative to energy, unskilled labor, and materials. Thus a resource glut could potentially have a large effect on computing costs.\")\n\n7. Hardware overhang (TML, TAS, POL)\n\n\n \n\n \n\n[Hardware overhang](https://aiimpacts.org/hardware-overhang/) refers to a situation where large quantities of computing hardware can be diverted to running powerful AI systems as soon as the AI software is developed.\n\n\nIf advanced AGI (or some other powerful software) appears during a period of hardware overhang, its capabilities and prominence in the world could grow very quickly.\n\n\n\n8. Hardware underhang (TML, TAS, POL)\n\n\n \n\n \n\nThe opposite of hardware overhang might happen. Researchers may understand how to build advanced AGI at a time when the requisite hardware is not yet available. For example, perhaps the relevant AI research will involve expensive chips custom-built for the particular AI architecture being trained.\n\n\nA successful AI project during a period of hardware underhang would not be able to instantly copy the AI to many other devices, nor would they be able to iterate quickly and make an architecturally improved version.\n\n\n#### Technical tools\n\n\n\n9. Prediction tools (TML, TAS, POL, CHA, MIS)\n\n\n \n\n \n\nTools may be developed that are dramatically better at predicting some important aspect of the world; for example, technological progress, cultural shifts, or the outcomes of elections, military clashes, or research projects. Such tools could for instance be based on advances in AI or other algorithms, prediction markets, or improved scientific understanding of forecasting (e.g. [lessons from the Good Judgment Project](https://aiimpacts.org/evidence-on-good-forecasting-practices-from-the-good-judgment-project/)).\n\n\nSuch tools might conceivably increase stability via promoting accurate beliefs, reducing surprises, errors or unnecessary conflicts. However they could also conceivably promote instability via conflict encouraged by a powerful new tool being available to a subset of actors. Such tools might also help with forecasting the arrival and effects of advanced AGI, thereby helping guide policy and AI safety work. They might also accelerate timelines, for instance by assisting project management in general and notifying potential investors when advanced AGI is within reach.\n\n\n\n10. Persuasion tools (POL, CHA, MIS)\n\n\n \n\n \n\nPresent technology for influencing a person’s beliefs and behavior is crude and weak, relative to what one can imagine. Tools may be developed that more reliably steer a person’s opinion and are not so vulnerable to the victim’s reasoning and possession of evidence. These could involve:\n\n\n* Advanced understanding of how humans respond to stimuli depending on context, based on massive amounts of data\n* Coaching for the user on how to convince the target of something\n* Software that interacts directly with other people, e.g. via text or email\n\n\nStrong persuasion tools could:\n\n\n* Allow a group in conflict who has them to quickly attract spies and then infiltrate an enemy group\n* Allow governments to control their populations\n* Allow corporations to control their employees\n* Lead to a breakdown of collective epistemology[30](https://aiimpacts.org/relevant-pre-agi-possibilities/#easy-footnote-bottom-30-2336 \"For instance if people’s opinions become divorced from reality at a large scale it might become hard for public discourse and institutions to support good policy making. See below.\")\n\n\n\n11. Theorem provers (TAS)\n\n\n \n\n \n\nPowerful theorem provers might help with the kinds of AI alignment research that involve proofs or help solve computational choice problems.\n\n\n\n12. Narrow AI for natural language processing (TML, TAS, CHA)\n\n\n \n\n \n\nResearchers may develop narrow AI that understands human language well, including concepts such as “moral” and “honest.”\n\n\nNatural language processing tools could help with many kinds of technology, including AI and various AI safety projects. They could also help enable AI arbitration systems. If researchers develop software that can autocomplete code—much as it currently autocompletes text messages—it could multiply software engineering productivity.\n\n\n\n13. AI interpretability tools (TML, TAS, POL)\n\n\n \n\n \n\nTools for understanding what a given AI system is thinking, what it wants, and what it is planning would be useful for AI safety.[31](https://aiimpacts.org/relevant-pre-agi-possibilities/#easy-footnote-bottom-31-2336 \"Even weak versions of these tools might be useful. Olah et al describe a weak yet promising version of this sort of tool. Olah, Chris, Nick Cammarata, Ludwig Schubert, Gabriel Goh, Michael Petrov, and Shan Carter. “Zoom In: An Introduction to Circuits.” Distill 5, no. 3 (March 10, 2020): e00024.001. https://doi.org/10.23915/distill.00024.001 \")\n\n14. Credible commitment mechanisms (POL, CHA)\n\n\n\n \n\n \n\nThere are significant restrictions on which contracts governments are willing and able to enforce–for example, they can’t enforce a contract to try hard to achieve a goal, and won’t enforce a contract to commit a crime. Perhaps some technology (e.g. lie detectors, narrow AI, or blockchain) could significantly expand the space of possible credible commitments for some relevant actors: corporations, decentralized autonomous organizations, crowds of ordinary people using assurance contracts, terrorist cells, rogue AGIs, or even individuals.\n\n\nThis might destabilize the world by making threats of various kinds more credible, for various actors. It might stabilize the world in other ways, e.g. by making it easier for some parties to enforce agreements.\n\n\n\n15. Better coordination tools (POL, CHA, MIS)\n\n\n \n\n \n\nTechnology for allowing groups of people to coordinate effectively could improve, potentially avoiding losses from collective choice problems, helping existing large groups (e.g. nations and companies) to make choices in their own interests, and producing new forms of coordinated social behavior (e.g. the 2010’s saw the rise of the Facebook group)). Dominant assurance contracts,[32](https://aiimpacts.org/relevant-pre-agi-possibilities/#easy-footnote-bottom-32-2336 \"An explanation and real-life example can be found in Economics, and Political Science. “A Test of Dominant Assurance Contracts.” Marginal REVOLUTION, August 29, 2013. https://marginalrevolution.com/marginalrevolution/2013/08/a-test-of-dominant-assurance-contracts.html.\") improved voting systems,[33](https://aiimpacts.org/relevant-pre-agi-possibilities/#easy-footnote-bottom-33-2336 \"For a comparison of different voting systems, see wikipedia. “Comparison of Electoral Systems.” In Wikipedia, March 31, 2020. https://en.wikipedia.org/w/index.php?title=Comparison_of_electoral_systems&oldid=948343913.\") AI arbitration systems, lie detectors, and similar things not yet imagined might significantly improve the effectiveness of some groups of people.\n\n\nIf only a few groups use this technology, they might have outsized influence. If most groups do, there could be a general reduction in conflict and increase in good judgment.\n\n\n#### Human effectiveness\n\n\n\n16. Deterioration of collective epistemology (TML, TAS, POL, CHA, MIS)\n\n\n \n\n \n\nSociety has mechanisms and processes that allow it to identify new problems, discuss them, and arrive at the truth and/or coordinate a solution. These processes might deteriorate. Some examples of things which might contribute to this:\n\n\n* Increased investment in online propaganda by more powerful actors, perhaps assisted by chatbots, deepfakes and persuasion tools\n* Echo chambers, filter bubbles, and online polarization, perhaps driven in part by recommendation algorithms\n* Memetic evolution in general might intensify, increasing the spreadability of ideas/topics at the expense of their truth/importance[34](https://aiimpacts.org/relevant-pre-agi-possibilities/#easy-footnote-bottom-34-2336 \"See: Extremal Goodhart, from “Goodhart Taxonomy – LessWrong 2.0.” Accessed April 17, 2020 https://www.lesswrong.com/posts/EbFABnst8LsidYs5Y/goodhart-taxonomy.\")\n* Trends towards political polarization and radicalization might exist and continue\n* Trends towards general institutional dysfunction might exist and continue\n\n\nThis could cause chaos in the world in general, and lead to many hard-to-predict effects. It would likely make the market for influencing the course of AI development less efficient (see section on “Landscape of…” below) and present epistemic hazards for anyone trying to participate effectively.\n\n\n\n17. New and powerful forms of addiction (TML, POL, CHA, MIS)\n\n\n \n\n \n\nTechnology that wastes time and ruins lives could become more effective. The average person spends 144 minutes per day on social media, and there is a clear upward trend in this metric.[35](https://aiimpacts.org/relevant-pre-agi-possibilities/#easy-footnote-bottom-35-2336 \" BroadbandSearch.net. “Average Time Spent Daily on Social Media (Latest 2020 Data).” Accessed April 28, 2020. https://cdn.broadbandsearch.net/blog/average-daily-time-on-social-media. \") The average time spent watching TV is even greater.[36](https://aiimpacts.org/relevant-pre-agi-possibilities/#easy-footnote-bottom-36-2336 \" BroadbandSearch.net. “Average Time Spent Daily on Social Media (Latest 2020 Data).” Accessed April 28, 2020. https://cdn.broadbandsearch.net/blog/average-daily-time-on-social-media. \") Perhaps this time is not wasted but rather serves some important recuperative, educational, or other function. Or perhaps not; perhaps instead the effect of social media on society is like the effect of a new addictive drug — opium, heroin, cocaine, etc. — which causes serious damage until society adapts. Maybe there will be more things like this: extremely addictive video games, or newly invented drugs, or wireheading (directly stimulating the reward circuitry of the brain).[37](https://aiimpacts.org/relevant-pre-agi-possibilities/#easy-footnote-bottom-37-2336 \"“Wirehead (Science Fiction).” In Wikipedia, April 9, 2020. https://en.wikipedia.org/w/index.php?title=Wirehead_(science_fiction)&oldid=949912810.\")\nThis could lead to economic and scientific slowdown. It could also concentrate power and influence in fewer people—those who for whatever reason remain relatively unaffected by the various productivity-draining technologies. Depending on how these practices spread, they might affect some communities more or sooner than others.\n\n\n\n18. Medicine or education to boost human mental abilities (TML, CHA, MIS)\n\n\n \n\n \n\nTo my knowledge, existing “study drugs” such as modafinil don’t seem to have substantially sped up the rate of scientific progress in any field. However, new drugs (or other treatments) might be more effective. Moreover, in some fields, researchers typically do their best work at a certain age. Medicine which extends this period of peak mental ability might have a similar effect.\n\n\nSeparately, there may be substantial room for improvement in education due to big data, online classes, and tutor software.[38](https://aiimpacts.org/relevant-pre-agi-possibilities/#easy-footnote-bottom-38-2336 \"For example, there is at least some evidence that two standard deviations of performance improvement results from good one-on-one instruction, and at least one experiment suggests that good tutor software can quickly train people to be better than the average expert! “The Digital Tutor students outperformed traditionally taught students and field experts in solving IT problems on the final assessment. They did not merely meet the goal of being as good after 16 weeks as experts in the field, but they actually outperformed them.” “DARPA Digital Tutor: Four Months to Total Technical Expertise? – LessWrong 2.0.” Accessed July 9, 2020. https://www.lesswrong.com/posts/vbWBJGWyWyKyoxLBe/darpa-digital-tutor-four-months-to-total-technical-expertise. “Bloom’s 2 Sigma Problem.” In Wikipedia, June 25, 2020. https://en.wikipedia.org/w/index.php?title=Bloom%27s_2_sigma_problem&oldid=964499386.\")\nThis could speed up the rate of scientific progress in some fields, among other effects.\n\n\n\n19. Genetic engineering, human cloning, iterated embryo selection (TML, POL, CHA, MIS)\n\n\n\n \n\n \n\nChanges in human capabilities or other human traits via genetic interventions[39](https://aiimpacts.org/relevant-pre-agi-possibilities/#easy-footnote-bottom-39-2336 \"Genetic engineering and large-mammal cloning have already been demonstrated, so may plausibly be applied to humans at some point. For a scholarly argument for the feasibility of iterated embryo selection, see Bostrom, Nick and Shulman, Carl. Embryo Selection for Cognitive Enhancement: Curiosity or Game Changer? Global Policy, Vol. 5, Iss. 1 (2014): 85–92 http://www.nickbostrom.com/papers/embryo.pdf![]() and Branwen, Gwern. “Embryo Selection For Intelligence,” January 22, 2016. https://www.gwern.net/Embryo-selection.\") could affect many areas of life. If the changes were dramatic, they might have a large impact even if only a small fraction of humanity were altered by them. \n\n\nChanges in human capabilities or other human traits via genetic interventions might:\n\n\n* Accelerate research in general\n* Differentially accelerate research projects that depend more on “genius” and less on money or experience\n* Influence politics and ideology\n* Cause social upheaval\n* Increase the number of people capable of causing great harm\n* Have a huge variety of effects not considered here, given the ubiquitous relevance of human nature to events\n* Shift the landscape of effective strategies for influencing AI development (see below)\n\n\n\n20. Landscape of effective strategies for influencing AI development changes substantially (CHA, MIS)\n\n\n \n\n \n\nFor a person at a time, there is a landscape of strategies for influencing the world, and in particular for influencing AI development and the effects of advanced AGI. The landscape could change such that the most effective strategies for influencing AI development are:\n\n\n* More or less reliably helpful (e.g. working for an hour on a major unsolved technical problem might have a low chance of a very high payoff, and so not be very reliable)\n* More or less “outside the box” (e.g. being an employee, publishing academic papers, and signing petitions are normal strategies, whereas writing Harry Potter fanfiction to illustrate rationality concepts and inspire teenagers to work on AI safety is not)[40](https://aiimpacts.org/relevant-pre-agi-possibilities/#easy-footnote-bottom-40-2336 \"Harry Potter and the Methods of Rationality, written by Eliezer Yudkowsky in the early 2010s, anecdotally brought many people into the ai risk community. As of 2020 it is the most popular harry potter fanfiction of all time according to fanfiction.net.“Harry Potter FanFiction Archive | FanFiction.” Accessed April 27, 2020. https://www.fanfiction.net/book/Harry-Potter/?&srt=3&r=103. \")\n* Easier or harder to find, such that marginal returns to investment in strategy research change\n\n\nHere is a non-exhaustive list of reasons to think these features might change systematically over time:\n\n\n* As more people devote more effort to achieving some goal, one might expect that effective strategies become common, and it becomes harder to find novel strategies that perform better than common strategies. As advanced AI becomes closer, one might expect more effort to flow into influencing the situation. Currently some ‘markets’ are more efficient than others; in some the orthodox strategies are best or close to the best, whereas in others clever and careful reasoning can find strategies vastly better than what most people do. How efficient a market is depends on how many people are genuinely trying to compete in it, and how accurate their beliefs are. For example, the stock market and the market for political influence are fairly efficient, because many highly-knowledgeable actors are competing. As more people take interest, the ‘market’ for influencing the course of AI may become more efficient. (This would also decrease the marginal returns to investment in strategy research, by making orthodox strategies closer to optimal.) If there is a deterioration of social epistemology (see below), the market might instead become less efficient.\n* Currently there are some tasks at which the most skilled people are not much better than the average person (e.g. manual labor, voting) and others in which the distribution of effectiveness is heavy-tailed, such that a large fraction of the total influence comes from a small fraction of individuals (e.g. theoretical math, donating to politicians). The types of activity that are most useful for influencing the course of AI development may change over time in this regard, which in turn might affect the strategy landscape in all three ways described above.\n* Transformative technologies can lead to new opportunities and windfalls for people who recognize them early. As more people take interest, opportunities for easy success disappear. Perhaps there will be a burst of new technologies prior to advanced AGI, creating opportunities for unorthodox or risky strategies to be very successful.\n\n\nA shift in the landscape of effective strategies for influencing the course of AI is relevant to anyone who wants to have an effective strategy for influencing the course of AI.[41](https://aiimpacts.org/relevant-pre-agi-possibilities/#easy-footnote-bottom-41-2336 \"This talk and this post discuss some dimensions of this landscape and explain why it is important to think about. “Some Cruxes on Impactful Alternatives to AI Policy Work – EA Forum.” Accessed April 16, 2020. https://forum.effectivealtruism.org/posts/DW4FyzRTfBfNDWm6J/some-cruxes-on-impactful-alternatives-to-ai-policy-work. Effective Altruism. “Prospecting for Gold.” Accessed April 16, 2020. https://www.effectivealtruism.org/articles/prospecting-for-gold-owen-cotton-barratt/.\") If it is part of a more general shift in the landscape of effective strategies for other goals — e.g. winning wars, making money, influencing politics — the world could be significantly disrupted in ways that may be hard to predict.\n\n\n\n21. Global economic collapse (TML, CHA, MIS)\n\n\n \n\n \n\nThis might slow down research or precipitate other relevant events, such as war.\n\n\n\n22. Scientific stagnation (TML, TAS, POL, CHA, MIS)\n\n\n \n\n \n\nThere is some evidence that scientific progress in general might be slowing down. For example, the millennia-long trend of decreasing economic doubling time seems to have stopped around 1960.[42](https://aiimpacts.org/relevant-pre-agi-possibilities/#easy-footnote-bottom-42-2336 \"See the first graph in Alexander, Scott. “1960: The Year The Singularity Was Cancelled.” Slate Star Codex, April 23, 2019. https://slatestarcodex.com/2019/04/22/1960-the-year-the-singularity-was-cancelled/. \") Meanwhile, scientific progress has arguably come from increased investment in research. Since research investment has been growing faster than the economy, it might eventually saturate and grow only as fast as the economy.[43](https://aiimpacts.org/relevant-pre-agi-possibilities/#easy-footnote-bottom-43-2336 \"”We present a wide range of evidence from various industries, products, and firms showing that research effort is rising substantially while research productivity is declining sharply.” Bloom, Nicholas, Charles I Jones, John Van Reenen, and Michael Webb. “Are Ideas Getting Harder to Find?” Working Paper. Working Paper Series. National Bureau of Economic Research, September 2017. https://doi.org/10.3386/w23782. \")\nThis might slow down AI research, making the events on this list (but not the technologies) more likely to happen before advanced AGI.\n\n\n\n23. Global catastrophe (TML, POL, CHA)\n\n\n \n\n \n\nHere are some examples of potential global catastrophes:\n\n\n* Climate change tail risks, e.g. feedback loop of melting permafrost releasing methane[44](https://aiimpacts.org/relevant-pre-agi-possibilities/#easy-footnote-bottom-44-2336 \"See here for an overview of such risks.GiveWell. “Extreme Risks from Climate Change.” Accessed April 17, 2020. https://www.givewell.org/shallow/climate-change/extreme-risks.\")\n* Major nuclear exchange\n* Global pandemic\n* Volcano eruption that leads to 10% reduction in global agricultural production[45](https://aiimpacts.org/relevant-pre-agi-possibilities/#easy-footnote-bottom-45-2336 \"See here for some arguments and sources about the likelihood of 10% reductions in global agricultural production, e.g. from volcanos. “Should We Be Spending No Less on Alternate Foods than AI Now? – EA Forum.” Accessed April 17, 2020. https://forum.effectivealtruism.org/posts/7XRjb3Tx8j36AcBpb/should-we-be-spending-no-less-on-alternate-foods-than-ai-now.\")\n* Exceptionally bad solar storm knocks out world electrical grid[46](https://aiimpacts.org/relevant-pre-agi-possibilities/#easy-footnote-bottom-46-2336 \"From Wikipedia: “In June 2013, a joint venture from researchers at Lloyd’s of London and Atmospheric and Environmental Research (AER) in the United States used data from the Carrington Event to estimate the current cost of a similar event to the U.S. alone at $0.6–2.6 trillion.[2]” “Solar Storm of 1859.” In Wikipedia, April 16, 2020. https://en.wikipedia.org/w/index.php?title=Solar_storm_of_1859&oldid=951346360.\")\n* Geoengineering project backfires or has major negative side-effects[47](https://aiimpacts.org/relevant-pre-agi-possibilities/#easy-footnote-bottom-47-2336 \"From Wikipedia: “There may be unintended climatic consequences of solar radiation management, such as significant changes to the hydrological cycle[24][25][26] that might not be predicted by the models used to plan them.[22] Such effects may be cumulative or chaotic in nature.[27] Ozone depletion is a risk of techniques involving sulfur delivery into the stratosphere.[28]” “Solar Radiation Management.” In Wikipedia, April 16, 2020. https://en.wikipedia.org/w/index.php?title=Solar_radiation_management&oldid=951302439.\")\n\n\nA global catastrophe might be expected to cause conflict and slowing of projects such as research, though it could also conceivably increase attention on projects that are useful for dealing with the problem. It seems likely to have other hard to predict effects.\n\n\n#### Attitudes toward AGI\n\n\n\n24. Shift in level of public attention on AGI (TML, POL, CHA, MIS)\n\n\n\n \n\n \n\nThe level of attention paid to AGI by the public, governments, and other relevant actors might increase (e.g. due to an impressive demonstration or a bad accident) or decrease (e.g. due to other issues drawing more attention, or evidence that AI is less dangerous or imminent).\n\n\nChanges in the level of attention could affect the amount of work on AI and AI safety. More attention could also lead to changes in public opinion such as panic or an AI rights movement. \n\n\nIf the level of attention increases but AGI does not arrive soon thereafter, there might be a subsequent period of disillusionment.\n\n\n\n25. Change in investment in AGI development (TML, TAS, POL)\n\n\n \n\n \n\nThere could be a rush for AGI, for instance if major nations begin megaprojects to build it. Or there could be a rush away from AGI, for instance if it comes to be seen as immoral or dangerous like human cloning or nuclear rocketry. \n\n\nIncreased investment in AGI might make advanced AGI happen sooner, with less [hardware overhang](https://aiimpacts.org/hardware-overhang/) and potentially less proportional investment in safety. Decreased investment might have the opposite effects.\n\n\n\n26. New social movements or ideological shifts (TML, TAS, POL, MIS)\n\n\n \n\n \n\nThe communities that build and regulate AI could undergo a substantial ideological shift.Historically, entire nations have been swept by radical ideologies within about a decade or so, e.g. Communism, Fascism, the Cultural Revolution, and the First Great Awakening.[48](https://aiimpacts.org/relevant-pre-agi-possibilities/#easy-footnote-bottom-48-2336 \" “Cultural Revolution.” In Wikipedia, April 23, 2020. https://en.wikipedia.org/w/index.php?title=Cultural_Revolution&oldid=952680930. “First Great Awakening.” In Wikipedia, April 8, 2020. https://en.wikipedia.org/w/index.php?title=First_Great_Awakening&oldid=949753276.\") Major ideological shifts within communities smaller than nations (or within nations, but on specific topics) presumably happen more often. There might even appear powerful social movements explicitly focused on AI, for instance in opposition to it or attempting to secure legal rights and moral status for AI agents.[49](https://aiimpacts.org/relevant-pre-agi-possibilities/#easy-footnote-bottom-49-2336 \"For an example of someone trying to secure legal rights for artificial intelligences, see this document in which the US patent office denies someone’s request to have the patent granted to their AI, stating that “Lastly, petitioner has outlined numerous policy considerations to support the position that a patent application can name a machine as inventor … These policy considerations notwithstanding, they do not overcome the plain language of the patent laws as passed by the Congress and interpreted by the courts.” From the first PDF linked in this news article: CNN, AJ Willingham. “Artificial Intelligence Can’t Technically Invent Things, Says Patent Office.” CNN. Accessed April 30, 2020. https://www.cnn.com/2020/04/30/us/artificial-intelligence-inventing-patent-office-trnd/index.html. \") Finally, there could be a general rise in extremist movements, for instance due to a symbiotic feedback effect hypothesized by some,[50](https://aiimpacts.org/relevant-pre-agi-possibilities/#easy-footnote-bottom-50-2336 \"Polar opposite political movements can arguably sometimes be symbiotes; each one gains power and followers by claiming to be a proportional and necessary response to the dire threat posed by the other. For some arguments to this effect, see here and here. Illing, Sean. “Reciprocal Rage: Why Islamist Extremists and the Far Right Need Each Other.” Vox, December 19, 2017. https://www.vox.com/world/2017/12/19/16764046/islam-terrorism-far-right-extremism-isis. “The Toxoplasma Of Rage | Slate Star Codex.” Accessed April 17, 2020. https://slatestarcodex.com/2014/12/17/the-toxoplasma-of-rage/.\") which might have strategically relevant implications even if mainstream opinions do not change.\n\n\nChanges in public opinion on AI might change the speed of AI research, change who is doing it, change which types of AI are developed or used, and limit or alter discussion. For example, attempts to limit an AI system’s effects on the world by containing it might be seen as inhumane, as might adversarial and population-based training methods. Broader ideological change or a rise in extremisms might increase the probability of a massive crisis, revolution, civil war, or world war.\n\n\n\n27. Harbinger of AGI (ALN, POL, MIS)\n\n\n \n\n \n\nEvents could occur that provide compelling evidence, to at least a relevant minority of people, that advanced AGI is near.\n\n\nThis could increase the amount of technical AI safety work and AI policy work being done, to the extent that people are sufficiently well-informed and good at forecasting. It could also enable people already doing such work to more efficiently focus their efforts on the true scenario.\n\n\n\n28. AI alignment warning shot (ALN, POL)\n\n\n \n\n \n\nA convincing real-world example of AI alignment failure could occur.\n\n\nThis could motivate more effort into mitigating AI risk and perhaps also provide useful evidence about some kinds of risks and how to avoid them.\n\n\n#### Precursors to AGI\n\n\n\n29. Brain scanning (TML, TAS, POL, CHA, MIS)\n\n\n \n\n \n\nAn accurate way to scan human brains at a very high resolution could be developed.\n\n\nCombined with a good low-level understanding of the brain (see below) and sufficient computational resources, this might enable brain emulations, a form of AGI in which the AGI is similar, mentally, to some original human. This would change the kind of technical AI safety work that would be relevant, as well as introducing new AI policy questions. It would also likely make AGI timelines easier to predict. It might influence takeoff speeds.\n\n\n\n30. Good low-level understanding of the brain (TML, TAS, POL, CHA, MIS)\n\n\n \n\n \n\nTo my knowledge, as of April 2020, humanity does not understand how neurons work well enough to accurately simulate the behavior of a C. Elegans worm, though all connections between its neurons have been mapped[51](https://aiimpacts.org/relevant-pre-agi-possibilities/#easy-footnote-bottom-51-2336 \"Cook, Steven J., Travis A. Jarrell, Christopher A. Brittin, Yi Wang, Adam E. Bloniarz, Maksim A. Yakovlev, Ken C. Q. Nguyen, et al. “Whole-Animal Connectomes of Both Caenorhabditis Elegans Sexes.” Nature 571, no. 7763 (July 2019): 63–71. https://doi.org/10.1038/s41586-019-1352-7.\") Ongoing progress in modeling individual neurons could change this, and perhaps ultimately allow accurate simulation of entire human brains.\n\n\nCombined with brain scanning (see above) and sufficient computational resources, this may enable brain emulations, a form of AGI in which the AI system is similar, mentally, to some original human. This would change the kind of AI safety work that would be relevant, as well as introducing new AI policy questions. It would also likely make the time until AGI is developed more predictable. It might influence takeoff speeds. Even if brain scanning is not possible, a good low-level understanding of the brain might speed AI development, especially of systems that are more similar to human brains.\n\n\n\n31. Brain-machine interfaces (TML, TAS, POL, CHA, MIS)\n\n\n \n\n \n\nBetter, safer, and cheaper methods to control computers directly with our brains may be developed.At least one project is explicitly working towards this goal.[52](https://aiimpacts.org/relevant-pre-agi-possibilities/#easy-footnote-bottom-52-2336 \"“Neuralink.” Accessed April 17, 2020. https://neuralink.com/.\")\nStrong brain-machine interfaces might:\n\n\n* Accelerate research, including on AI and AI safety[53](https://aiimpacts.org/relevant-pre-agi-possibilities/#easy-footnote-bottom-53-2336 \"Elon Musk, founder of Neuralink, claims that eventually their interfaces will multiply the user’s economic productivity tenfold. See timestamp 46:40 of this video: “(1) Joe Rogan Experience #1470 – Elon Musk – YouTube.” Accessed May 8, 2020. https://www.youtube.com/watch?v=RcYjXbSJBN8.\")\n* Accelerate in vitro brain technology\n* Accelerate mind-reading, lie detection, and persuasion tools\n* Deteriorate collective epistemology (e.g. by contributing to wireheading or short attention spans)\n* Improve collective epistemology (e.g. by improving communication abilities)\n* Increase inequality in influence among people\n\n\n\n32. In vitro brains (TML, TAS, POL, CHA)\n\n\n \n\n \n\nNeural tissue can be grown in a dish (or in an animal and transplanted) and connected to computers, sensors, and even actuators.[54](https://aiimpacts.org/relevant-pre-agi-possibilities/#easy-footnote-bottom-54-2336 \"For example, in 2004 some rat brain cells in a dish were trained to partially fly a simulated fighter jet. Biever, Celeste. “Brain Cells in a Dish Fly Fighter Plane.” New Scientist. Accessed May 6, 2020. https://www.newscientist.com/article/dn6573-brain-cells-in-a-dish-fly-fighter-plane/. \") If this tissue can be trained to perform important tasks, and the technology develops enough, it might function as a sort of artificial intelligence. Its components would not be faster than humans, but it might be cheaper or more intelligent. Meanwhile, this technology might also allow fresh neural tissue to be grafted onto existing humans, potentially serving as a cognitive enhancer.[55](https://aiimpacts.org/relevant-pre-agi-possibilities/#easy-footnote-bottom-55-2336 \"“Since our abilities are the product of neuronal development and activity, augmenting brain function with IVB is not beyond the realms of possibility, especially if used at the same time as treating a brain disease or injury to render the person “better than well.”” “Brain in a Vat: 5 Challenges for the In Vitro Brain | Practical Ethics.” Accessed May 6, 2020. http://blog.practicalethics.ox.ac.uk/2015/08/brain-in-a-vat-5-challenges-for-the-in-vitro-brain/. \")\nThis might change the sorts of systems AI safety efforts should focus on. It might also automate much human labor, inspire changes in public opinion about AI research (e.g. promoting concern about the rights of AI systems), and have other effects which are hard to predict.\n\n\n\n33. Weak AGI (TML, TAS, POL, CHA, MIS)\n\n\n \n\n \n\nResearchers may develop something which is a true artificial general intelligence—able to learn and perform competently all the tasks humans do—but just isn’t very good at them, at least, not as good as a skilled human. \n\n\nIf weak AGI is faster or cheaper than humans, it might still replace humans in many jobs, potentially speeding economic or technological progress. Separately, weak AGI might provide testing opportunities for technical AI safety research. It might also change public opinion about AI, for instance inspiring a “robot rights” movement, or an anti-AI movement.\n\n\n\n34. Expensive AGI (TML, TAS, POL, CHA, MIS)\n\n\n \n\n \n\nResearchers may develop something which is a true artificial general intelligence, and moreover is qualitatively more intelligent than any human, but is vastly more expensive, so that there is some substantial period of time before cheap AGI is developed. \n\n\nAn expensive AGI might contribute to endeavors that are sufficiently valuable, such as some science and technology, and so may have a large effect on society. It might also prompt increased effort on AI or AI safety, or inspire public thought about AI that produces changes in public opinion and thus policy, e.g. regarding the rights of machines. It might also allow opportunities for trialing AI safety plans prior to very widespread use.\n\n\n\n35. Slow AGI (TML, TAS, POL, CHA, MIS)\n\n\n \n\n \n\nResearchers may develop something which is a true artificial general intelligence, and moreover is qualitatively as intelligent as the smartest humans, but takes a lot longer to train and learn than today’s AI systems.\n\n\nSlow AGI might be easier to understand and control than other kinds of AGI, because it would train and learn more slowly, giving humans more time to react and understand it. It might produce changes in public opinion about AI.\n\n\n\n36. Automation of human labor (TML, TAS, POL, CHA, MIS)\n\n\n \n\n \n\nIf the pace of automation substantially increases prior to advanced AGI, there could be social upheaval and also dramatic economic growth. This might affect investment in AI.\n\n\n#### Shifts in the balance of power\n\n\n\n37. Major leak of AI research (TML, TAS, POL, CHA)\n\n\n \n\n \n\nEdward Snowden defected from the NSA and made public a vast trove of information. Perhaps something similar could happen to a leading tech company or AI project. \n\n\nIn a world where much AI progress is hoarded, such an event could accelerate timelines and make the political situation more multipolar and chaotic.\n\n\n\n38. Shift in favor of espionage (POL, CHA, MIS)\n\n\n \n\n \n\nEspionage techniques might become more effective relative to counterespionage techniques. In particular:\n\n\n* Quantum computing could break current encryption protocols.[56](https://aiimpacts.org/relevant-pre-agi-possibilities/#easy-footnote-bottom-56-2336 \" “The cryptography underpinning modern internet communications and e-commerce could someday succumb to a quantum attack.” “Denning, Dorothy. “Is Quantum Computing a Cybersecurity Threat?” The Conversation. Accessed April 16, 2020. http://theconversation.com/is-quantum-computing-a-cybersecurity-threat-107411.” \")\n* Automated vulnerability detection[57](https://aiimpacts.org/relevant-pre-agi-possibilities/#easy-footnote-bottom-57-2336 \"”The need for automated, scalable, machine-speed vulnerability detection and patching is large and growing fast as more and more systems—from household appliances to major military platforms—get connected to and become dependent upon the internet. … To help overcome these challenges, DARPA launched the Cyber Grand Challenge, a competition to create automatic defensive systems capable of reasoning about flaws, formulating patches and deploying them on a network in real time.”Fraze, Dustin. “Cyber Grand Challenge (CGC) (Archived).” Defense Advanced Research Projects Agency. Accessed April 30, 2020. https://www.darpa.mil/program/cyber-grand-challenge. \") could turn out to have an advantage over automated cyberdefense systems, at least in the years leading up to advanced AGI.\n\n\nMore successful espionage techniques might make it impossible for any AI project to maintain a lead over other projects for any substantial period of time. Other disruptions may become more likely, such as hacking into nuclear launch facilities, or large scale cyberwarfare.\n\n\n\n39. Shift in favor of counterespionage (POL, CHA, MIS)\n\n\n \n\n \n\nCounterespionage techniques might become more effective relative to espionage techniques than they are now. In particular:\n\n\n* Post-quantum encryption might be secure against attack by quantum computers.[58](https://aiimpacts.org/relevant-pre-agi-possibilities/#easy-footnote-bottom-58-2336 \"“Post-quantum cryptography (sometimes referred to as quantum-proof, quantum-safe or quantum-resistant) refers to cryptographic algorithms (usually public-key algorithms) that are thought to be secure against an attack by a quantum computer.” “Post-Quantum Cryptography.” In Wikipedia, March 29, 2020. https://en.wikipedia.org/w/index.php?title=Post-quantum_cryptography&oldid=948037928. \")\n* Automated cyberdefense systems could turn out to have an advantage over automated vulnerability detection. Ben Garfinkel and Allan Dafoe[59](https://aiimpacts.org/relevant-pre-agi-possibilities/#easy-footnote-bottom-59-2336 \"Garfinkel, Ben, and Allan Dafoe. “How Does the Offense-Defense Balance Scale?” Journal of Strategic Studies 42, no. 6 (September 19, 2019): 736–63. https://www.tandfonline.com/doi/full/10.1080/01402390.2019.1631810 \") give reason to think the balance will ultimately shift to favor defense.\n\n\nStronger counterespionage techniques might make it easier for an AI project to maintain a technological lead over the rest of the world. Cyber wars and other disruptive events could become less likely.\n\n\n\n40. Broader or more sophisticated surveillance (POL, CHA, MIS)\n\n\n \n\n \n\nMore extensive or more sophisticated surveillance could allow strong and selective policing of technological development. It would also have other social effects, such as making totalitarianism easier and making terrorism harder.\n\n\n\n41. Autonomous weapons (POL, CHA)\n\n\n \n\n \n\nAutonomous weapons could shift the balance of power between nations, or shift the offense-defense balances resulting in more or fewer wars or terrorist attacks, or help to make totalitarian governments more stable. As a potentially early, visible and controversial use of AI, they may also especially influence public opinion on AI more broadly, e.g. prompting anti-AI sentiment.\n\n\n\n42. Shift in importance of governments, corporations, and other groups in AI development (POL, CHA)\n\n\n \n\n \n\nCurrently both governments and corporations are strategically relevant actors in determining the course of AI development. Perhaps governments will become more important, e.g. by nationalizing and merging AI companies. Or perhaps governments will become less important, e.g. by not paying attention to AI issues at all, or by becoming less powerful and competent generally. Perhaps some third kind of actor (such as religion, insurgency, organized crime, or special individual) will become more important, e.g. due to persuasion tools, countermeasures to surveillance, or new weapons of guerilla warfare.[60](https://aiimpacts.org/relevant-pre-agi-possibilities/#easy-footnote-bottom-60-2336 \"For example, 3D printers might make it easier for underground organizations to secretly procure weapons and equipment, and cheap AI-guided drones might make terror attacks and assassinations both more effective and harder to trace.\")\nThis influences AI policy by affecting which actors are relevant to how AI is developed and deployed.\n\n\n\n43. Catastrophe in strategically important location (TML, POL, CHA, MIS)\n\n\n\n \n\n \n\nPerhaps some strategically important location (e.g. tech hub, seat of government, or chip fab) will be suddenly destroyed. Here is a non-exhaustive list of ways this could happen:\n\n\n* Terrorist attack with weapon of mass destruction\n* Major earthquake, flood, tsunami, etc. (e.g. this research claims a 2% chance of magnitude 8.0 or greater earthquake in San Francisco by 2044.)[61](https://aiimpacts.org/relevant-pre-agi-possibilities/#easy-footnote-bottom-61-2336 \"See Figure 4 in the UCERF3 report, available here. “USGS Open-File Report 2013–1165: Uniform California Earthquake Rupture Forecast, Version 3 (UCERF3)—The Time-Independent Model.” Accessed April 17, 2020. https://pubs.usgs.gov/of/2013/1165/.\")\n\n\nIf it happens, it might be strategically disruptive, causing e.g. the dissolution and diaspora of the front-runner AI project, or making it more likely that some government makes a radical move of some sort.\n\n\n\n44. Change in national AI research loci (POL, CHA)\n\n\n \n\n \n\nFor instance, a new major national hub of AI research could arise, rivalling the USA and China in research output. Or either the USA or China could cease to be relevant to AI research.\n\n\nThis might make coordinating AI policy more difficult. It might make a rush for AGI more or less likely.\n\n\n\n45. Large war (TML, POL, CHA, MIS)\n\n\n \n\n \n\nThis might cause short-term, militarily relevant AI capabilities research to be prioritized over AI safety and foundational research. It could also make global coordination on AI policy difficult.\n\n\n\n46. Civil war or regime change in major relevant countries (POL, CHA, MIS)\n\n\n \n\n \n\nThis might be very dangerous for people living in those countries. It might change who the strategically relevant actors are for shaping AI development. It might result in increased instability, or cause a new social movement or ideological shift.\n\n\n\n47. Formation of a world government (POL, CHA)\n\n\n \n\n \n\nThis would make coordinating AI policy easier in some ways (e.g. there would be no need for multiple governing bodies to coordinate their policy at the highest level), however it might be harder in others (e.g. there might be a more complicated regulatory system overall).\n\n\n**Notes**\n---------\n\n\n\n\n\n\n\n\n\n\n\n\n\n\n\n\n\n\n\n\n\n", "url": "https://aiimpacts.org/relevant-pre-agi-possibilities/", "title": "Relevant pre-AGI possibilities", "source": "aiimpacts.org", "source_type": "wordpress", "date_published": "2020-06-19T13:40:00+00:00", "paged_url": "https://aiimpacts.org/feed?paged=6", "authors": ["Daniel Kokotajlo"], "id": "9eb5b53b23a0fe09c5c26bf6e5368f6d", "summary": ["This page lists 47 things that could plausibly happen before the development of AGI, that could matter for AI safety or AI policy. You can also use the web page to generate a very simple trajectory for the future, as done in this [scenario](https://docs.google.com/document/d/1gd6qQx-SP6rfAVQE5rzfPH0zXYOOHXBa13JSUd2zROQ/edit) that Daniel wrote up."]}
{"text": "Description vs simulated prediction\n\n*By Rick Korzekwa*, *22 April 2020*\n\n\nDuring our investigation into [discontinuous progress](https://aiimpacts.org/discontinuous-progress-investigation/)[1](https://aiimpacts.org/description-vs-simulated-prediction/#easy-footnote-bottom-1-2415 \"By ‘discontinuity’, I mean a jump in technological progress that happened at least ten years earlier than it would have taken had the preceding trend held. For example, from 1826 to 1929, the record for the longest suspension bridge span increased from 176 meters to 564 meters, for an average rate of 3.8 meters per year. In 1931, the George Washington Bridge broke the record by more than 500 meters, which would have taken more than a century at 3.8m/year. For more details, see our methodology page and Katja’s blog post on the project.\"), we had some discussions about what exactly it is that we’re trying to do when we analyze discontinuities in technological progress. There was some disagreement and (at least on my part) some confusion about what we were trying to learn from all of this. I think this comes from two separate, more general questions that can come up when forecasting future progress. These questions are closely related and both can be answered in part by analyzing discontinuities. First I will describe these questions generically, then I will explain how they can become confused in the context of analyzing discontinuous progress. \n\n\nQuestion 1: How did tech progress happen in the past?\n-----------------------------------------------------\n\n\nKnowing something about how historical progress happened is crucial to making good forecasts now, both from the standpoint of understanding the underlying mechanisms and establishing base rates. Merely being able to *describe what happened and why* can help us make sense of what’s happening now and should enable us to make better predictions. Such descriptions vary in scope and detail. For example:\n\n\n* The number of transistors per chip doubled roughly every two years from 1970 to 2020\n* Wartime funding during WWII led to the rapid development and scaling of penicillin production, which contributed to a 90% decrease in US syphilis mortality from 1945 to 1967\n* Large jumps in metrics for technological progress were not always accompanied by fundamental scientific breakthroughs\n\n\nThis sort of analysis may be used for other work, in addition to forecasting rates of progress. In the context of our work on discontinuities, answering this question mostly consists of describing quantitatively how metrics for progress evolve over time.\n\n\nQuestion 2: How would we have fared making predictions in the past?\n-------------------------------------------------------------------\n\n\nThis is actually a family of questions aimed at developing and calibrating prediction methods based on historical data. These are questions like:\n\n\n* If, in the past, we’d predicted that the current trend would hold, how often and by how much would we have been wrong?\n* Are there domains in which we’d have fared better than others?\n* Are there heuristics we can use to make better predictions?\n* Which methods for characterizing trends in progress would have performed the best?\n* How often would we have seen hints that a discontinuity or change in rate of progress was about to happen?\n\n\nThese questions often, but not always, require the same approach\n----------------------------------------------------------------\n\n\nIn the context of our work on discontinuous progress, these questions converge on the same methods most of the time. For many of our metrics, there was a clear trend leading up to a discontinuity, and describing what happened is essentially the same as attempting to (naively) predict what would have happened if the discontinuity had not happened. But there are times when they differ. In particular, this can happen when we have different information now than we would have had at the time the discontinuity happened, or when the naive approach is clearly missing something important. Three cases of this that come to mind are:\n\n\n**The trend leading up to the discontinuity was ambiguous, but later data made it less ambiguous.** For example, advances in steamships improved times for crossing the Atlantic, but it was not clear whether this progress was exponential or linear at the time that flight or telecommunications were invented. But if we look at progress that occurred for transatlantic ship voyages after flight, we can see that the overall trend was linear. If we want to answer the question “What happened?”, we might say that progress in steamships was linear, so that it would have taken 500 years at the rate of advancement for steamships to bring crossing time down to that of the first transatlantic flight. If we want to answer the question “How much would this discontinuity have affected our forecasts at the time?”, we might say that it looked exponential, so that our forecasts would have been wrong by a substantially shorter amount of time.\n\n\n**We now have access to information from before the discontinuity that nobody (or no one person) had access to at the time.** In the past, the world was much less connected, and it is not clear who knew about what at the time. For example, [building heights](https://aiimpacts.org/discontinuity-from-the-burj-khalifa/), [altitude records](https://aiimpacts.org/discontinuity-in-altitude-records/), [bridge spans](https://aiimpacts.org/historic-trends-in-bridge-span-length/), and [military capabilities](https://aiimpacts.org/effects-of-breech-loading-rifles-on-historic-trends-in-firearm-progress/) all showed progress across different parts of the world, and it seems likely that nobody had access to all the information that we have now, so that forecasting may have been much harder or yielded different results. Information that is actively kept secret may have made this problem worse. It seems plausible that nobody knew the state of both the Manhattan Project and the German nuclear weapons program at the time that the first nuclear weapon was tested in 1945.\n\n\n**The inside view overwhelms the outside view.** For example, the second [transatlantic telegraph cable](https://aiimpacts.org/historic-trends-in-transatlantic-message-speed/) was much, much better than the first. Using our methodology, it was nearly as large an advancement over the first cable as the first cable was over mailing by ship. But we lose a lot by viewing these advances only in terms of their deviation from the previous trend. The first cable had extremely poor performance, while the second performed about as well as a typical high performance telegraph cable did at the time. If we were trying to predict future progress at the time, we’d focus on questions like “How long do we think it will take to get a normal cable working?” or “How soon will it be until someone is willing to fund the next cable laying expedition?”, not “If we draw a line through the points on this graph, where does that take us?” (Though that outside view may still be worth consideration.) However, if we’re just trying to *describe how the metric evolved over time*, then the correct thing to do *is* to just draw a line through the points as best we can and calculate how far off-trend the new advancement is. \n\n\nReasons for focusing more on the descriptive approach for now\n-------------------------------------------------------------\n\n\nBoth of these questions are important, and we can’t really answer one while totally ignoring the other. But for now, we have focused more on describing what happened (that is, answering question 1). \n\n\nThere are several reasons for this, but first I’ll describe **some advantages to focusing on simulating historical predictions:**\n\n\n1. It mitigates what may be some misleading results from the descriptive approach. See, for example, the description of the transatlantic telegraph above.\n2. We’re trying to do forecasting (or enable others to do it), and really good answers to these questions might be more valuable.\n\n\n**But, for now, I think the advantages to focusing on description are greater:**\n\n\n1. The results are more readily reusable for other projects, either by us or by others. For example, answering a question like “How much of an improvement is a typical major advancement over previous technology?”\n2. It does not require us to model a hypothetical forecaster. It’s hard to predict what we (or someone else) would have predicted if asked about future progress in weapons technology just before the invention of nuclear weapons. To me, this process feels like it has a lot of moving parts or at least a lot of subjectivity, which leaves room for error, and makes it harder for other people to evaluate our methods.\n3. It is easier to build from question 1 to question 2 than the other way around. A description of what happened is a pretty reasonable starting point for figuring out which forecasting methods would have worked.\n4. It is easier to compare across technologies using question 1. Question 2 requires taking a more inside view, which makes comparisons harder.\n\n\n\nNotes\n-----\n\n", "url": "https://aiimpacts.org/description-vs-simulated-prediction/", "title": "Description vs simulated prediction", "source": "aiimpacts.org", "source_type": "wordpress", "date_published": "2020-04-22T16:30:00+00:00", "paged_url": "https://aiimpacts.org/feed?paged=7", "authors": ["richardkorzekwa"], "id": "37ed5309b64af92029ad848989ea9c23", "summary": ["AI Impacts’ investigation into discontinuous progress intends to answer two questions:\n1. How did tech progress happen in the past?\n2. How well could it have been predicted beforehand?\n\nThese can diverge when we have different information available now than in the past. For example, we could have more information because later data clarified trends or because the information is more accessible. We might have less information because we take an outside view (looking at trends) rather than an inside view (knowing the specific bottlenecks and what might need to be overcome).\n\nThe post then outlines some tradeoffs between answering these two questions and settles on primarily focusing on the first: describing tech progress in the past. "]}
{"text": "Surveys on fractional progress towards HLAI\n\nGiven simplistic assumptions, extrapolating fractional progress estimates suggests a median time from 2020 to human-level AI of:\n\n\n* 372 years (2392), based on responses collected in Robin Hanson’s informal 2012-2017 survey.\n* 36 years (2056), based on all responses collected in the 2016 Expert Survey on Progress in AI.\n* 142 years (2162), based on the subset of responses to the 2016 Expert Survey on Progress in AI who had been in their subfield for at least 20 years.\n* 32 years (2052), based on the subset of responses to the 2016 Expert Survey on Progress in AI about progress in deep learning or machine learning as a whole rather than narrow subfields.\n\n\n67% of respondents of the 2016 expert survey on AI and 44% of respondents who answered from Hanson’s informal survey said that progress was accelerating.\n\n\nDetails\n-------\n\n\nOne way of estimating how many years something will take is to estimate what fraction of progress toward it has been made over a fixed number of years, then to extrapolate the number of years needed for full progress. As suggested by Robin Hanson,[1](https://aiimpacts.org/surveys-on-fractional-progress-towards-hlai/#easy-footnote-bottom-1-2416 \"From this Overcoming Bias post:
and Branwen, Gwern. “Embryo Selection For Intelligence,” January 22, 2016. https://www.gwern.net/Embryo-selection.\") could affect many areas of life. If the changes were dramatic, they might have a large impact even if only a small fraction of humanity were altered by them. \n\n\nChanges in human capabilities or other human traits via genetic interventions might:\n\n\n* Accelerate research in general\n* Differentially accelerate research projects that depend more on “genius” and less on money or experience\n* Influence politics and ideology\n* Cause social upheaval\n* Increase the number of people capable of causing great harm\n* Have a huge variety of effects not considered here, given the ubiquitous relevance of human nature to events\n* Shift the landscape of effective strategies for influencing AI development (see below)\n\n\n\n20. Landscape of effective strategies for influencing AI development changes substantially (CHA, MIS)\n\n\n \n\n \n\nFor a person at a time, there is a landscape of strategies for influencing the world, and in particular for influencing AI development and the effects of advanced AGI. The landscape could change such that the most effective strategies for influencing AI development are:\n\n\n* More or less reliably helpful (e.g. working for an hour on a major unsolved technical problem might have a low chance of a very high payoff, and so not be very reliable)\n* More or less “outside the box” (e.g. being an employee, publishing academic papers, and signing petitions are normal strategies, whereas writing Harry Potter fanfiction to illustrate rationality concepts and inspire teenagers to work on AI safety is not)[40](https://aiimpacts.org/relevant-pre-agi-possibilities/#easy-footnote-bottom-40-2336 \"Harry Potter and the Methods of Rationality, written by Eliezer Yudkowsky in the early 2010s, anecdotally brought many people into the ai risk community. As of 2020 it is the most popular harry potter fanfiction of all time according to fanfiction.net.“Harry Potter FanFiction Archive | FanFiction.” Accessed April 27, 2020. https://www.fanfiction.net/book/Harry-Potter/?&srt=3&r=103. \")\n* Easier or harder to find, such that marginal returns to investment in strategy research change\n\n\nHere is a non-exhaustive list of reasons to think these features might change systematically over time:\n\n\n* As more people devote more effort to achieving some goal, one might expect that effective strategies become common, and it becomes harder to find novel strategies that perform better than common strategies. As advanced AI becomes closer, one might expect more effort to flow into influencing the situation. Currently some ‘markets’ are more efficient than others; in some the orthodox strategies are best or close to the best, whereas in others clever and careful reasoning can find strategies vastly better than what most people do. How efficient a market is depends on how many people are genuinely trying to compete in it, and how accurate their beliefs are. For example, the stock market and the market for political influence are fairly efficient, because many highly-knowledgeable actors are competing. As more people take interest, the ‘market’ for influencing the course of AI may become more efficient. (This would also decrease the marginal returns to investment in strategy research, by making orthodox strategies closer to optimal.) If there is a deterioration of social epistemology (see below), the market might instead become less efficient.\n* Currently there are some tasks at which the most skilled people are not much better than the average person (e.g. manual labor, voting) and others in which the distribution of effectiveness is heavy-tailed, such that a large fraction of the total influence comes from a small fraction of individuals (e.g. theoretical math, donating to politicians). The types of activity that are most useful for influencing the course of AI development may change over time in this regard, which in turn might affect the strategy landscape in all three ways described above.\n* Transformative technologies can lead to new opportunities and windfalls for people who recognize them early. As more people take interest, opportunities for easy success disappear. Perhaps there will be a burst of new technologies prior to advanced AGI, creating opportunities for unorthodox or risky strategies to be very successful.\n\n\nA shift in the landscape of effective strategies for influencing the course of AI is relevant to anyone who wants to have an effective strategy for influencing the course of AI.[41](https://aiimpacts.org/relevant-pre-agi-possibilities/#easy-footnote-bottom-41-2336 \"This talk and this post discuss some dimensions of this landscape and explain why it is important to think about. “Some Cruxes on Impactful Alternatives to AI Policy Work – EA Forum.” Accessed April 16, 2020. https://forum.effectivealtruism.org/posts/DW4FyzRTfBfNDWm6J/some-cruxes-on-impactful-alternatives-to-ai-policy-work. Effective Altruism. “Prospecting for Gold.” Accessed April 16, 2020. https://www.effectivealtruism.org/articles/prospecting-for-gold-owen-cotton-barratt/.\") If it is part of a more general shift in the landscape of effective strategies for other goals — e.g. winning wars, making money, influencing politics — the world could be significantly disrupted in ways that may be hard to predict.\n\n\n\n21. Global economic collapse (TML, CHA, MIS)\n\n\n \n\n \n\nThis might slow down research or precipitate other relevant events, such as war.\n\n\n\n22. Scientific stagnation (TML, TAS, POL, CHA, MIS)\n\n\n \n\n \n\nThere is some evidence that scientific progress in general might be slowing down. For example, the millennia-long trend of decreasing economic doubling time seems to have stopped around 1960.[42](https://aiimpacts.org/relevant-pre-agi-possibilities/#easy-footnote-bottom-42-2336 \"See the first graph in Alexander, Scott. “1960: The Year The Singularity Was Cancelled.” Slate Star Codex, April 23, 2019. https://slatestarcodex.com/2019/04/22/1960-the-year-the-singularity-was-cancelled/. \") Meanwhile, scientific progress has arguably come from increased investment in research. Since research investment has been growing faster than the economy, it might eventually saturate and grow only as fast as the economy.[43](https://aiimpacts.org/relevant-pre-agi-possibilities/#easy-footnote-bottom-43-2336 \"”We present a wide range of evidence from various industries, products, and firms showing that research effort is rising substantially while research productivity is declining sharply.” Bloom, Nicholas, Charles I Jones, John Van Reenen, and Michael Webb. “Are Ideas Getting Harder to Find?” Working Paper. Working Paper Series. National Bureau of Economic Research, September 2017. https://doi.org/10.3386/w23782. \")\nThis might slow down AI research, making the events on this list (but not the technologies) more likely to happen before advanced AGI.\n\n\n\n23. Global catastrophe (TML, POL, CHA)\n\n\n \n\n \n\nHere are some examples of potential global catastrophes:\n\n\n* Climate change tail risks, e.g. feedback loop of melting permafrost releasing methane[44](https://aiimpacts.org/relevant-pre-agi-possibilities/#easy-footnote-bottom-44-2336 \"See here for an overview of such risks.GiveWell. “Extreme Risks from Climate Change.” Accessed April 17, 2020. https://www.givewell.org/shallow/climate-change/extreme-risks.\")\n* Major nuclear exchange\n* Global pandemic\n* Volcano eruption that leads to 10% reduction in global agricultural production[45](https://aiimpacts.org/relevant-pre-agi-possibilities/#easy-footnote-bottom-45-2336 \"See here for some arguments and sources about the likelihood of 10% reductions in global agricultural production, e.g. from volcanos. “Should We Be Spending No Less on Alternate Foods than AI Now? – EA Forum.” Accessed April 17, 2020. https://forum.effectivealtruism.org/posts/7XRjb3Tx8j36AcBpb/should-we-be-spending-no-less-on-alternate-foods-than-ai-now.\")\n* Exceptionally bad solar storm knocks out world electrical grid[46](https://aiimpacts.org/relevant-pre-agi-possibilities/#easy-footnote-bottom-46-2336 \"From Wikipedia: “In June 2013, a joint venture from researchers at Lloyd’s of London and Atmospheric and Environmental Research (AER) in the United States used data from the Carrington Event to estimate the current cost of a similar event to the U.S. alone at $0.6–2.6 trillion.[2]” “Solar Storm of 1859.” In Wikipedia, April 16, 2020. https://en.wikipedia.org/w/index.php?title=Solar_storm_of_1859&oldid=951346360.\")\n* Geoengineering project backfires or has major negative side-effects[47](https://aiimpacts.org/relevant-pre-agi-possibilities/#easy-footnote-bottom-47-2336 \"From Wikipedia: “There may be unintended climatic consequences of solar radiation management, such as significant changes to the hydrological cycle[24][25][26] that might not be predicted by the models used to plan them.[22] Such effects may be cumulative or chaotic in nature.[27] Ozone depletion is a risk of techniques involving sulfur delivery into the stratosphere.[28]” “Solar Radiation Management.” In Wikipedia, April 16, 2020. https://en.wikipedia.org/w/index.php?title=Solar_radiation_management&oldid=951302439.\")\n\n\nA global catastrophe might be expected to cause conflict and slowing of projects such as research, though it could also conceivably increase attention on projects that are useful for dealing with the problem. It seems likely to have other hard to predict effects.\n\n\n#### Attitudes toward AGI\n\n\n\n24. Shift in level of public attention on AGI (TML, POL, CHA, MIS)\n\n\n\n \n\n \n\nThe level of attention paid to AGI by the public, governments, and other relevant actors might increase (e.g. due to an impressive demonstration or a bad accident) or decrease (e.g. due to other issues drawing more attention, or evidence that AI is less dangerous or imminent).\n\n\nChanges in the level of attention could affect the amount of work on AI and AI safety. More attention could also lead to changes in public opinion such as panic or an AI rights movement. \n\n\nIf the level of attention increases but AGI does not arrive soon thereafter, there might be a subsequent period of disillusionment.\n\n\n\n25. Change in investment in AGI development (TML, TAS, POL)\n\n\n \n\n \n\nThere could be a rush for AGI, for instance if major nations begin megaprojects to build it. Or there could be a rush away from AGI, for instance if it comes to be seen as immoral or dangerous like human cloning or nuclear rocketry. \n\n\nIncreased investment in AGI might make advanced AGI happen sooner, with less [hardware overhang](https://aiimpacts.org/hardware-overhang/) and potentially less proportional investment in safety. Decreased investment might have the opposite effects.\n\n\n\n26. New social movements or ideological shifts (TML, TAS, POL, MIS)\n\n\n \n\n \n\nThe communities that build and regulate AI could undergo a substantial ideological shift.Historically, entire nations have been swept by radical ideologies within about a decade or so, e.g. Communism, Fascism, the Cultural Revolution, and the First Great Awakening.[48](https://aiimpacts.org/relevant-pre-agi-possibilities/#easy-footnote-bottom-48-2336 \" “Cultural Revolution.” In Wikipedia, April 23, 2020. https://en.wikipedia.org/w/index.php?title=Cultural_Revolution&oldid=952680930. “First Great Awakening.” In Wikipedia, April 8, 2020. https://en.wikipedia.org/w/index.php?title=First_Great_Awakening&oldid=949753276.\") Major ideological shifts within communities smaller than nations (or within nations, but on specific topics) presumably happen more often. There might even appear powerful social movements explicitly focused on AI, for instance in opposition to it or attempting to secure legal rights and moral status for AI agents.[49](https://aiimpacts.org/relevant-pre-agi-possibilities/#easy-footnote-bottom-49-2336 \"For an example of someone trying to secure legal rights for artificial intelligences, see this document in which the US patent office denies someone’s request to have the patent granted to their AI, stating that “Lastly, petitioner has outlined numerous policy considerations to support the position that a patent application can name a machine as inventor … These policy considerations notwithstanding, they do not overcome the plain language of the patent laws as passed by the Congress and interpreted by the courts.” From the first PDF linked in this news article: CNN, AJ Willingham. “Artificial Intelligence Can’t Technically Invent Things, Says Patent Office.” CNN. Accessed April 30, 2020. https://www.cnn.com/2020/04/30/us/artificial-intelligence-inventing-patent-office-trnd/index.html. \") Finally, there could be a general rise in extremist movements, for instance due to a symbiotic feedback effect hypothesized by some,[50](https://aiimpacts.org/relevant-pre-agi-possibilities/#easy-footnote-bottom-50-2336 \"Polar opposite political movements can arguably sometimes be symbiotes; each one gains power and followers by claiming to be a proportional and necessary response to the dire threat posed by the other. For some arguments to this effect, see here and here. Illing, Sean. “Reciprocal Rage: Why Islamist Extremists and the Far Right Need Each Other.” Vox, December 19, 2017. https://www.vox.com/world/2017/12/19/16764046/islam-terrorism-far-right-extremism-isis. “The Toxoplasma Of Rage | Slate Star Codex.” Accessed April 17, 2020. https://slatestarcodex.com/2014/12/17/the-toxoplasma-of-rage/.\") which might have strategically relevant implications even if mainstream opinions do not change.\n\n\nChanges in public opinion on AI might change the speed of AI research, change who is doing it, change which types of AI are developed or used, and limit or alter discussion. For example, attempts to limit an AI system’s effects on the world by containing it might be seen as inhumane, as might adversarial and population-based training methods. Broader ideological change or a rise in extremisms might increase the probability of a massive crisis, revolution, civil war, or world war.\n\n\n\n27. Harbinger of AGI (ALN, POL, MIS)\n\n\n \n\n \n\nEvents could occur that provide compelling evidence, to at least a relevant minority of people, that advanced AGI is near.\n\n\nThis could increase the amount of technical AI safety work and AI policy work being done, to the extent that people are sufficiently well-informed and good at forecasting. It could also enable people already doing such work to more efficiently focus their efforts on the true scenario.\n\n\n\n28. AI alignment warning shot (ALN, POL)\n\n\n \n\n \n\nA convincing real-world example of AI alignment failure could occur.\n\n\nThis could motivate more effort into mitigating AI risk and perhaps also provide useful evidence about some kinds of risks and how to avoid them.\n\n\n#### Precursors to AGI\n\n\n\n29. Brain scanning (TML, TAS, POL, CHA, MIS)\n\n\n \n\n \n\nAn accurate way to scan human brains at a very high resolution could be developed.\n\n\nCombined with a good low-level understanding of the brain (see below) and sufficient computational resources, this might enable brain emulations, a form of AGI in which the AGI is similar, mentally, to some original human. This would change the kind of technical AI safety work that would be relevant, as well as introducing new AI policy questions. It would also likely make AGI timelines easier to predict. It might influence takeoff speeds.\n\n\n\n30. Good low-level understanding of the brain (TML, TAS, POL, CHA, MIS)\n\n\n \n\n \n\nTo my knowledge, as of April 2020, humanity does not understand how neurons work well enough to accurately simulate the behavior of a C. Elegans worm, though all connections between its neurons have been mapped[51](https://aiimpacts.org/relevant-pre-agi-possibilities/#easy-footnote-bottom-51-2336 \"Cook, Steven J., Travis A. Jarrell, Christopher A. Brittin, Yi Wang, Adam E. Bloniarz, Maksim A. Yakovlev, Ken C. Q. Nguyen, et al. “Whole-Animal Connectomes of Both Caenorhabditis Elegans Sexes.” Nature 571, no. 7763 (July 2019): 63–71. https://doi.org/10.1038/s41586-019-1352-7.\") Ongoing progress in modeling individual neurons could change this, and perhaps ultimately allow accurate simulation of entire human brains.\n\n\nCombined with brain scanning (see above) and sufficient computational resources, this may enable brain emulations, a form of AGI in which the AI system is similar, mentally, to some original human. This would change the kind of AI safety work that would be relevant, as well as introducing new AI policy questions. It would also likely make the time until AGI is developed more predictable. It might influence takeoff speeds. Even if brain scanning is not possible, a good low-level understanding of the brain might speed AI development, especially of systems that are more similar to human brains.\n\n\n\n31. Brain-machine interfaces (TML, TAS, POL, CHA, MIS)\n\n\n \n\n \n\nBetter, safer, and cheaper methods to control computers directly with our brains may be developed.At least one project is explicitly working towards this goal.[52](https://aiimpacts.org/relevant-pre-agi-possibilities/#easy-footnote-bottom-52-2336 \"“Neuralink.” Accessed April 17, 2020. https://neuralink.com/.\")\nStrong brain-machine interfaces might:\n\n\n* Accelerate research, including on AI and AI safety[53](https://aiimpacts.org/relevant-pre-agi-possibilities/#easy-footnote-bottom-53-2336 \"Elon Musk, founder of Neuralink, claims that eventually their interfaces will multiply the user’s economic productivity tenfold. See timestamp 46:40 of this video: “(1) Joe Rogan Experience #1470 – Elon Musk – YouTube.” Accessed May 8, 2020. https://www.youtube.com/watch?v=RcYjXbSJBN8.\")\n* Accelerate in vitro brain technology\n* Accelerate mind-reading, lie detection, and persuasion tools\n* Deteriorate collective epistemology (e.g. by contributing to wireheading or short attention spans)\n* Improve collective epistemology (e.g. by improving communication abilities)\n* Increase inequality in influence among people\n\n\n\n32. In vitro brains (TML, TAS, POL, CHA)\n\n\n \n\n \n\nNeural tissue can be grown in a dish (or in an animal and transplanted) and connected to computers, sensors, and even actuators.[54](https://aiimpacts.org/relevant-pre-agi-possibilities/#easy-footnote-bottom-54-2336 \"For example, in 2004 some rat brain cells in a dish were trained to partially fly a simulated fighter jet. Biever, Celeste. “Brain Cells in a Dish Fly Fighter Plane.” New Scientist. Accessed May 6, 2020. https://www.newscientist.com/article/dn6573-brain-cells-in-a-dish-fly-fighter-plane/. \") If this tissue can be trained to perform important tasks, and the technology develops enough, it might function as a sort of artificial intelligence. Its components would not be faster than humans, but it might be cheaper or more intelligent. Meanwhile, this technology might also allow fresh neural tissue to be grafted onto existing humans, potentially serving as a cognitive enhancer.[55](https://aiimpacts.org/relevant-pre-agi-possibilities/#easy-footnote-bottom-55-2336 \"“Since our abilities are the product of neuronal development and activity, augmenting brain function with IVB is not beyond the realms of possibility, especially if used at the same time as treating a brain disease or injury to render the person “better than well.”” “Brain in a Vat: 5 Challenges for the In Vitro Brain | Practical Ethics.” Accessed May 6, 2020. http://blog.practicalethics.ox.ac.uk/2015/08/brain-in-a-vat-5-challenges-for-the-in-vitro-brain/. \")\nThis might change the sorts of systems AI safety efforts should focus on. It might also automate much human labor, inspire changes in public opinion about AI research (e.g. promoting concern about the rights of AI systems), and have other effects which are hard to predict.\n\n\n\n33. Weak AGI (TML, TAS, POL, CHA, MIS)\n\n\n \n\n \n\nResearchers may develop something which is a true artificial general intelligence—able to learn and perform competently all the tasks humans do—but just isn’t very good at them, at least, not as good as a skilled human. \n\n\nIf weak AGI is faster or cheaper than humans, it might still replace humans in many jobs, potentially speeding economic or technological progress. Separately, weak AGI might provide testing opportunities for technical AI safety research. It might also change public opinion about AI, for instance inspiring a “robot rights” movement, or an anti-AI movement.\n\n\n\n34. Expensive AGI (TML, TAS, POL, CHA, MIS)\n\n\n \n\n \n\nResearchers may develop something which is a true artificial general intelligence, and moreover is qualitatively more intelligent than any human, but is vastly more expensive, so that there is some substantial period of time before cheap AGI is developed. \n\n\nAn expensive AGI might contribute to endeavors that are sufficiently valuable, such as some science and technology, and so may have a large effect on society. It might also prompt increased effort on AI or AI safety, or inspire public thought about AI that produces changes in public opinion and thus policy, e.g. regarding the rights of machines. It might also allow opportunities for trialing AI safety plans prior to very widespread use.\n\n\n\n35. Slow AGI (TML, TAS, POL, CHA, MIS)\n\n\n \n\n \n\nResearchers may develop something which is a true artificial general intelligence, and moreover is qualitatively as intelligent as the smartest humans, but takes a lot longer to train and learn than today’s AI systems.\n\n\nSlow AGI might be easier to understand and control than other kinds of AGI, because it would train and learn more slowly, giving humans more time to react and understand it. It might produce changes in public opinion about AI.\n\n\n\n36. Automation of human labor (TML, TAS, POL, CHA, MIS)\n\n\n \n\n \n\nIf the pace of automation substantially increases prior to advanced AGI, there could be social upheaval and also dramatic economic growth. This might affect investment in AI.\n\n\n#### Shifts in the balance of power\n\n\n\n37. Major leak of AI research (TML, TAS, POL, CHA)\n\n\n \n\n \n\nEdward Snowden defected from the NSA and made public a vast trove of information. Perhaps something similar could happen to a leading tech company or AI project. \n\n\nIn a world where much AI progress is hoarded, such an event could accelerate timelines and make the political situation more multipolar and chaotic.\n\n\n\n38. Shift in favor of espionage (POL, CHA, MIS)\n\n\n \n\n \n\nEspionage techniques might become more effective relative to counterespionage techniques. In particular:\n\n\n* Quantum computing could break current encryption protocols.[56](https://aiimpacts.org/relevant-pre-agi-possibilities/#easy-footnote-bottom-56-2336 \" “The cryptography underpinning modern internet communications and e-commerce could someday succumb to a quantum attack.” “Denning, Dorothy. “Is Quantum Computing a Cybersecurity Threat?” The Conversation. Accessed April 16, 2020. http://theconversation.com/is-quantum-computing-a-cybersecurity-threat-107411.” \")\n* Automated vulnerability detection[57](https://aiimpacts.org/relevant-pre-agi-possibilities/#easy-footnote-bottom-57-2336 \"”The need for automated, scalable, machine-speed vulnerability detection and patching is large and growing fast as more and more systems—from household appliances to major military platforms—get connected to and become dependent upon the internet. … To help overcome these challenges, DARPA launched the Cyber Grand Challenge, a competition to create automatic defensive systems capable of reasoning about flaws, formulating patches and deploying them on a network in real time.”Fraze, Dustin. “Cyber Grand Challenge (CGC) (Archived).” Defense Advanced Research Projects Agency. Accessed April 30, 2020. https://www.darpa.mil/program/cyber-grand-challenge. \") could turn out to have an advantage over automated cyberdefense systems, at least in the years leading up to advanced AGI.\n\n\nMore successful espionage techniques might make it impossible for any AI project to maintain a lead over other projects for any substantial period of time. Other disruptions may become more likely, such as hacking into nuclear launch facilities, or large scale cyberwarfare.\n\n\n\n39. Shift in favor of counterespionage (POL, CHA, MIS)\n\n\n \n\n \n\nCounterespionage techniques might become more effective relative to espionage techniques than they are now. In particular:\n\n\n* Post-quantum encryption might be secure against attack by quantum computers.[58](https://aiimpacts.org/relevant-pre-agi-possibilities/#easy-footnote-bottom-58-2336 \"“Post-quantum cryptography (sometimes referred to as quantum-proof, quantum-safe or quantum-resistant) refers to cryptographic algorithms (usually public-key algorithms) that are thought to be secure against an attack by a quantum computer.” “Post-Quantum Cryptography.” In Wikipedia, March 29, 2020. https://en.wikipedia.org/w/index.php?title=Post-quantum_cryptography&oldid=948037928. \")\n* Automated cyberdefense systems could turn out to have an advantage over automated vulnerability detection. Ben Garfinkel and Allan Dafoe[59](https://aiimpacts.org/relevant-pre-agi-possibilities/#easy-footnote-bottom-59-2336 \"Garfinkel, Ben, and Allan Dafoe. “How Does the Offense-Defense Balance Scale?” Journal of Strategic Studies 42, no. 6 (September 19, 2019): 736–63. https://www.tandfonline.com/doi/full/10.1080/01402390.2019.1631810 \") give reason to think the balance will ultimately shift to favor defense.\n\n\nStronger counterespionage techniques might make it easier for an AI project to maintain a technological lead over the rest of the world. Cyber wars and other disruptive events could become less likely.\n\n\n\n40. Broader or more sophisticated surveillance (POL, CHA, MIS)\n\n\n \n\n \n\nMore extensive or more sophisticated surveillance could allow strong and selective policing of technological development. It would also have other social effects, such as making totalitarianism easier and making terrorism harder.\n\n\n\n41. Autonomous weapons (POL, CHA)\n\n\n \n\n \n\nAutonomous weapons could shift the balance of power between nations, or shift the offense-defense balances resulting in more or fewer wars or terrorist attacks, or help to make totalitarian governments more stable. As a potentially early, visible and controversial use of AI, they may also especially influence public opinion on AI more broadly, e.g. prompting anti-AI sentiment.\n\n\n\n42. Shift in importance of governments, corporations, and other groups in AI development (POL, CHA)\n\n\n \n\n \n\nCurrently both governments and corporations are strategically relevant actors in determining the course of AI development. Perhaps governments will become more important, e.g. by nationalizing and merging AI companies. Or perhaps governments will become less important, e.g. by not paying attention to AI issues at all, or by becoming less powerful and competent generally. Perhaps some third kind of actor (such as religion, insurgency, organized crime, or special individual) will become more important, e.g. due to persuasion tools, countermeasures to surveillance, or new weapons of guerilla warfare.[60](https://aiimpacts.org/relevant-pre-agi-possibilities/#easy-footnote-bottom-60-2336 \"For example, 3D printers might make it easier for underground organizations to secretly procure weapons and equipment, and cheap AI-guided drones might make terror attacks and assassinations both more effective and harder to trace.\")\nThis influences AI policy by affecting which actors are relevant to how AI is developed and deployed.\n\n\n\n43. Catastrophe in strategically important location (TML, POL, CHA, MIS)\n\n\n\n \n\n \n\nPerhaps some strategically important location (e.g. tech hub, seat of government, or chip fab) will be suddenly destroyed. Here is a non-exhaustive list of ways this could happen:\n\n\n* Terrorist attack with weapon of mass destruction\n* Major earthquake, flood, tsunami, etc. (e.g. this research claims a 2% chance of magnitude 8.0 or greater earthquake in San Francisco by 2044.)[61](https://aiimpacts.org/relevant-pre-agi-possibilities/#easy-footnote-bottom-61-2336 \"See Figure 4 in the UCERF3 report, available here. “USGS Open-File Report 2013–1165: Uniform California Earthquake Rupture Forecast, Version 3 (UCERF3)—The Time-Independent Model.” Accessed April 17, 2020. https://pubs.usgs.gov/of/2013/1165/.\")\n\n\nIf it happens, it might be strategically disruptive, causing e.g. the dissolution and diaspora of the front-runner AI project, or making it more likely that some government makes a radical move of some sort.\n\n\n\n44. Change in national AI research loci (POL, CHA)\n\n\n \n\n \n\nFor instance, a new major national hub of AI research could arise, rivalling the USA and China in research output. Or either the USA or China could cease to be relevant to AI research.\n\n\nThis might make coordinating AI policy more difficult. It might make a rush for AGI more or less likely.\n\n\n\n45. Large war (TML, POL, CHA, MIS)\n\n\n \n\n \n\nThis might cause short-term, militarily relevant AI capabilities research to be prioritized over AI safety and foundational research. It could also make global coordination on AI policy difficult.\n\n\n\n46. Civil war or regime change in major relevant countries (POL, CHA, MIS)\n\n\n \n\n \n\nThis might be very dangerous for people living in those countries. It might change who the strategically relevant actors are for shaping AI development. It might result in increased instability, or cause a new social movement or ideological shift.\n\n\n\n47. Formation of a world government (POL, CHA)\n\n\n \n\n \n\nThis would make coordinating AI policy easier in some ways (e.g. there would be no need for multiple governing bodies to coordinate their policy at the highest level), however it might be harder in others (e.g. there might be a more complicated regulatory system overall).\n\n\n**Notes**\n---------\n\n\n\n\n\n\n\n\n\n\n\n\n\n\n\n\n\n\n\n\n\n", "url": "https://aiimpacts.org/relevant-pre-agi-possibilities/", "title": "Relevant pre-AGI possibilities", "source": "aiimpacts.org", "source_type": "wordpress", "date_published": "2020-06-19T13:40:00+00:00", "paged_url": "https://aiimpacts.org/feed?paged=6", "authors": ["Daniel Kokotajlo"], "id": "9eb5b53b23a0fe09c5c26bf6e5368f6d", "summary": ["This page lists 47 things that could plausibly happen before the development of AGI, that could matter for AI safety or AI policy. You can also use the web page to generate a very simple trajectory for the future, as done in this [scenario](https://docs.google.com/document/d/1gd6qQx-SP6rfAVQE5rzfPH0zXYOOHXBa13JSUd2zROQ/edit) that Daniel wrote up."]}
{"text": "Description vs simulated prediction\n\n*By Rick Korzekwa*, *22 April 2020*\n\n\nDuring our investigation into [discontinuous progress](https://aiimpacts.org/discontinuous-progress-investigation/)[1](https://aiimpacts.org/description-vs-simulated-prediction/#easy-footnote-bottom-1-2415 \"By ‘discontinuity’, I mean a jump in technological progress that happened at least ten years earlier than it would have taken had the preceding trend held. For example, from 1826 to 1929, the record for the longest suspension bridge span increased from 176 meters to 564 meters, for an average rate of 3.8 meters per year. In 1931, the George Washington Bridge broke the record by more than 500 meters, which would have taken more than a century at 3.8m/year. For more details, see our methodology page and Katja’s blog post on the project.\"), we had some discussions about what exactly it is that we’re trying to do when we analyze discontinuities in technological progress. There was some disagreement and (at least on my part) some confusion about what we were trying to learn from all of this. I think this comes from two separate, more general questions that can come up when forecasting future progress. These questions are closely related and both can be answered in part by analyzing discontinuities. First I will describe these questions generically, then I will explain how they can become confused in the context of analyzing discontinuous progress. \n\n\nQuestion 1: How did tech progress happen in the past?\n-----------------------------------------------------\n\n\nKnowing something about how historical progress happened is crucial to making good forecasts now, both from the standpoint of understanding the underlying mechanisms and establishing base rates. Merely being able to *describe what happened and why* can help us make sense of what’s happening now and should enable us to make better predictions. Such descriptions vary in scope and detail. For example:\n\n\n* The number of transistors per chip doubled roughly every two years from 1970 to 2020\n* Wartime funding during WWII led to the rapid development and scaling of penicillin production, which contributed to a 90% decrease in US syphilis mortality from 1945 to 1967\n* Large jumps in metrics for technological progress were not always accompanied by fundamental scientific breakthroughs\n\n\nThis sort of analysis may be used for other work, in addition to forecasting rates of progress. In the context of our work on discontinuities, answering this question mostly consists of describing quantitatively how metrics for progress evolve over time.\n\n\nQuestion 2: How would we have fared making predictions in the past?\n-------------------------------------------------------------------\n\n\nThis is actually a family of questions aimed at developing and calibrating prediction methods based on historical data. These are questions like:\n\n\n* If, in the past, we’d predicted that the current trend would hold, how often and by how much would we have been wrong?\n* Are there domains in which we’d have fared better than others?\n* Are there heuristics we can use to make better predictions?\n* Which methods for characterizing trends in progress would have performed the best?\n* How often would we have seen hints that a discontinuity or change in rate of progress was about to happen?\n\n\nThese questions often, but not always, require the same approach\n----------------------------------------------------------------\n\n\nIn the context of our work on discontinuous progress, these questions converge on the same methods most of the time. For many of our metrics, there was a clear trend leading up to a discontinuity, and describing what happened is essentially the same as attempting to (naively) predict what would have happened if the discontinuity had not happened. But there are times when they differ. In particular, this can happen when we have different information now than we would have had at the time the discontinuity happened, or when the naive approach is clearly missing something important. Three cases of this that come to mind are:\n\n\n**The trend leading up to the discontinuity was ambiguous, but later data made it less ambiguous.** For example, advances in steamships improved times for crossing the Atlantic, but it was not clear whether this progress was exponential or linear at the time that flight or telecommunications were invented. But if we look at progress that occurred for transatlantic ship voyages after flight, we can see that the overall trend was linear. If we want to answer the question “What happened?”, we might say that progress in steamships was linear, so that it would have taken 500 years at the rate of advancement for steamships to bring crossing time down to that of the first transatlantic flight. If we want to answer the question “How much would this discontinuity have affected our forecasts at the time?”, we might say that it looked exponential, so that our forecasts would have been wrong by a substantially shorter amount of time.\n\n\n**We now have access to information from before the discontinuity that nobody (or no one person) had access to at the time.** In the past, the world was much less connected, and it is not clear who knew about what at the time. For example, [building heights](https://aiimpacts.org/discontinuity-from-the-burj-khalifa/), [altitude records](https://aiimpacts.org/discontinuity-in-altitude-records/), [bridge spans](https://aiimpacts.org/historic-trends-in-bridge-span-length/), and [military capabilities](https://aiimpacts.org/effects-of-breech-loading-rifles-on-historic-trends-in-firearm-progress/) all showed progress across different parts of the world, and it seems likely that nobody had access to all the information that we have now, so that forecasting may have been much harder or yielded different results. Information that is actively kept secret may have made this problem worse. It seems plausible that nobody knew the state of both the Manhattan Project and the German nuclear weapons program at the time that the first nuclear weapon was tested in 1945.\n\n\n**The inside view overwhelms the outside view.** For example, the second [transatlantic telegraph cable](https://aiimpacts.org/historic-trends-in-transatlantic-message-speed/) was much, much better than the first. Using our methodology, it was nearly as large an advancement over the first cable as the first cable was over mailing by ship. But we lose a lot by viewing these advances only in terms of their deviation from the previous trend. The first cable had extremely poor performance, while the second performed about as well as a typical high performance telegraph cable did at the time. If we were trying to predict future progress at the time, we’d focus on questions like “How long do we think it will take to get a normal cable working?” or “How soon will it be until someone is willing to fund the next cable laying expedition?”, not “If we draw a line through the points on this graph, where does that take us?” (Though that outside view may still be worth consideration.) However, if we’re just trying to *describe how the metric evolved over time*, then the correct thing to do *is* to just draw a line through the points as best we can and calculate how far off-trend the new advancement is. \n\n\nReasons for focusing more on the descriptive approach for now\n-------------------------------------------------------------\n\n\nBoth of these questions are important, and we can’t really answer one while totally ignoring the other. But for now, we have focused more on describing what happened (that is, answering question 1). \n\n\nThere are several reasons for this, but first I’ll describe **some advantages to focusing on simulating historical predictions:**\n\n\n1. It mitigates what may be some misleading results from the descriptive approach. See, for example, the description of the transatlantic telegraph above.\n2. We’re trying to do forecasting (or enable others to do it), and really good answers to these questions might be more valuable.\n\n\n**But, for now, I think the advantages to focusing on description are greater:**\n\n\n1. The results are more readily reusable for other projects, either by us or by others. For example, answering a question like “How much of an improvement is a typical major advancement over previous technology?”\n2. It does not require us to model a hypothetical forecaster. It’s hard to predict what we (or someone else) would have predicted if asked about future progress in weapons technology just before the invention of nuclear weapons. To me, this process feels like it has a lot of moving parts or at least a lot of subjectivity, which leaves room for error, and makes it harder for other people to evaluate our methods.\n3. It is easier to build from question 1 to question 2 than the other way around. A description of what happened is a pretty reasonable starting point for figuring out which forecasting methods would have worked.\n4. It is easier to compare across technologies using question 1. Question 2 requires taking a more inside view, which makes comparisons harder.\n\n\n\nNotes\n-----\n\n", "url": "https://aiimpacts.org/description-vs-simulated-prediction/", "title": "Description vs simulated prediction", "source": "aiimpacts.org", "source_type": "wordpress", "date_published": "2020-04-22T16:30:00+00:00", "paged_url": "https://aiimpacts.org/feed?paged=7", "authors": ["richardkorzekwa"], "id": "37ed5309b64af92029ad848989ea9c23", "summary": ["AI Impacts’ investigation into discontinuous progress intends to answer two questions:\n1. How did tech progress happen in the past?\n2. How well could it have been predicted beforehand?\n\nThese can diverge when we have different information available now than in the past. For example, we could have more information because later data clarified trends or because the information is more accessible. We might have less information because we take an outside view (looking at trends) rather than an inside view (knowing the specific bottlenecks and what might need to be overcome).\n\nThe post then outlines some tradeoffs between answering these two questions and settles on primarily focusing on the first: describing tech progress in the past. "]}
{"text": "Surveys on fractional progress towards HLAI\n\nGiven simplistic assumptions, extrapolating fractional progress estimates suggests a median time from 2020 to human-level AI of:\n\n\n* 372 years (2392), based on responses collected in Robin Hanson’s informal 2012-2017 survey.\n* 36 years (2056), based on all responses collected in the 2016 Expert Survey on Progress in AI.\n* 142 years (2162), based on the subset of responses to the 2016 Expert Survey on Progress in AI who had been in their subfield for at least 20 years.\n* 32 years (2052), based on the subset of responses to the 2016 Expert Survey on Progress in AI about progress in deep learning or machine learning as a whole rather than narrow subfields.\n\n\n67% of respondents of the 2016 expert survey on AI and 44% of respondents who answered from Hanson’s informal survey said that progress was accelerating.\n\n\nDetails\n-------\n\n\nOne way of estimating how many years something will take is to estimate what fraction of progress toward it has been made over a fixed number of years, then to extrapolate the number of years needed for full progress. As suggested by Robin Hanson,[1](https://aiimpacts.org/surveys-on-fractional-progress-towards-hlai/#easy-footnote-bottom-1-2416 \"From this Overcoming Bias post:
“I’d guess that relative to the starting point of our abilities of twenty years ago, we’ve come about 5-10% of the distance toward human level abilities. At least in probability-related areas, which I’ve known best. I’d also say there hasn’t been noticeable acceleration over that time. … If this 5-10% estimate is typical, as I suspect it is, then an outside view calculation suggests we probably have at least a century to go, and maybe a great many centuries, at current rates of progress.”Hanson, Robin. “AI Progress Estimate.” Overcoming Bias. Accessed April 14, 2020. http://www.overcomingbias.com/2012/08/ai-progress-estimate.html.\") this method can provide an estimate for when human-level AI will be developed, if we have data on what fraction of progress toward human-level AI has been made and whether it is proceeding at a constant rate. \n\n\n\nWe know of two surveys that ask about fractional progress and acceleration in specific AI subfields: an [informal survey conducted by Robin Hanson in 2012 – 2017](https://aiimpacts.org/hanson-ai-expert-survey/), and our [2016 Expert Survey on Progress in AI](https://aiimpacts.org/2016-expert-survey-on-progress-in-ai/). We use them to extrapolate progress to human-level AI, assuming that:\n\n\n1. AI progresses at the average rate that people have observed so far.\n2. Human-level AI will be achieved when the median subfield reaches human-level.\n\n\n### Assumptions\n\n\n#### AI progresses at the average rate that people have observed so far\n\n\nThe naive extrapolation method described above assumes that AI progresses at the average rate that people have observed so far, but some respondents perceived acceleration or deceleration. If we guess that this change in the rate of the progress continues into the future, this suggests that a truer extrapolation of each person’s observations would place human-level performance in their subfield either before or after the naively extrapolated date.\n\n\n#### Human-level AI will be achieved when the median subfield reaches human-level\n\n\nBoth surveys asked respondents about fractional progress in their subfields. Extrapolating out these estimates to get to human-level performance gives some evidence for when AGI may come, but is not a perfect proxy. It may turn out that we get human-level performance in a small number of subfields much earlier than others, such that we count the resulting AI as ‘AGI’, or it may be the case that certain subfields important to AGI do not exist yet.\n\n\n### Hanson AI Expert Survey\n\n\n[Hanson’s survey](https://aiimpacts.org/hanson-ai-expert-survey/) informally asked ~15 AI experts to estimate how far we’ve come in their own subfield of AI research in the last twenty years, compared to how far we have to go to reach human level abilities. The subfields represented were analogical reasoning, knowledge representation, computer-assisted training, natural language processing, constraint satisfaction, robotic grasping manipulation, early-human vision processing, constraint reasoning, and “no particular subfield”. Three respondents said the rate of progress was staying the same, four said it was getting faster, two said it was slowing down, and six did not answer (or may not have been asked). \n\n\n\nThe naive extrapolations[2](https://aiimpacts.org/surveys-on-fractional-progress-towards-hlai/#easy-footnote-bottom-2-2416 \"Naively, we simply divide twenty years by the fraction of progress made to get an estimate of total years necessary, not accounting for possible acceleration. To get the time from now to human-level performanceI we subtract the twenty years of progress already made and subtract the difference between the year the question was asked and now (2020).\") of the answers from [Hanson’s survey](https://aiimpacts.org/hanson-ai-expert-survey/) give a median time from 2020 to [human-level AI](https://aiimpacts.org/human-level-ai/) (HLAI) of 372 years (2392). See the survey data and our calculations [here](https://docs.google.com/spreadsheets/d/1KEttYmpOgyISY8pLAR4syU-0QA4yekI7GFaoabRNDTs/edit?usp=sharing).\n\n\n### 2016 Expert Survey on Progress in AI\n\n\nThe [2016 Expert Survey on Progress in AI](https://aiimpacts.org/2016-expert-survey-on-progress-in-ai/) (2016 ESPAI) asked machine learning researchers which subfield they were in, how long they had been in their subfield, and what fraction of the remaining path to human-level performance (in their subfield) they thought had been traversed in that time.[3](https://aiimpacts.org/surveys-on-fractional-progress-towards-hlai/#easy-footnote-bottom-3-2416 \"\n\n\n\n
- Which AI research area have you worked in for the longest time?
- How long have you worked in this area?
- Consider three levels of progress or advancement in this area: A. Where the area was when you started working in it B. Where it is now C. Where it would need to be for AI software to have roughly human level abilities at the tasks studied in this area What fraction of the distance between where progress was when you started working in the area (A) and where it would need to be to attain human level abilities in the area (C) have we come so far (B)?
— From the printout of the 2016 ESPAI questions.\") 107 out of 111 responses were used in our calculation.[4](https://aiimpacts.org/surveys-on-fractional-progress-towards-hlai/#easy-footnote-bottom-4-2416 \"We excluded responses which said a subfield had seen 100% or more progress, since we’re interested in the remaining progress required in the subfields that haven’t gotten to human-level yet.\") 42 subfields were reported, including “Machine learning”, “Graphical models”, “Speech recognition”, “Optimization”, “Bayesian Learning”, and “Robotics”.[5](https://aiimpacts.org/surveys-on-fractional-progress-towards-hlai/#easy-footnote-bottom-5-2416 \"The complete list is: “Image Processing”, “Machine learning”, “Deep learning”, “Graphical models”, “Speech recognition”, “Optimization”, “Deep neural networks”, “Computer vision”, “Learning theory”, “Classifiers and statistical learning”, “Natural language processing”, “Sequential decision-making, “Online learning”, “Visual perception”, “Bayesian learning”, “Manifold learning”, “Reinforcement learning”, “Probabilistic modeling”, “Robotics”, “Active learning”, “Graph-based pattern recognition”, “Image processing”, “Continuous control”, “Planning algorithms”, and “Network analysis”.\") Notably, Hanson’s survey included subfields that weren’t represented in 2016 ESPAI, including analogic reasoning and knowledge representation. Since 2016 ESPAI was restricted to machine learning researchers, it may exclude non-machine-learning subfields that turn out to be important to fully human-level capabilities.\n\n\n#### Acceleration\n\n\n67% of all respondents said progress in their subfield was accelerating (see Figure 1). Most respondents said progress in their subfield was accelerating in each of the subsets we look at below (ML vs narrow subfield, and time in field).\n\n\nFigure 1: Number of responses that progress was faster in the first half of the time in the field worked by respondents, the second half, or was about the same in both halves.\nMost respondents think progress is accelerating. If this acceleration continues, our naively extrapolated estimates below may be overestimates for time to human-level performance.\n\n\n#### Time to HLAI\n\n\nWe calculated estimated years from 2020 until human-level subfield performance by naively extrapolating the reported fractions of the subfield already traversed.[6](https://aiimpacts.org/surveys-on-fractional-progress-towards-hlai/#easy-footnote-bottom-6-2416 \"As with the Hanson survey, we divided time in the field by the fraction of the remaining path traversed, then subtracted the number of years worked in the subfield, then subtracted an additional four years to account for the difference between when these questions were asked (2016) and now (2020).\") Figure 2 below shows the implied estimates for time until human-level performance for all respondents’ answers. These estimates give a median time from 2020 until HLAI of 36 years (2056).\n\n\nFigure 2: Extrapolated estimated time until human-level subfield performance for each respondent, arranged by length of time. The last four responses are above 1000 but have been cut off.\n##### Machine learning vs subfield progress\n\n\nSome respondents reported broad ‘subfields’, which encompassed all of machine learning, in particular “Machine learning” or “Deep learning”, while others reported narrow subfields, e.g. “Natural language processing” or “Robotics”. We split the survey data based on this subfield narrowness, guessing that progress on machine learning overall may be a better proxy for AGI overall. Among the 69 respondents who gave answers corresponding to the entire field of machine learning, the median implied time was 32 years (2052). Among the 70 respondents who gave narrow answers, the median implied time was 44 years (2064). Figures 3 and 4 show these estimates. \n\n\n\n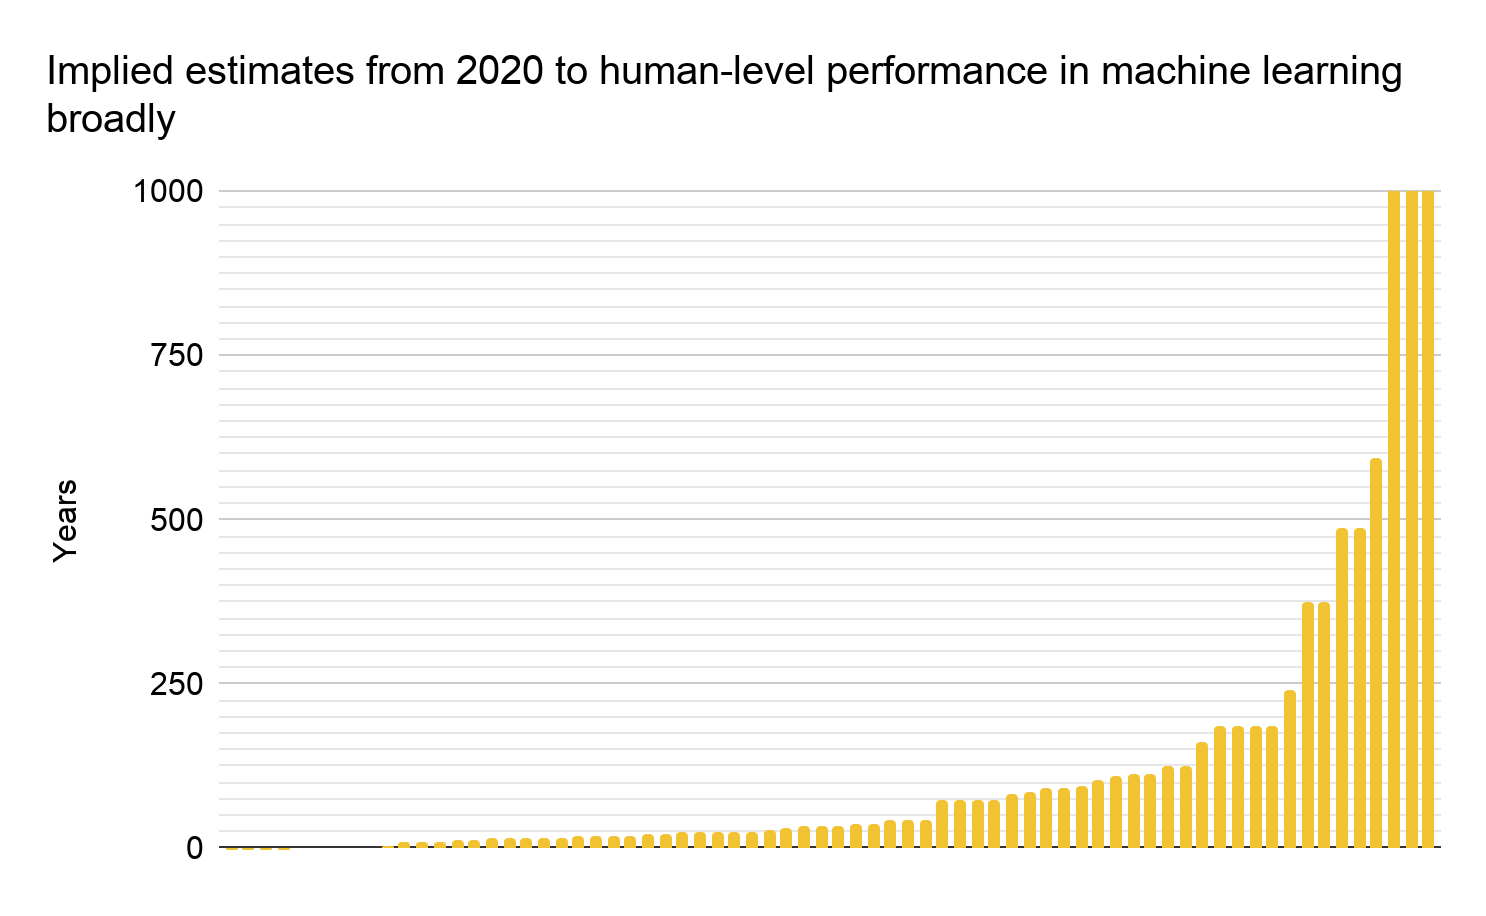Figure 3: Implied estimates for human-level performance based on respondents who specified broad answers, e.g. “Machine learning” when asked about their subfield. The last three responses are above 1000 but have been cut off.\nFigure 3: Implied estimates for human-level performance based on respondents who specified broad answers, e.g. “Machine learning” when asked about their subfield. The last three responses are above 1000 but have been cut off.\n\n\n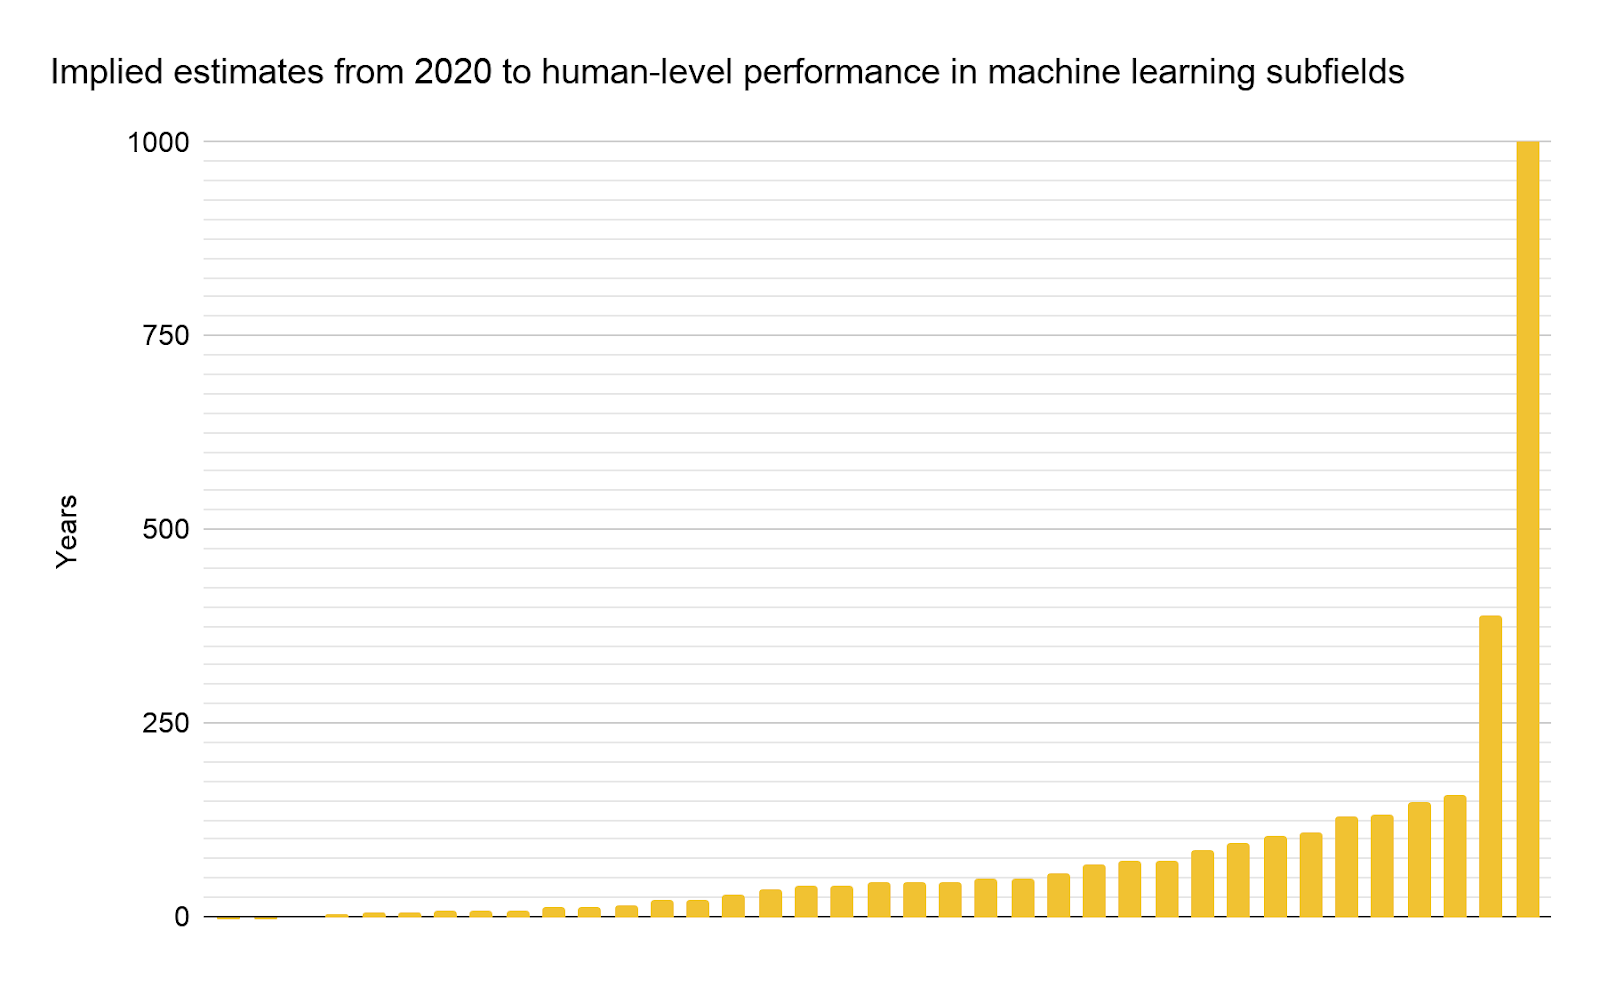Figure 4: Implied estimates for human-level performance based on respondents who specified narrow answers, e.g. “Natural language processing” when asked about their subfield. The last response is above 1000 but has been cut off.\nThe median implied estimate until human-level performance for machine learning broadly was 12 years sooner than the median estimate for specific subfields. This is counter to what we might expect, if human-level performance in machine learning broadly implies human-level performance on each individual subfield.\n\n\n##### Time spent in field\n\n\nRobin Hanson has suggested that his survey may get longer implied forecasts than 2016 ESPAI because he asks exclusively people who have spent at least 20 years in their field.[7](https://aiimpacts.org/surveys-on-fractional-progress-towards-hlai/#easy-footnote-bottom-7-2416 \"“One obvious difference is that I limited my sample to people who’d been in a field for at least 20 years. Can you try limiting your sample in that way, or at least looking at the correlation between time in field and their rate estimates?“
— From an email chain with Robin Hanson on February 15, 2020\") Filtering for people who have spent at least 20 years in their field, we have eight responses, and get a median implied time until HLAI of 142 years from 2020 (2162). Filtering for people who have spent at least 10 years in their field, we have 38 responses, and get a median implied time of 86 years (2106). Filtering for people who have spent less than 10 years in their field, we have 69 responses, and get a median implied time of 24 years (2044). Figures 5, 6 and 7 show estimates for each respondent, for each of these classes of time in field. \n\n\nFigure 5: Implied estimates for human-level performance based on respondents who were working on their subfield for at least 20 years. The last response is above 1000 but has been cut off.\nFigure 6: Implied estimates for human-level performance based on respondents who were working on their subfield for at least 10 years. The last three responses are above 1000 but have been cut off. \n\nFigure 7: Implied estimates for human-level performance based on respondents who were working on their subfield for less than 10 years. The last response is above 1000 but has been cut off.\n### Comparison of the two surveys\n\n\nThe median implied estimate from 2020 until human-level performance suggested by responses from 2016 ESPAI (36 years) is an order of magnitude smaller than the one suggested by the Hanson survey (372 years). This appears to be at least partly explained by more experienced researchers giving responses that imply longer estimates. Hanson asks exclusively people who have spent at least 20 years in their subfield, whereas the 2016 survey does not filter based on experience. If we filter 2016 survey respondents for researchers who have spent at least 20 years in their subfield we instead get a median estimate of 142 years. \n\n\n\nMore experienced researchers may generate longer implied estimates because the majority of progress has happened recently– many people think progress accelerated, which is some evidence of this. It could also be that less-experienced researchers feel that progress is more significant than it actually is. \n\n\n\nIf AI research is accelerating and is going to continue accelerating until we get to human-level AI, the time to HLAI may be sooner than these estimates. If AI research is accelerating now but is not representative of what progress will look like in the future, longer naive estimates by more experienced researchers may be more appropriate. \n\n\n\n### Comparison to estimates reached by other survey methods\n\n\n[2016 ESPAI](https://aiimpacts.org/2016-expert-survey-on-progress-in-ai/) also asked people to estimate time until human-level machine intelligence (HLMI) by asking them how many years they would give until a 50% chance of HLMI. The median answer for [this question](https://aiimpacts.org/2016-expert-survey-on-progress-in-ai/#Human-level_intelligence) in 2016 was 40 years, or 36 years from 2020 (2056), exactly the same as the median answer of 36 years implied by extrapolating fractional progress. The survey also asked about time to HLMI in other ways, which yielded [less consistent answers](https://aiimpacts.org/2016-expert-survey-on-progress-in-ai/#Answers). \n\n\n\n*Primary author: Asya Bergal* \n\n\n\nNotes\n-----\n\n", "url": "https://aiimpacts.org/surveys-on-fractional-progress-towards-hlai/", "title": "Surveys on fractional progress towards HLAI", "source": "aiimpacts.org", "source_type": "wordpress", "date_published": "2020-04-14T22:34:35+00:00", "paged_url": "https://aiimpacts.org/feed?paged=7", "authors": ["Asya Bergal"], "id": "0ad13bd2eb12a3eca1e106f8f03027d5", "summary": ["One way to predict AGI timelines is to ask experts to estimate what fraction of progress has been made over a fixed number of years, then to extrapolate to the full 100% of progress. Doing this with the [2016 expert survey](https://aiimpacts.org/2016-expert-survey-on-progress-in-ai/) yields an estimate of 2056 (36 years from now), while doing this with Robin Hanson's informal ~15-expert survey gives 2392 (372 years from now). Part of the reason for the discrepancy is that Hanson only asked experts who had been in their field for at least 20 years; restricting to just these respondents in the 2016 survey yields an estimate of 2162 (142 years from now)."]}
{"text": "2019 recent trends in Geekbench score per CPU price\n\nFrom 2006 – 2020, Geekbench score per CPU price has grown by around 16% a year, for rates that would yield an order of magnitude over roughly 16 years.\n\n\nDetails\n-------\n\n\nWe looked at Geekbench 5,[1](https://aiimpacts.org/2019-recent-trends-in-geekbench-score-per-cpu-price/#easy-footnote-bottom-1-2413 \"“Introducing Geekbench 5.” Geekbench 5 – Cross-Platform Benchmark. Accessed April 2, 2020. https://www.geekbench.com/.\") a benchmark for CPU performance. We combined Geekbench’s multi-core scores on its ‘Processor Benchmarks’ page[2](https://aiimpacts.org/2019-recent-trends-in-geekbench-score-per-cpu-price/#easy-footnote-bottom-2-2413 \"“Processor Benchmarks.” Processor Benchmarks – Geekbench Browser. Accessed April 14, 2020. https://browser.geekbench.com/processor-benchmarks.\") with release dates and prices that we scraped from Wikichip and Wikipedia.[3](https://aiimpacts.org/2019-recent-trends-in-geekbench-score-per-cpu-price/#easy-footnote-bottom-3-2413 \"Starting with Geekbench’s list of CPUs, we Googled ‘<CPU> Wikichip’ and ‘<CPU> Wikipedia’ to find lists of processor release dates and prices. We then copied Wikichip tables into this spreadsheet, tab ‘Wikichip / Wikipedia Information’, and used this script to parse CPU data from tables in individual Wikipedia pages before copying them into the same spreadsheet.\") All our data and plots can be found [here](https://docs.google.com/spreadsheets/d/1xP2ndDQYfrtC4IQQ35ndsf-Wam1078GC9wzFONE8jAk/edit?usp=sharing).[4](https://aiimpacts.org/2019-recent-trends-in-geekbench-score-per-cpu-price/#easy-footnote-bottom-4-2413 \"The ‘Geekbench Scores’ tab lists all the Geekbench CPU scores, while ‘Wikichip / Wikipedia Information’ stores all our scraped release dates and prices.\") We then calculated score per dollar and adjusted for inflation using the consumer price index.[5](https://aiimpacts.org/2019-recent-trends-in-geekbench-score-per-cpu-price/#easy-footnote-bottom-5-2413 \"“CPI Home.” U.S. Bureau of Labor Statistics. U.S. Bureau of Labor Statistics. Accessed April 14, 2020. https://www.bls.gov/cpi/.\") For every year, we calculated the 95th percentile score per dollar. We then fit linear and exponential trendlines to those scores. \n\n\n\nFigure 1 shows all our data for Geekbench score per CPU price. \n\n\n\n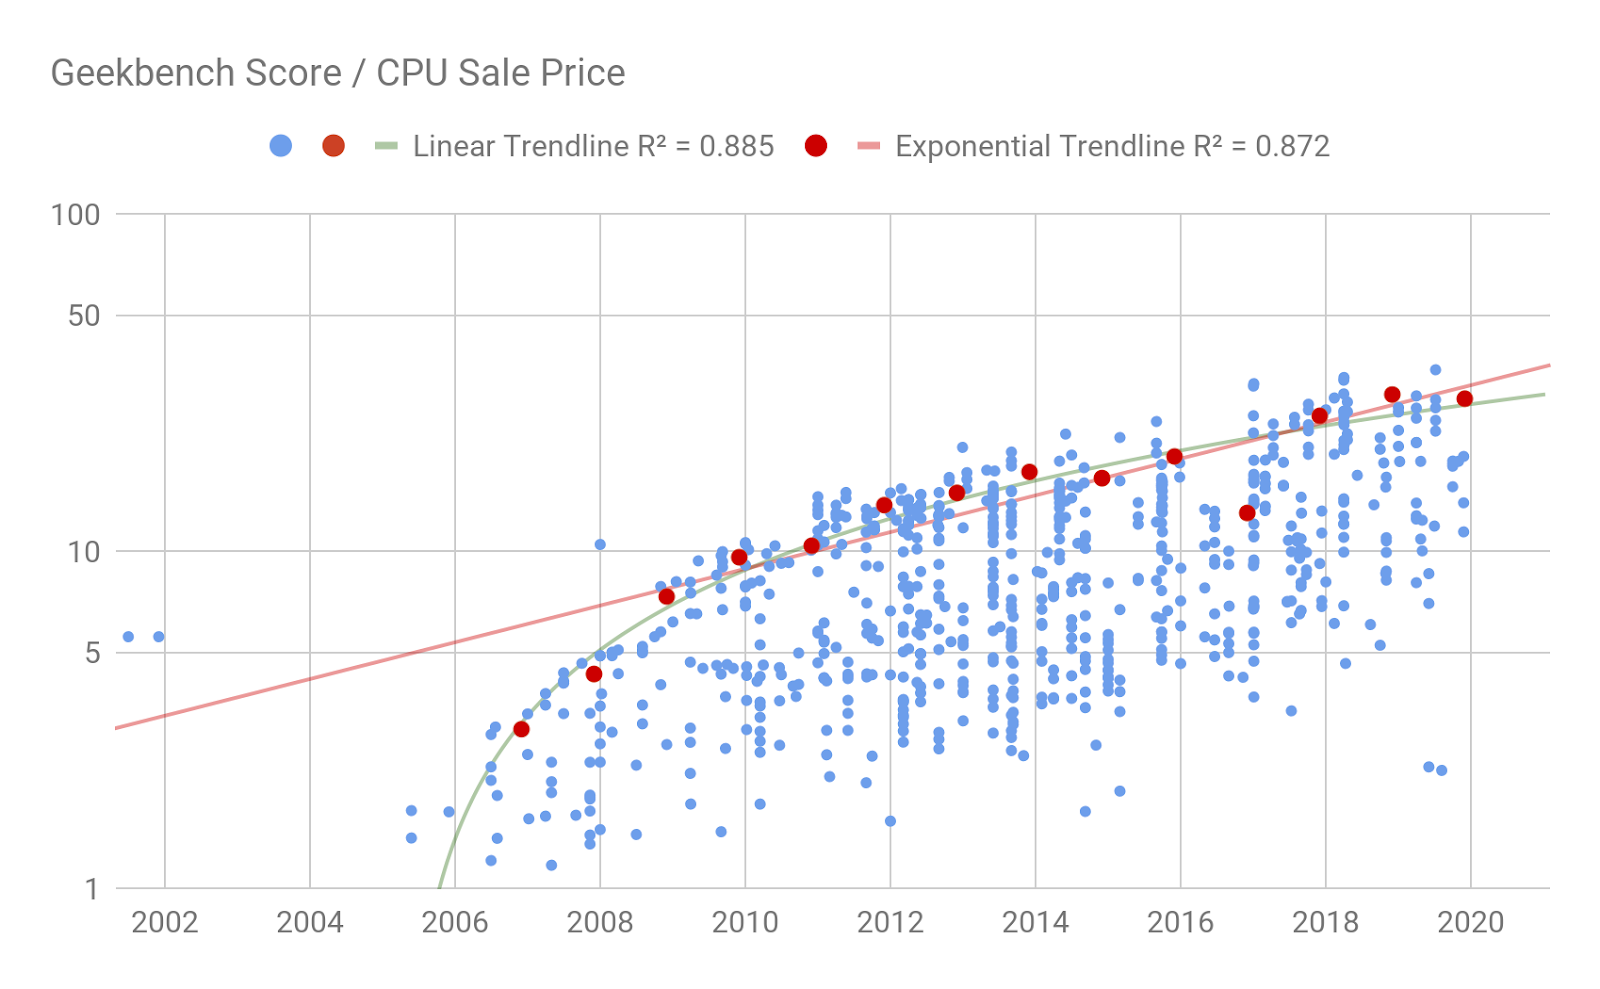Figure 1: Geekbench scores per CPU price, in 2019 dollars. Red dots denote the 95th percentile values in each year from 2006 – 2019 (we start at 2006 since we have <= 2 data points a year prior to then). The exponential trendline through the 95th percentiles is marked in red, while the linear trendline is marked in green. The vertical axis is log-scale.\nThe data is well-described by a linear or an exponential trendline. Assuming an exponential trend,[6](https://aiimpacts.org/2019-recent-trends-in-geekbench-score-per-cpu-price/#easy-footnote-bottom-6-2413 \"Where ambiguous, we assume these trends are exponential rather than linear, because our understanding is that that is much more common historically in computing hardware price trends.\") Geekbench score per CPU price grew by around 16% per year between 2006 and 2020, a rate that would yield a factor of ten every 16 years.[7](https://aiimpacts.org/2019-recent-trends-in-geekbench-score-per-cpu-price/#easy-footnote-bottom-7-2413 \"See this spreadsheet, sheet ‘Geekbench Scores’ for our calculations, which are next to the cell marked ‘Exponential trendline from 2006 – now’.\")\nThis is a markedly slower growth rate than those observed for [CPU price performance trends](https://aiimpacts.org/trends-in-the-cost-of-computing/) in the past, however since it is for a different performance metric to any used earlier, it is unclear how similar one should expect them to be– from 1940 to 2008, [Sandberg and Bostrom found](https://aiimpacts.org/trends-in-the-cost-of-computing/) that CPU price performance grew by a factor of ten every 5.6 years when measured in MIPS per dollar, and by a factor of ten every 7.7 years when measured in FLOPS per dollar.[8](https://aiimpacts.org/2019-recent-trends-in-geekbench-score-per-cpu-price/#easy-footnote-bottom-8-2413 \"See our Trends in the cost of computing page, section ‘Sandberg and Bostrom’.\")\n*Primary author: Asya Bergal*\n\n\nNotes\n-----\n\n\n\n\n\n", "url": "https://aiimpacts.org/2019-recent-trends-in-geekbench-score-per-cpu-price/", "title": "2019 recent trends in Geekbench score per CPU price", "source": "aiimpacts.org", "source_type": "wordpress", "date_published": "2020-04-14T21:11:41+00:00", "paged_url": "https://aiimpacts.org/feed?paged=7", "authors": ["Asya Bergal"], "id": "d5c82a38448b970f71e087d185f7eee4", "summary": []}
{"text": "Precedents for economic n-year doubling before 4n-year doubling\n\nThe only times gross world product appears to have doubled in *n* years without having doubled previously in 4*n* years were between 4,000 BC and 3,000 BC, and most likely between 10,000 BC and 4,000 BC.\n\n\nDetails\n-------\n\n\n### Background\n\n\nA key open question regarding AI risk is how quickly advanced artificial intelligence will ‘take off’, which is to say something like ‘go from being a small source of influence in the world to an overwhelming one’. \n\n\nIn *Superintelligence*[1](https://aiimpacts.org/precedents-for-economic-n-year-doubling-before-4n-year-doubling/#easy-footnote-bottom-1-2406 \" Bostrom, Nick. Superintelligence: Paths, Dangers, Strategies. 1 edition. Oxford: Oxford University Press, 2014.
The page notes that most of their data comes from J Bradford de Long’s dataset:
J. Bradford DeLong (24 May 1998). “Estimating World GDP, One Million B.C. – Present”. Retrieved 5 February 2013.\") and checked at each date how long it had taken for the economy to double, and whether it had always at some point doubled in as few as four times as many years prior to the start of that doubling.[4](https://aiimpacts.org/precedents-for-economic-n-year-doubling-before-4n-year-doubling/#easy-footnote-bottom-4-2406 \"[Note May 13 2020: This sheet is temporarily wrong.]
“Dynamic random-access memory (DRAM) is a type of random access semiconductor memory … One of the largest applications for DRAM is the main memory (colloquially called the “RAM”) in modern computers and graphics cards (where the “main memory” is called the graphics memory).”\n\n\n\n
“Dynamic Random-Access Memory.” Wikipedia. Wikimedia Foundation, March 24, 2020. https://en.wikipedia.org/wiki/Dynamic_random-access_memory.\")\nData\n----\n\n\nWe found two sources for historic pricing of DRAM. One was a dataset of DRAM prices and sizes from 1957 to 2018 collected by technologist and retired Computer Science professor[2](https://aiimpacts.org/trends-in-dram-price-per-gigabyte/#easy-footnote-bottom-2-2408 \"From his personal website:
“1998-2001 Associate Professor, National University of Singapore, School of Computing – Computer Science”.
“Biographical Information for Dr John C McCallum.” Biographical Information for Dr John C McCallum. Accessed April 14, 2020. http://jcmit.net/.\") John C. McCallum.[3](https://aiimpacts.org/trends-in-dram-price-per-gigabyte/#easy-footnote-bottom-3-2408 \"“Historical Memory Prices 1957+.” Accessed April 9, 2020. https://jcmit.net/memoryprice.htm.\") The other dataset was extracted from a graph generated by Objective Analysis,[4](https://aiimpacts.org/trends-in-dram-price-per-gigabyte/#easy-footnote-bottom-4-2408 \"We extracted data from the third graph in this blog post using the popular online tool WebPlotDigitizer to extract data. The graph is attributed to Objective Analysis, and appears to have been generated by the writer of the post, Jim Handy. (He explicitly says he generated previous graphs in the post.)
“DRAM Prices Hit Historic Low – The Memory Guy.” Accessed April 9, 2020. https://thememoryguy.com/dram-prices-hit-historic-low/.\") a group that sells “third-party independent market research and data” to investors in the semiconductor industry.[5](https://aiimpacts.org/trends-in-dram-price-per-gigabyte/#easy-footnote-bottom-5-2408 \"See here for their website.
“Objective Analysis – Semiconductor Market Research.” Accessed April 9, 2020. https://objective-analysis.com/.\") We have not checked where their data comes from and don’t have evidence about whether they are a trustworthy source. \n\n\n\nFigure 1 shows McCallum’s data.[6](https://aiimpacts.org/trends-in-dram-price-per-gigabyte/#easy-footnote-bottom-6-2408 \"See this spreadsheet, tab ‘McCallum Data’, for a copy of the dataset and resulting graph production.\")\n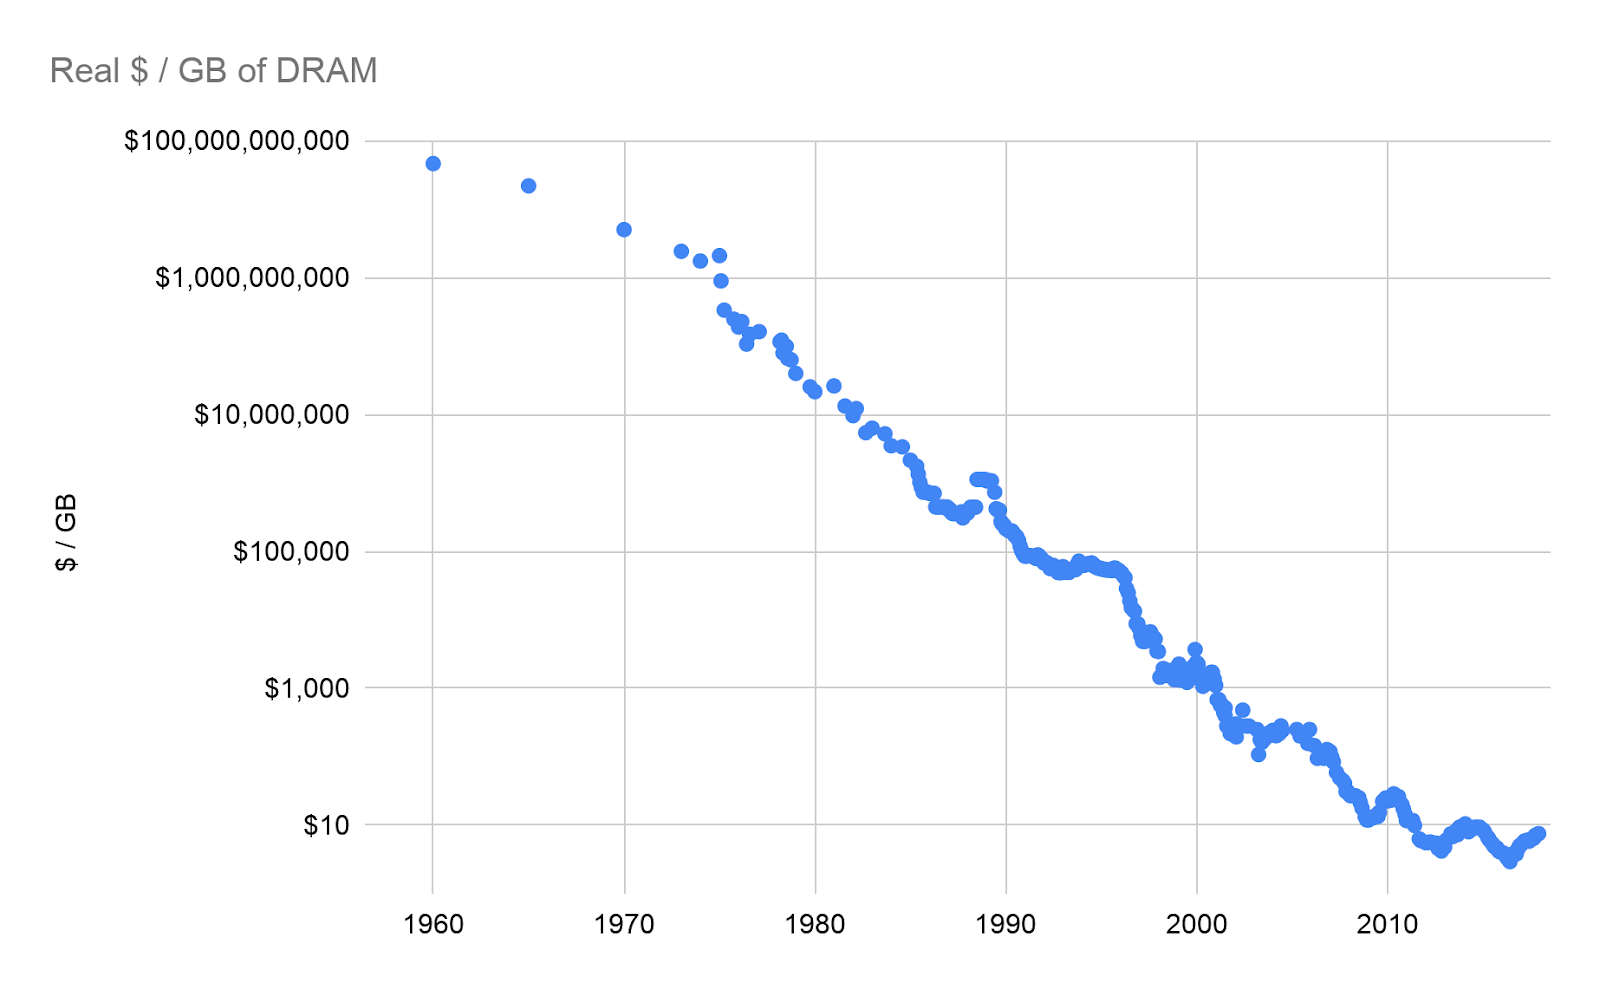Figure 1: Price per gigabyte of DRAM from 1957 to 2018 from John McCallum’s dataset, which we converted to 2020 dollars using the Consumer Price Index.[7](https://aiimpacts.org/trends-in-dram-price-per-gigabyte/#easy-footnote-bottom-7-2408 \"“CPI Home.” U.S. Bureau of Labor Statistics. U.S. Bureau of Labor Statistics. Accessed April 23, 2020. https://www.bls.gov/cpi/.\")\nFigure 2 shows the average price per gigabyte of DRAM from 1991 to 2019, according to the Objective Analysis graph.[8](https://aiimpacts.org/trends-in-dram-price-per-gigabyte/#easy-footnote-bottom-8-2408 \"See this spreadsheet, tab ‘Objective Analysis Data’, for a copy of the dataset and resulting graph production.\") \n\n\n\n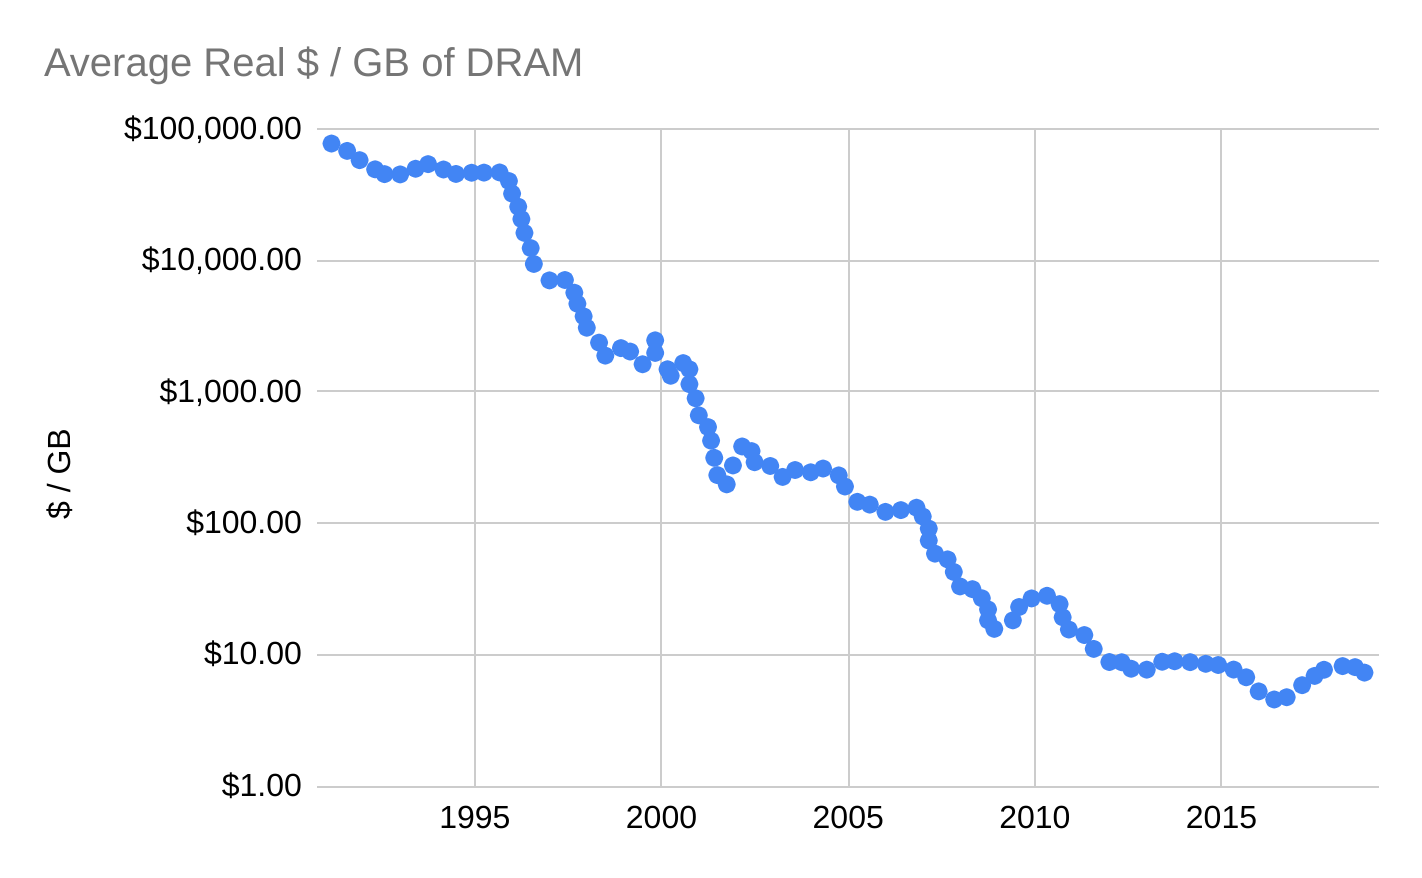Figure 2: Average $ / GB of DRAM from 1991 to 2019 according to Objective Analysis. Dollars are 2020 dollars.\nThe two datasets appear to line up (see Figure 3 below),[9](https://aiimpacts.org/trends-in-dram-price-per-gigabyte/#easy-footnote-bottom-9-2408 \"See the ‘Combined Data’ tab in this spreadsheet for graph generation.\") though we don’t know where the data in the Objective Analysis report came from– it could itself be referencing the McCallum dataset, or both could share data sources. \n\n\n\n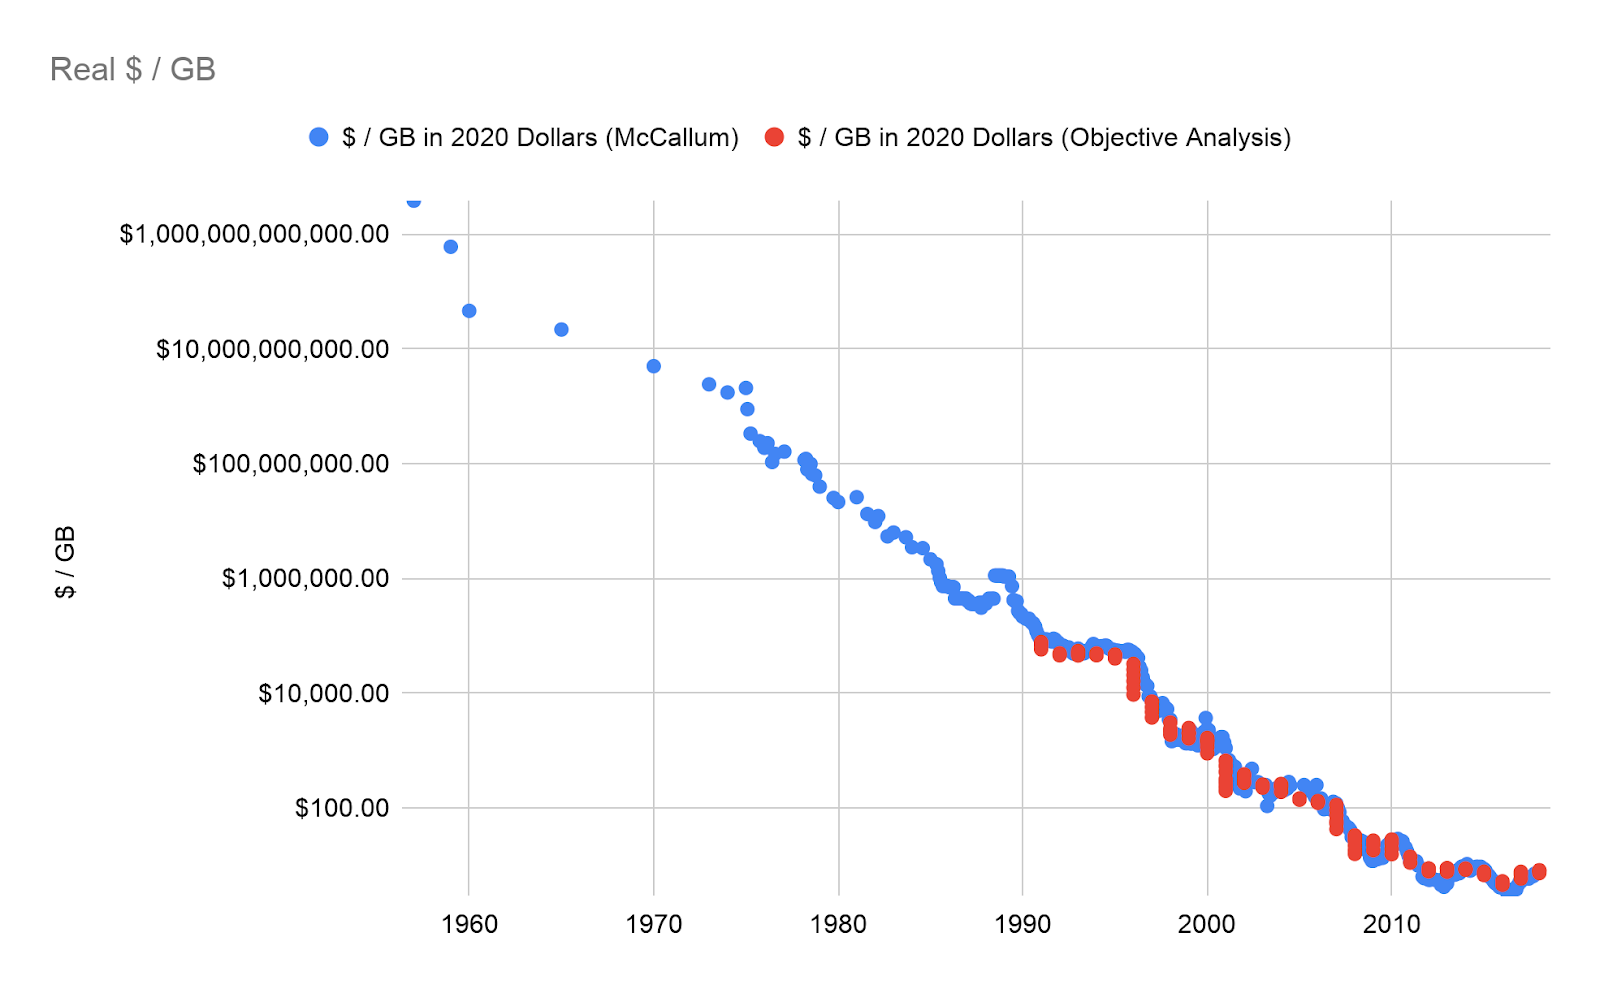Figure 3: $ / GB of DRAM from 1957 to 2018, with McCallum’s dataset in blue and the Objective Analysis dataset in red. Dollars are 2020 dollars.\nAnalysis\n--------\n\n\nFor both sources, the data appears to follow an exponential trendline. In the McCallum dataset, we calculate that the price / GB of DRAM has fallen at around 36% per year, for a factor of ten every 5.1 years and a doubling time of 1.5 years on average. The Objective Analysis data is similar, with the price / GB of DRAM falling around 33% per year, for a factor of ten every 5.8 years and a doubling time of 1.7 years. \n\n\n\nThe 1.5 and 1.7 year doubling times are close to the rate at which Moore’s law observed that transistors in an integrated circuit double.[10](https://aiimpacts.org/trends-in-dram-price-per-gigabyte/#easy-footnote-bottom-10-2408 \"From Wikipedia:
“Moore’s law is the observation that the number of transistors in a dense integrated circuit doubles about every two years.”
\n\n\n\n“Moore’s Law.” Wikipedia. Wikimedia Foundation, April 8, 2020. https://en.wikipedia.org/w/index.php?title=Moore’s_law&oldid=949708131.\") It seems possible to us that cheaper and denser transistors following this law are what enabled the cheaper prices of DRAM, though we haven’t investigated this theory.[11](https://aiimpacts.org/trends-in-dram-price-per-gigabyte/#easy-footnote-bottom-11-2408 \"Moore’s Law only refers to the number of transistors, but our impression is that people also sometimes refer to a Moore’s price performance law, which suggests that the cost per transistor falls at similar rates. From this post on Longbets:
\n\n\n\n“Moore’s Law, which has defined a doubling of price/performance/value produced by semi-conductors every 12 to 18 months since 1966, will continue to deliver its exponential benefits for at least another five decades, without stopping or slowing.”
\n\n\n\nRenan, Sheldon. “‘Moore’s Law, Which Has Defined a Doubling of Price/Performance/Value Produced by Semi-Conductors Every 12 to 18 Months since 1966, Will Continue to Deliver Its Exponential Benefits for at Least Another Five Decades, without Stopping or Slowing.”.” Long Bets. Accessed April 10, 2020. http://longbets.org/70/\") \n\n\n\nBoth datasets show slower progress in recent years. From 2010 onwards, the McCallum dataset falls in price by only 15% a year, for a rate that would yield a factor of ten every 14 years, and the Objective Analysis dataset falls by 12% a year, for a rate that would yield a factor of ten every 18.5 years.\n\n\n*Primary author: Asya Bergal*\n\n\nNotes\n=====\n\n\n\n\n\n", "url": "https://aiimpacts.org/trends-in-dram-price-per-gigabyte/", "title": "Trends in DRAM price per gigabyte", "source": "aiimpacts.org", "source_type": "wordpress", "date_published": "2020-04-14T20:03:46+00:00", "paged_url": "https://aiimpacts.org/feed?paged=7", "authors": ["Asya Bergal"], "id": "255af7ebf1a99a6878fa701083c79140", "summary": []} {"text": "Discontinuous progress in history: an update\n\n*By Katja Grace, 13 April 2020*\n\n\nI. The search for discontinuities\n---------------------------------\n\n\nWe’ve been looking for historic cases of discontinuously fast technological progress, to help with reasoning about the [likelihood](https://aiimpacts.org/likelihood-of-discontinuous-progress-around-the-development-of-agi/) and consequences of abrupt progress in AI capabilities. We recently finished expanding this investigation to 37 technological trends.[1](https://aiimpacts.org/discontinuous-progress-in-history-an-update/#easy-footnote-bottom-1-2389 \"Though we haven’t yet finished organizing to send bounties to people who earned them by sending us discontinuities. If this is you, you should hear from us soon; sorry for delay and thank you for your help.\") This blog post is a quick update on our findings. See [the main page on the research](http://aiimpacts.org/discontinuous-progress-investigation/) and its outgoing links for more details.\n\n\nWe found [ten events](http://aiimpacts.org/cases-of-discontinuous-technological-progress/) in history that abruptly and clearly contributed more to progress on some technological metric than another century would have seen on the previous trend.[2](https://aiimpacts.org/discontinuous-progress-in-history-an-update/#easy-footnote-bottom-2-2389 \"Note that an event can cause a discontinuity in many trends, but since arbitrarily many similar trends can be defined, the absolute number of events is more interesting. The number of discontinuities in trends is more meaningful as a fraction of trends considered.\") Or as we say, we found ten events that produced ‘large’, ‘robust’ ‘discontinuities’.\n\n\n[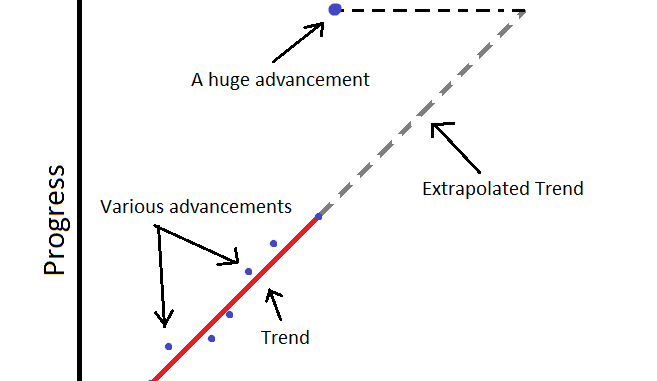](http://aiimpacts.org/wp-content/uploads/2020/04/DiscontinuityCartoon.png)How we measure the size of a discontinuity *(by Rick Korzekwa)*\nAnother five events caused robust discontinuities of between ten and a hundred years (‘moderate robust discontinuities’). And 48 more events caused some trend to depart from our best guess linear or exponential extrapolation of its past progress by at least ten years (and often a hundred), but did so in the context of such unclear past trends that this did not seem clearly remarkable.[3](https://aiimpacts.org/discontinuous-progress-in-history-an-update/#easy-footnote-bottom-3-2389 \"For instance, if a trend is noisy, short, sparse, or inconsistent, a departure from our best guess continuation of it is less surprising.\") I call all of these departures ‘discontinuities’, and distinguish those that are clearly outside plausible extrapolations of the past trend, according to my judgment, as ‘robust discontinuities’.[4](https://aiimpacts.org/discontinuous-progress-in-history-an-update/#easy-footnote-bottom-4-2389 \"If the trend is very ambiguous, then the jump has to be larger to be clearly outside of it. You can see my judgments in our meta-spreadsheet on the project, tab ‘Discontinuities’, column ‘Clear trend divergence?’.\")\nMuch of the data involved in this project seems at least somewhat unreliable, and the [methods](http://aiimpacts.org/methodology-for-discontinuity-investigation/) involve many judgments, and much ignoring of minor issues. So I would not be surprised if more effort could produce numerous small changes. However I expect the broad outlines to be correct.[5](https://aiimpacts.org/discontinuous-progress-in-history-an-update/#easy-footnote-bottom-5-2389 \"You can read about more of the complications on the methodology page. I have corrected enough errors that I can’t imagine there aren’t more. I wouldn’t be surprised if many details were corrected with more attention, and even if this list of robust discontinuous events among the the trends we considered changed by one or two items, but I would be surprised if it gained or lost more than three entries. Happily our question is about the rough landscape of very large effects, so small ambiguities are often unlikely to be relevant.
\nWith this in mind, I have tried to limit the effort spent on sorting out things like apparent anomalies in the details of sixteenth century cotton export records, and my guess is that we have nonetheless gone too far in the direction of sorting them out. This is a general research methodology issue I am unsure about.\")\nII. The discontinuities\n-----------------------\n\n\n### Large robust discontinuities\n\n\nHere is a quick list of the robust 100-year discontinuous events, which I’ll describe in more detail beneath:\n\n\n* The Pyramid of Djoser, 2650BC (discontinuity in [structure height trends](http://aiimpacts.org/discontinuity-from-the-burj-khalifa/))\n* The SS *Great Eastern*, 1858 (discontinuity in [ship size trends](http://aiimpacts.org/historic-trends-in-ship-size/))\n* The first telegraph, 1858 (discontinuity in [speed of sending a 140 character message across the Atlantic Ocean](http://aiimpacts.org/historic-trends-in-transatlantic-message-speed/))\n* The second telegraph, 1866 (discontinuity in [speed of sending a 140 character message across the Atlantic Ocean](http://aiimpacts.org/historic-trends-in-transatlantic-message-speed/))\n* The Paris Gun, 1918 (discontinuity in [altitude reached by man-made means](http://aiimpacts.org/discontinuity-in-altitude-records/))\n* The first non-stop transatlantic flight, in a modified WWI bomber, 1919 (discontinuity in both [speed of passenger travel across the Atlantic Ocean](http://aiimpacts.org/historic-trends-in-transatlantic-passenger-travel/) and [speed of military payload travel across the Atlantic Ocean](http://aiimpacts.org/historic-trends-in-long-range-military-payload-delivery/))\n* The George Washington Bridge, 1931 (discontinuity in [longest bridge span](http://aiimpacts.org/historic-trends-in-bridge-span-length/))\n* The first nuclear weapons, 1945 (discontinuity in [relative effectiveness of explosives](http://aiimpacts.org/discontinuity-from-nuclear-weapons/))\n* The first ICBM, 1958 (discontinuity in [average speed of military payload crossing the Atlantic Ocean](http://aiimpacts.org/historic-trends-in-long-range-military-payload-delivery/))\n* YBa2Cu3O7 as a superconductor, 1987 (discontinuity in [warmest temperature of superconduction](http://aiimpacts.org/historic-trends-in-the-maximum-superconducting-temperature/))\n\n\n#### The Pyramid of Djoser, 2650BC\n\n\n*Discontinuity in [structure height trends](http://aiimpacts.org/discontinuity-from-the-burj-khalifa/)*[6](https://aiimpacts.org/discontinuous-progress-in-history-an-update/#easy-footnote-bottom-6-2389 \"Tallest ever structure, tallest ever freestanding structure, and tallest freestanding structure at the time, but these trends all coincide until later.\")\nThe Pyramid of Djoser is [considered to be](https://en.wikipedia.org/wiki/Pyramid_of_Djoser) ‘the earliest colossal stone structure’ in Egypt. According to Wikipedia’s data, it took seven thousand years for the tallest structures to go from five to thirteen meters tall[7](https://aiimpacts.org/discontinuous-progress-in-history-an-update/#easy-footnote-bottom-7-2389 \"Though I’m actually now confused about the Anu Zigurrat only standing at 13m tall, since my understanding is that it was a flat structure supporting a temple which looks around as tall as it again. I don’t think this changes whether the Pyramid of Djoser is a big discontinuity.\") and then suddenly the Egyptian pyramids shot up to a height of 146.5m over about a hundred years and five successively tallest pyramids.\n\n\n[](http://aiimpacts.org/wp-content/uploads/2020/04/Saqqara_pyramid_ver_2-scaled.jpg)The Pyramid of Djoser, *By Charles J Sharp – Own work, from [Sharp Photography, sharpphotography](http://www.sharpphotography.co.uk/), [CC BY-SA 3.0](https://creativecommons.org/licenses/by-sa/3.0 \"Creative Commons Attribution-Share Alike 3.0\"), [Link](https://commons.wikimedia.org/w/index.php?curid=32434567)*\nThe first of these five is the Pyramid of Djoser, standing 62.5m tall. The second one—[Meidum Pyramid](https://en.wikipedia.org/wiki/Meidum)—is also a large discontinuity in structure height trends by our calculation, but I judge it not robust, since it is fairly unclear what the continuation of the trend should be after the first discontinuity. As is common, the more basic thing going on seems to be a change in the growth rate, and the discontinuity of the Pyramid of Djoser is just the start of it.\n\n\n[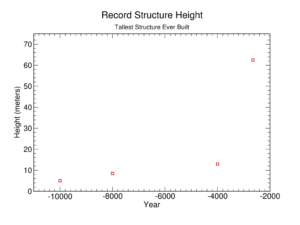](http://aiimpacts.org/wp-content/uploads/2020/04/Djoser.png)The Djoser discontinuity: close up on the preceding trend, cut off at the Pyramid of Djoser\n[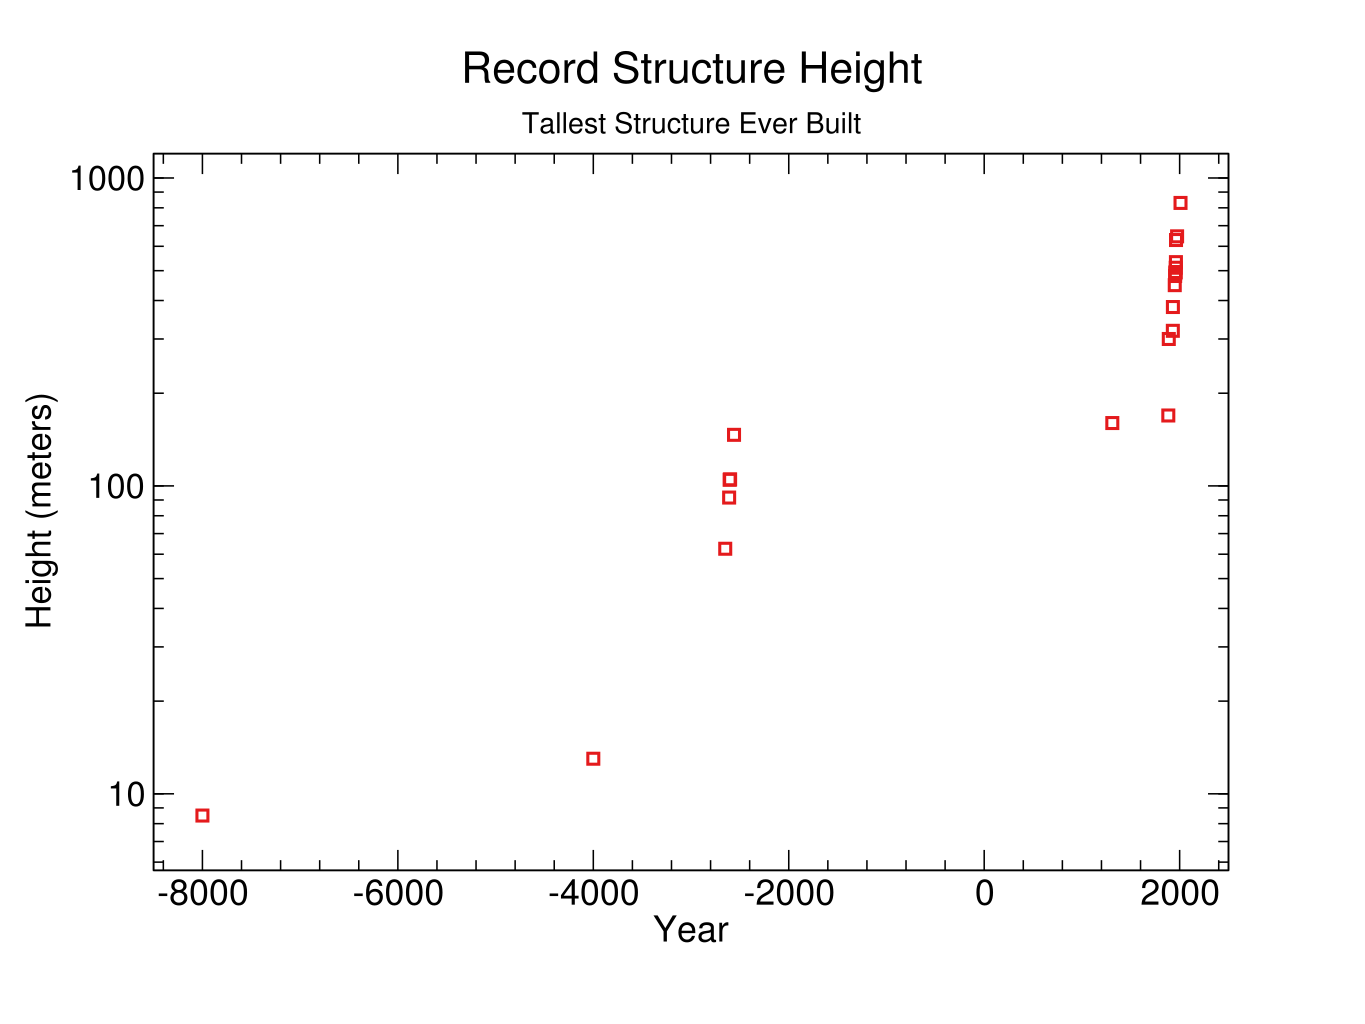](http://aiimpacts.org/wp-content/uploads/2020/01/StructureRecord.png)A longer history of record structure heights, showing the isolated slew of pyramids\nStrangely, after this spurt of progress, humanity built nothing taller than the tallest pyramid for nearly four thousand years—until [Lincoln Cathedral](https://en.wikipedia.org/wiki/Lincoln_Cathedral) in 1311—and nothing more than twenty percent taller than it until the Eiffel Tower in 1889.\n\n\n### The SS *Great Eastern*\n\n\n*Discontinuity in [ship size](http://aiimpacts.org/historic-trends-in-ship-size/), measured in ‘[builder’s old measurement](https://en.wikipedia.org/wiki/Builder%27s_Old_Measurement)’*[8](https://aiimpacts.org/discontinuous-progress-in-history-an-update/#easy-footnote-bottom-8-2389 \"apparently how cargo capacity used to be measured\") *or in displacement.*\n\n\nThe SS *Great Eastern* was a freakishly large ship. For instance, it seems to have weighed about five times as much as any previous ship. As far as I can tell, the reason it existed is that [Isambard Kingdom Brunell](https://en.wikipedia.org/wiki/Isambard_Kingdom_Brunel) thought it would be good. Brunell was a 19th Century engineering hero, rated #2 greatest Briton of all time in a 2002 [BBC poll](https://en.wikipedia.org/wiki/100_Greatest_Britons), who according to [Wikipedia](https://en.wikipedia.org/wiki/Isambard_Kingdom_Brunel), ‘revolutionised public transport and modern engineering’ and built ‘dockyards, the Great Western Railway (GWR), a series of steamships including the first propeller-driven transatlantic steamship, and numerous important bridges and tunnels’.\n\n\n[](http://aiimpacts.org/wp-content/uploads/2019/10/DisplacementGE.png)The SS *Great Eastern* compared to the UK Royal Navy’s ships of the line, which were probably not much smaller than the largest ships overall immediately prior to the *Great Eastern*\nThe experimental giant sailing steamship idea doesn’t seem to have gone well. The *Great Eastern* apparently never had its cargo holds filled, and ran at a deficit for years before being sold and used for laying the second telegraph cable (another source of large discontinuity—see below).[9](https://aiimpacts.org/discontinuous-progress-in-history-an-update/#easy-footnote-bottom-9-2389 \"“The huge cargo holds never were filled to capacity, and in 1864, after years of deficit operation, the ship was sold to the Great Eastern Steamship Company, which used it as a cable vessel until 1874” – Encyclopedia Britannica\") It was designed for transporting passengers to the Far East, but there was never the demand.[10](https://aiimpacts.org/discontinuous-progress-in-history-an-update/#easy-footnote-bottom-10-2389 \"Although designed to carry emigrants on the far Eastern run, the only passenger voyages Great Eastern made were in the Atlantic. Angus Buchanan, an historian of technology comments: “She was designed for the Far Eastern trade, but there was never sufficient traffic to put her into this. Instead, she was used in the transatlantic business, where she could not compete in speed and performance with similar vessels already in service.”” – Wikipedia\") It was [purportedly](https://historicaldigression.com/2011/03/28/the-great-eastern-a-cursed-modern-marvel/) rumored to be ‘cursed’, and suffered various ill fortune. On its maiden voyage a boiler exploded, throwing one of the funnels into the air and killing six people.[11](https://aiimpacts.org/discontinuous-progress-in-history-an-update/#easy-footnote-bottom-11-2389 \"On 9 September the ship had passed down the Thames, and out into the English Channel, and had just passed Hastings when there was a huge explosion, the forward deck blowing apart with enough force to throw the No. 1 funnel into the air, followed by a rush of escaping steam. Scott Russell and two engineers went below and ordered the steam to be blown off and the engine speed reduced. Five stokers died from being scalded by hot steam, while four or five others were badly injured and one had leapt overboard and had been lost.” – Wikipedia\") Later it hit a rock and got a 9-foot gash, which seems to have been hard to fix because the ship was too big for standard repair methods.[12](https://aiimpacts.org/discontinuous-progress-in-history-an-update/#easy-footnote-bottom-12-2389 \"”It was discovered that the rock had opened a gash in the ship’s outer hull over 9 feet (2.7 m) wide and 83 feet (25 m) long. The enormous size of Great Eastern precluded the use of any drydock repair facility in the US…”\")\nWe don’t have a whole trend for largest ships, so are using British Royal Navy [ship of the line](https://en.wikipedia.org/wiki/List_of_ships_of_the_line_of_the_Royal_Navy) size trends as a proxy against which to compare the *Great Eastern*.[13](https://aiimpacts.org/discontinuous-progress-in-history-an-update/#easy-footnote-bottom-13-2389 \"We know that the largest ship overall three years before the Great Eastern was a little bigger than the largest ship of the line, and don’t believe there were larger ships in between them. So we can reason that The Great Eastern represents at least roughly as big a discontinuity in total ship size as it would do in Royal Navy ship of the line size, if it were a royal navy ship of the line (which it was not). This is because the largest ships must have been at least as large as the Royal Navy ones, and the trends reached a similar point just before the Great Eastern, so the previous overall ship trend cannot have been much steeper on average than that of the Royal Navy.\") This gives us discontinuities of around 400 years in both displacement and tonnage ([BOM](https://en.wikipedia.org/wiki/Builder%27s_Old_Measurement)). [Added May 10: Nuño Sempere [also investigated](https://nunosempere.github.io/rat/Discontinuous-Progress.html) the Great Eastern as a discontinuity, and has some nice figures comparing it to passenger and sailing vessel trends.]\n[](http://aiimpacts.org/wp-content/uploads/2020/04/Great_Eastern-low-quality.jpg)[The SS *Great Eastern*](https://commons.wikimedia.org/wiki/File:Great_Eastern.jpg)\nHowever that is assuming we expect ship size to increase either linearly or exponentially (our usual expectation). But looking at the ship of the line trends, both displacement and cargo capacity (measured in tonnage, [BOM](https://en.wikipedia.org/wiki/Builder%27s_Old_Measurement)) seemed to grow at something closer to a hyperbolic curve for some reason—apparently accelerating toward an asymptote in the late 1860s. If we had expected progress to continue this way throughout, then neither trend had any discontinuities, instead of eight or eleven of them. And supposing that overall ship size follows the same hyperbola as the military ship trends, then the *Great Eastern*’s discontinuities go from around 400 years to roughly 11 or 13 years. Which doesn’t sound big, but since this was about that many years before of the asymptote of the hyperbola at which point arbitrarily large ships were theoretically expected, the discontinuities couldn’t have been much bigger.\n\n\nOur data ended for some reason just around the apparently impending ship size singularity of the late 1860s. But my impression is that not much happened for a while—it [apparently](https://aiimpacts.org/historic-trends-in-ship-size/) took forty years for a ship larger than the *Great Eastern* to be built, on many measures.\n\n\nI am unsure what to make of the apparently erroneous and unforced investment in the most absurdly enormous ship happening within a decade or two of the point at which trend extrapolation appears to have suggested arbitrarily large ships. Was Brunell aware of the trend? Did the forces that produced the rest of the trend likewise try to send all the players in the ship-construction economy up the asymptote, where they crashed into some yet unmet constraint? It is at least nice to have more examples of what happens when singularities are reached in the human world.\n\n\n### The first transatlantic telegraph\n\n\n*Discontinuity in [speed of sending a 140 character message across the Atlantic Ocean](http://aiimpacts.org/historic-trends-in-transatlantic-message-speed/)*\n\n\nUntil 1858, the fastest way to get a message from New York to London was by ship, and the fastest ships took over a week[14](https://aiimpacts.org/discontinuous-progress-in-history-an-update/#easy-footnote-bottom-14-2389 \"the record steamship speed of 14 knots would mean about nine days\"). Telegraph was [used earlier](https://en.wikipedia.org/wiki/Electrical_telegraph#Cooke_and_Wheatstone_system) on land, but running it between continents was quite an undertaking. The effort to lay the a transatlantic cable failed numerous times before it became ongoingly functional.[15](https://aiimpacts.org/discontinuous-progress-in-history-an-update/#easy-footnote-bottom-15-2389 \"Five attempts to lay a cable were made over a nine-year period – one in 1857, two in 1858, one in 1865, and one in 1866.\") One of those times though, it worked for about a month, and messages were sent.[16](https://aiimpacts.org/discontinuous-progress-in-history-an-update/#easy-footnote-bottom-16-2389 \"Test messages were sent from Newfoundland beginning August 10, 1858; the first successfully read at Valentia was on August 12…In September 1858, after several days of progressive deterioration of the insulation, the cable failed.” Wikipedia, Transatlantic telegraph cable\") There were celebrations in the streets.\n\n\n[](http://aiimpacts.org/wp-content/uploads/2020/04/H.M.S._“AGAMEMNON”_laying_cable.jpg)[H.M.S. “Agamemnon” laying the Atlantic Telegraph cable in 1858. A whale crosses the line](https://commons.wikimedia.org/wiki/File:H.M.S._%E2%80%9CAGAMEMNON%E2%80%9D_laying_cable.jpg), R. M. Bryson, lith from a drawing by R. Dudley, 1865\n[](http://aiimpacts.org/wp-content/uploads/2020/04/41_William_England_-_Atlantic_telegraph_jubilee_on_Broadway_New_York-scaled.jpg)[A celebration parade for the first transatlantic telegraph cable, Broadway, New York City](https://en.wikipedia.org/wiki/Transatlantic_telegraph_cable#/media/File:41_William_England_-_Atlantic_telegraph_jubilee_on_Broadway,_New_York.jpg)\nThe telegraph [could send](https://en.wikipedia.org/wiki/Transatlantic_telegraph_cable#First_contact) a 98 word message in a mere 16 hours. For a message of more than about 1400 words, it would actually have been faster to send it by ship (supposing you already had it written down). So this was a big discontinuity for short messages, but not necessarily any progress at all for longer ones.\n\n\n[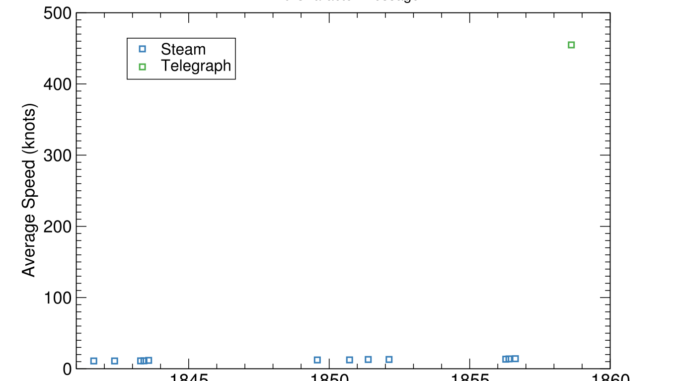](http://aiimpacts.org/wp-content/uploads/2020/04/FirstTele.png)The first transatlantic telegraph cable revolutionized 140 character message speed across the Atlantic Ocean\n### The second transatlantic telegraph\n\n\n*Discontinuity in [speed of sending a 140 character message across the Atlantic Ocean](http://aiimpacts.org/historic-trends-in-transatlantic-message-speed/)*\n\n\nAfter the first working transatlantic telegraph cable (see above) failed in 1858, it was another eight years before the second working cable was finished. Most of that delay was apparently for lack of support.[17](https://aiimpacts.org/discontinuous-progress-in-history-an-update/#easy-footnote-bottom-17-2389 \"“Field was undaunted by the failure. He was eager to renew the work, but the public had lost confidence in the scheme and his efforts to revive the company were futile. It was not until 1864 that, with the assistance of Thomas Brassey and John Pender, he succeeded in raising the necessary capital.” – Wikipedia\") and the final year seems to have been because the cable broke and the end was lost at sea after over a thousand miles had been laid, leaving the ship to return home and a new company to be established before the next try.[18](https://aiimpacts.org/discontinuous-progress-in-history-an-update/#easy-footnote-bottom-18-2389 \"“At noon on July 15, 1865, Great Eastern left the Nore for Foilhommerum Bay, Valentia Island, where the shore end was laid by Caroline. This attempt failed on July 31 when, after 1,062 miles (1968 km) had been paid out, the cable snapped near the stern of the ship, and the end was lost.[24]\n
Great Eastern steamed back to England, where Field issued another prospectus, and formed the Anglo-American Telegraph Company,[25] to lay a new cable and complete the broken one.” – Wikipedia\") Whereas it [sounds like](https://en.wikipedia.org/wiki/Transatlantic_telegraph_cable#Great_Eastern) it took less than a day to go from the ship carrying the cable arriving in port, and the sending of telegraphs.\n\n\n[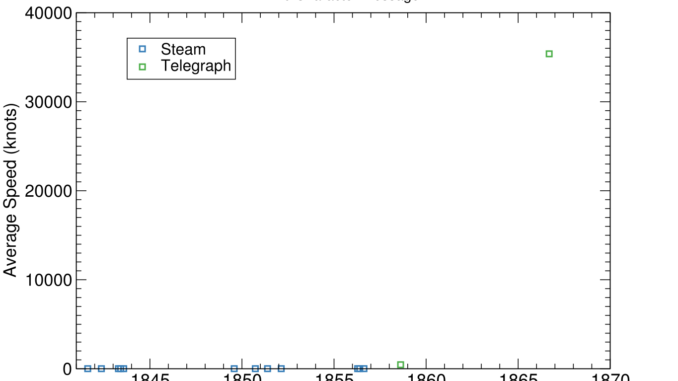](http://aiimpacts.org/wp-content/uploads/2020/04/SecondTele.png)The second telegraph discontinuity: close up on the preceding trend, cut off at the second telegraph. Note that the big discontinuity of the first telegraph cable is now almost invisible.\nAt a glance, on Wikipedia’s [telling](https://en.wikipedia.org/wiki/Transatlantic_telegraph_cable), it sounds as though the perseverance of one person—[Cyrus West Field](https://en.wikipedia.org/wiki/Cyrus_West_Field)—might have affected when fast transatlantic communication appeared by years. He seems to have led all five efforts, supplied substantial money himself, and ongoingly fundraised and formed new companies, even amidst a broader lack of enthusiasm after initial failures. (He was also [given a congressional gold medal](https://en.wikipedia.org/wiki/List_of_Congressional_Gold_Medal_recipients) for establishing the transatlantic telegraph cable, suggesting the US congress also has this impression.) His actions wouldn’t have affected how much of a discontinuity either telegraph was by much, but it is interesting if such a large development in a seemingly important area might have been accelerated much by a single person.\n\n\nThe second telegraph cable was laid by the *Great Eastern*, the discontinuously large ship of two sections ago. Is there some reason for these two big discontinuities to be connected? For instance, did one somehow cause the other? That doesn’t seem plausible. The main way I can think of that the transatlantic telegraph could have caused the *Great Eastern*‘s size would be if the economic benefits of being able to lay cable were anticipated and effectively subsidized the ship. I haven’t heard of this being an intended use for the *Great Eastern*. And given that the first transatlantic telegraph was not laid by the *Great Eastern*, it seems unlikely that such a massive ship was strictly needed for the success of a second one at around that time, though the second cable used [was apparently around twice as heavy as the first](https://en.wikipedia.org/wiki/Transatlantic_telegraph_cable#Failure_of_the_first_cable). Another possibility is that some other common factor made large discontinuities more possible. For instance, perhaps it was an unusually feasible time and place for solitary technological dreamers to carry out ambitious and economically adventurous projects.\n\n\n[](http://aiimpacts.org/wp-content/uploads/2020/04/Great_Eastern_1866.jpg)[*Great Eastern* again, this time at Heart’s Content, Newfoundland, where it carried the end of the second transatlantic telegraph cable in 1866](https://en.wikipedia.org/wiki/File:Great_Eastern_1866.jpg)\n### The first non-stop transatlantic flight\n\n\n*Discontinuity in both [speed of passenger travel across the Atlantic Ocean](http://aiimpacts.org/historic-trends-in-transatlantic-passenger-travel/) and [speed of military payload travel across the Atlantic Ocean](http://aiimpacts.org/historic-trends-in-long-range-military-payload-delivery/)*\n\n\nShips were the fastest way to cross the Atlantic Ocean until the end of World War I. Passenger liners had been getting incrementally faster for about eighty years, and the fastest regular passenger liner was given a special title, ‘[Blue Riband](https://en.wikipedia.org/wiki/Blue_Riband)‘. Powered heavier-than-air flight got started in 1903, but at first planes only traveled hundreds of feet, and it took time to expand that to the 1600 or so miles needed to cross the Atlantic in one hop.[19](https://aiimpacts.org/discontinuous-progress-in-history-an-update/#easy-footnote-bottom-19-2389 \"Crossing in many hops between boats was an option, though presumably fairly large hops would still be needed to be competitive. The first multi-leg transatlantic flight took place in 1919, a few weeks before the first non-stop one, and took more than ten days, though the biggest hop was more than half the ocean and only took about 15 hours.\")\nThe first non-stop transatlantic flight was made shortly after the end of WWI, in 1919. The Daily Mail [had offered](https://www.aerosociety.com/news/the-great-transatlantic-race/) a large cash prize, on hold during the war, and with the resumption of peace, [a slew](https://www.aerosociety.com/news/the-great-transatlantic-race/) of competitors prepared to fly. [Alcock and Brown](https://en.wikipedia.org/wiki/Transatlantic_flight_of_Alcock_and_Brown) were the first to do it successfully, in a modified bomber plane, taking around 16 hours, for an average speed around four times faster than the Blue Riband.\n\n\n[](http://aiimpacts.org/wp-content/uploads/2020/04/Alcock-Brown-Clifden.jpg)[Alcock and Brown landed in Irelend, 1919](https://en.wikipedia.org/wiki/Transatlantic_flight#/media/File:Alcock-Brown-Clifden.jpg)\nOne might expect discontinuities to be especially likely in a metric like ‘speed to cross the Atlantic’, which involves a sharp threshold on a non-speed axis for inclusion in the speed contest. For instance if planes incrementally improved on speed and range (and cost and comfort) every year, but couldn’t usefully cross the ocean at all until their range reached 1600 miles, then decades of incremental speed improvements could all hit the transatlantic speed record at once, when the range reaches that number.\n\n\nIs this what happened? It looks like it. The Wright Flyer [apparently](https://en.wikipedia.org/wiki/Wright_Flyer#Specifications_(Wright_Flyer)) had a maximum speed of 30mph. That’s about the record average ocean liner speed in 1909. So if the Wright Flyer had had the range to cross the Atlantic in 1903 at that speed, it would have been about six years ahead of the ship speed trend and wouldn’t have registered as a substantial discontinuity. [20](https://aiimpacts.org/discontinuous-progress-in-history-an-update/#easy-footnote-bottom-20-2389 \"This is ignoring the difference between maximum momentary speed and maximum average speed over thousands of miles—judging the Wright Flyer and the ocean liners consistently on one or the other of these, the Wright Flyer was probably not ahead of the trend at all.\") But because it didn’t have the range, and because the speed of planes was growing faster than that of ships, in 1919 when planes could at last fly thousands of miles, they were way ahead of ships.\n\n\n[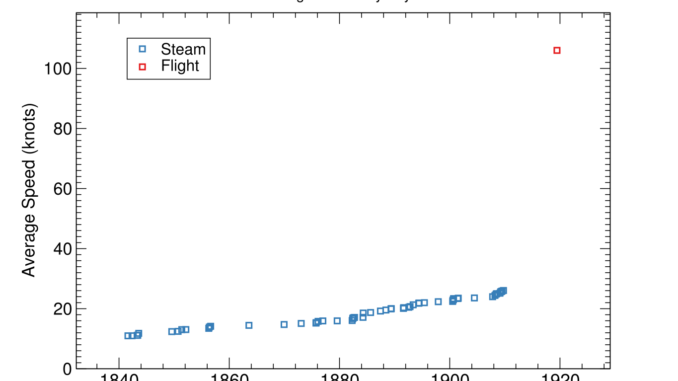](http://aiimpacts.org/wp-content/uploads/2020/04/TAFlight.png)The transatlantic flight discontinuity: close up on the preceding trend, cut off at the first non-stop transatlantic flight.\n### The George Washington Bridge\n\n\n*Discontinuity in [longest bridge span](http://aiimpacts.org/historic-trends-in-bridge-span-length/)*\n\n\nA bridge ‘[span](https://en.wikipedia.org/wiki/Span_(engineering))‘ is the distance between two intermediate supports in a bridge. The history of bridge span length is not very smooth, and so arguably full of discontinuities, but the only bridge span that seems clearly way out of distribution to me is the main span of the [George Washington Bridge](https://en.wikipedia.org/wiki/George_Washington_Bridge). (See below.)\n\n\n[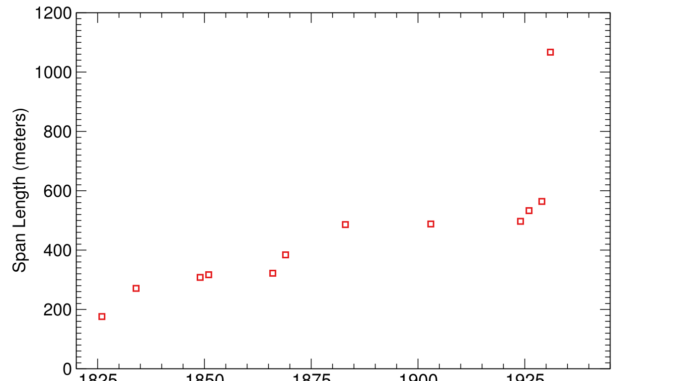](http://aiimpacts.org/wp-content/uploads/2020/04/GWBridge.png)The George Washington Bridge discontinuity: close up on the preceding trend, cut off at the George Washington Bridge\nI’m not sure what made it so discontinuously long, but it is notably also the world’s busiest motor vehicle bridge ([as of 2016](https://en.wikipedia.org/wiki/George_Washington_Bridge)), connecting New York City with New Jersey, so one can imagine that it was a very unusually worthwhile expanse of water to cross. Another notable feature of it was that it was much thinner relative to its length than long suspension bridges normally were, and lacked the usual ‘trusses’, based on a new theory of bridge design.[21](https://aiimpacts.org/discontinuous-progress-in-history-an-update/#easy-footnote-bottom-21-2389 \"“When the upper deck was built, it was only 12 feet (3.7 m) thick without any stiffening trusses on the sides, and it had a length-to-thickness ratio of about 350 to 1.[11]:59, 61 At the time of the George Washington Bridge’s opening, most long suspension spans had stiffening trusses on their sides, and spans generally had a length-to-thickness ratio of 60 to 1.[11]:63[24] During the planning process, Ammann designed the deck around the “deflection theory”, an as-yet-unconfirmed assumption that longer suspension decks did not need to be as stiff in proportion to its length, because the weight of the longer deck itself would provide a counterweight against the deck’s movement.” – Wikipedia\")\n[](http://aiimpacts.org/wp-content/uploads/2020/04/George_Washington_Bridge_NY.jpeg)George Washington Bridge, [via Wikimedia Commons, Photographer: Bob Jagendorf](https://commons.wikimedia.org/wiki/File:George_Washington_Bridge_NY.JPG)\n### Nuclear weapons\n\n\n*Discontinuity in [relative effectiveness of explosives](http://aiimpacts.org/discontinuity-from-nuclear-weapons/)*\n\n\nThe ‘[relative effectiveness factor](https://en.wikipedia.org/wiki/TNT_equivalent#Relative_effectiveness_factor)‘ of an explosive is how much TNT you would need to do the same job.[22](https://aiimpacts.org/discontinuous-progress-in-history-an-update/#easy-footnote-bottom-22-2389 \"This is somewhat ambiguous, since there are different jobs, but since we are talking here about factors of more than a thousand, that probably isn’t important.\") Pre-nuclear explosives had traversed the range of relative effectiveness factors from around 0.5 to 2 over about a thousand years, when in 1945 the first nuclear weapons came in at a relative effectiveness of [around 4500](https://en.wikipedia.org/wiki/TNT_equivalent#Nuclear_examples)[23](https://aiimpacts.org/discontinuous-progress-in-history-an-update/#easy-footnote-bottom-23-2389 \"for Fat Man, not the first, but close\").\n\n\n[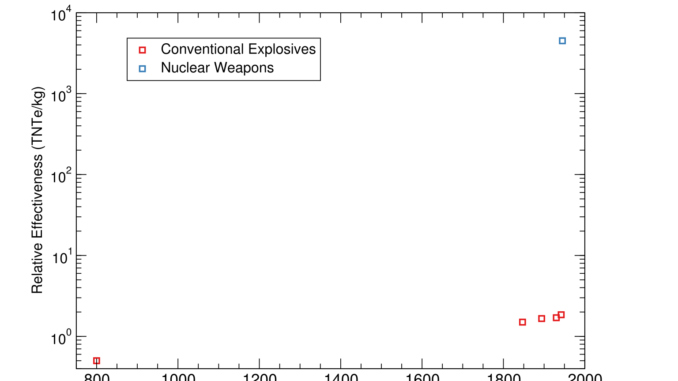](http://aiimpacts.org/wp-content/uploads/2020/04/RelativeEffectiveness.png)The nuclear weapons discontinuity: close up on the preceding trend, cut off at the first nuclear weapons\nA few characteristics of nuclear weapons that could relate to their discontinuousness:\n\n\n* **New physical phenomenon**: nuclear weapons are based on [nuclear fission](https://en.wikipedia.org/wiki/Nuclear_fission#Discovery_of_nuclear_fission), which was recently discovered, and allowed human use of nuclear energy (which exploits the strong fundamental force) whereas past explosives were based on chemical energy (which exploits the electromagnetic force). New forms of energy are rare in human history, and nuclear energy stored in a mass is characteristically much higher than chemical energy stored in it.\n* **Massive investment**: the Manhattan Project, which developed the first nuclear weapons, cost around [$23 billion in 2018 dollars](https://en.wikipedia.org/wiki/Manhattan_Project). This was presumably a sharp increase over previous explosives research spending.\n* **Late understanding**: it looks like nuclear weapons were only understood as a possibility after it was well worth trying to develop them at a huge scale.\n* **Mechanism involves a threshold**: nuclear weapons are based on nuclear chain reactions, which require a [critical mass](https://en.wikipedia.org/wiki/Critical_mass) of material (how much varies by circumstance).\n\n\nI discussed whether and how these things might be related to the discontinuity in 2015 [here](https://aiimpacts.org/whats-up-with-nuclear-weapons/) (see Gwern’s comment) and [here](https://aiimpacts.org/ai-and-the-big-nuclear-discontinuity/).\n\n\n[](http://aiimpacts.org/wp-content/uploads/2020/04/Trinity_-_Jumbo_brought_to_site.jpg)[Preparation for the Trinity Test, the first detonation of a nuclear weapon](https://commons.wikimedia.org/wiki/File:Trinity_-_Jumbo_brought_to_site.jpg)\n[](http://aiimpacts.org/wp-content/uploads/2020/04/Trinity_-_Explosion_15s.jpg)[The trinity test explosion after 15 seconds](https://commons.wikimedia.org/wiki/File:Trinity_-_Explosion_15s.jpg)\n### The Paris Gun\n\n\n*Discontinuity in [altitude reached by man-made means](http://aiimpacts.org/discontinuity-in-altitude-records/)*\n\n\nThe [Paris Gun](https://en.wikipedia.org/wiki/Paris_Gun) was the largest artillery gun in WWI, used by the Germans to bomb Paris from 75 miles away. It could shoot 25 miles into the air, whereas the previous record we know of was around 1 mile into the air (also shot by a German gun).[24](https://aiimpacts.org/discontinuous-progress-in-history-an-update/#easy-footnote-bottom-24-2389 \"For smaller weapons, we often use the height they could theoretically reach if pointed straight up, regardless of whether we know of any specific occasion when that happened. For rare, immobile weapons like the Paris gun, we assume they were never shot straight upward, and use either written records of their maximum altitude, or the altitude implied by projectile motion at the optimal or recorded angle, traveling their range.\")\n[](http://aiimpacts.org/wp-content/uploads/2020/04/Parisgesch1.jpeg)[The Paris Gun](https://en.wikipedia.org/wiki/Paris_Gun#/media/File:Parisgesch1.JPG), able to [shell Paris from 75 miles away](https://en.wikipedia.org/wiki/Paris_Gun)\n[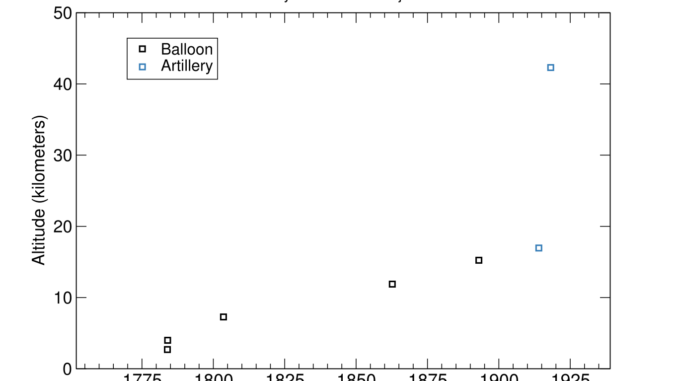](http://aiimpacts.org/wp-content/uploads/2020/04/ParisGunkm.png)The Paris Gun discontinuity: close up on the preceding trend of highest altitudes reached by man-made means, cut off at the Paris Gun\nI don’t have much idea why the Paris Gun traveled so much higher than previous weapons. [Wikipedia](https://en.wikipedia.org/wiki/Paris_Gun) suggests that its goals were psychological rather than physically effective warfare:\n\n\n\n> \n> As military weapons, the Paris Guns were not a great success: the payload was small, the barrel required frequent replacement, and the guns’ accuracy was good enough for only city-sized targets. The German objective was to build a psychological weapon to attack the morale of the Parisians, not to destroy the city itself.\n> \n> \n> \n\n\nThis might explain an unusual trade-off of distance (and therefore altitude) against features like accuracy and destructive ability. On this story, building a weapon to shoot a projectile 25 miles into the air had been feasible for some time, but wasn’t worth it. This highlights the more general possibility that the altitude trend was perhaps more driven by the vagaries of demand for different tangentially-altitude-related ends than by technological progress.\n\n\nThe German military [apparently](https://en.wikipedia.org/wiki/Paris_Gun) dismantled the Paris Guns before departing, and did not comply with a Treaty of Versailles requirement to turn over a complete gun to the Allies, so the guns’ capabilities are not known with certainty. However it sounds like the shells were clearly observed in Paris, and the relevant gun was clearly observed around 70 miles away, so the range is probably not ambiguous, and the altitude reached by a projectile is closely related to the range. So uncertainty around the gun probably doesn’t affect our conclusions.\n\n\n### The first intercontinental ballistic missiles (ICBMs)\n\n\n*Discontinuity in [average speed of military payload crossing the Atlantic Ocean](http://aiimpacts.org/historic-trends-in-long-range-military-payload-delivery/)*\n\n\nFor most of history, the fastest way to send a military payload across the Atlantic Ocean was to put it on a boat or plane, much like a human passenger. So the [maximum speed of sending a military payload across the Atlantic Ocean](http://aiimpacts.org/historic-trends-in-long-range-military-payload-delivery/) followed the [analogous passenger travel trend](http://aiimpacts.org/historic-trends-in-transatlantic-passenger-travel/). However in August 1957, the two abruptly diverged with the [first successful test](https://en.wikipedia.org/wiki/Intercontinental_ballistic_missile#Cold_War) of an intercontinental ballistic missile (ICBM)—the Russian [R-7 Semyorka](https://en.wikipedia.org/wiki/R-7_Semyorka). Early ICBMs traveled at around 11 thousand miles per hour, taking the minimum time to send a military payload between Moscow and New York for instance from around 14 hours to around 24 minutes.[25](https://aiimpacts.org/discontinuous-progress-in-history-an-update/#easy-footnote-bottom-25-2389 \"Based on my rough calculations using distance and speed, not including other steps in military payload sending processes.\")\n[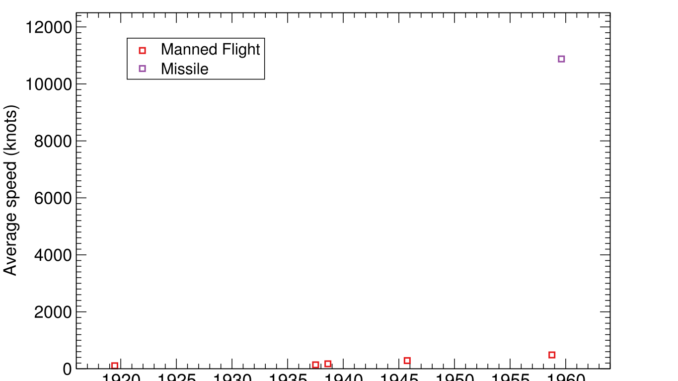](http://aiimpacts.org/wp-content/uploads/2020/04/ICBM.png)The ICBM discontinuity: close up on the preceding trend, cut off at the first ICBM\nA ‘[ballistic](https://en.wikipedia.org/wiki/Ballistic_missile)‘ missile is unpowered during most of its flight, and so follows a [ballistic trajectory](https://en.wikipedia.org/wiki/Projectile_motion)—the path of anything thrown into the air. Interestingly, this means that in order to go far enough to traverse the Atlantic, it has to be going a certain speed. Ignoring the curvature of the Earth or friction, this would be about 7000 knots for the shortest transatlantic distance—70% of its actual speed, and enough to be hundreds of years of discontinuity in the late 50s.[26](https://aiimpacts.org/discontinuous-progress-in-history-an-update/#easy-footnote-bottom-26-2389 \"Incidentally, the actual speed of the first ICBM looks like roughly what you need to get range from Russia to the USA, by my simple calculations, ignoring earth curvature.\") So assuming ballistic missiles crossed the ocean when they did, they had to produce a large discontinuity in the speed trend.\n\n\nDoes this mean the ICBM was required to be a large discontinuity? No—there would be no discontinuity if rockets were improving in line with planes, and so transatlantic rockets were developed later, or ICBM-speed planes earlier. But it means that even if the trends for rocket distance and speed are incremental and start from irrelevantly low numbers, if they have a faster rate of growth than planes, and the threshold in distance required implies a speed way above the current record, then a large discontinuity must happen\n\n\nThis situation also means that you could plausibly have predicted the discontinuity ahead of time, if you were watching the trends. Seeing the rocket speed trend traveling upward faster than the plane speed trend, you could forecast that when it hit a speed that implied an intercontinental range, intercontinental weapons delivery speed would jump upward.\n\n\n[](http://aiimpacts.org/wp-content/uploads/2020/04/Atlas-B_ICBM.jpg)[An SM-65 Atlas, the first US ICBM, first launched in 1957](https://en.wikipedia.org/wiki/Intercontinental_ballistic_missile#/media/File:Atlas-B_ICBM.jpg) (1958 image)\n### YBa2Cu3O7 as a superconductor\n\n\n*Discontinuity in* [*warmest temperature of superconduction*](http://aiimpacts.org/historic-trends-in-the-maximum-superconducting-temperature/)\n\n\nWhen an ordinary material conducts electricity, it has some [resistance](https://en.wikipedia.org/wiki/Electrical_resistance_and_conductance) (or opposition to the flow of electrons) which [takes](https://en.wikipedia.org/wiki/Electrical_resistance_and_conductance) energy to overcome. The resistance can be gradually lowered by cooling the material down. For some materials though, there is a temperature threshold below which their resistance abruptly drops to zero, meaning for instance that electricity can flow through them indefinitely with no input of energy. These are ‘[superconductors](https://en.wikipedia.org/wiki/Superconductivity)‘.\n\n\nSuperconductors were [discovered](https://en.wikipedia.org/wiki/Superconductivity) in 1911. [The first one observed](https://en.wikipedia.org/wiki/Superconductivity#History_of_superconductivity), mercury, could superconduct below 4.2 Kelvin. From then on, more superconductors were discovered, and the warmest observed temperatures of superconduction gradually grew. In 1957, [BCS theory](https://en.wikipedia.org/wiki/BCS_theory) was developed to explain the phenomenon (winning its authors a Nobel Prize), and [was understood](https://en.wikipedia.org/wiki/Superconductivity#High-temperature_superconductivity) to rule out superconduction above temperatures of around 30K. But [in 1986](https://en.wikipedia.org/wiki/Superconductivity#High-temperature_superconductivity) a new superconductor was found with a threshold temperature around 30K, and composed of a surprising material: a ‘ceramic’ involving oxygen rather than an alloy.[27](https://aiimpacts.org/discontinuous-progress-in-history-an-update/#easy-footnote-bottom-27-2389 \"“What Bednorz and Müller did was to abandon the “conventional” materials – alloys of different composition. Since 1983 they have concentrated on oxides which, apart from containing oxygen, include copper and one or more of the rare earth metals. The new idea was that the copper atoms in a material of this kind could be made to transport electrons, which interact more strongly with the surrounding crystal than they do in normal electrical conductors. To obtain a chemically stable material the two researchers added barium to crystals or lanthanum-copper-oxide to produce a ceramic material that became the first successful “hightemperature” [sic] superconductor.”
\nNobelPrize.org. “The Nobel Prize in Physics 1987.” Accessed April 12, 2020. https://www.nobelprize.org/prizes/physics/1987/summary/. \") This also [won](https://www.nobelprize.org/prizes/physics/1987/press-release/) a Nobel Prize, and instigated a rapid series of discoveries in similar materials—’[cuprates](https://en.wikipedia.org/wiki/Cuprate_superconductor)‘—which shot the highest threshold temperatures to around 125 K by 1988 (before continued upward).\n\n\n[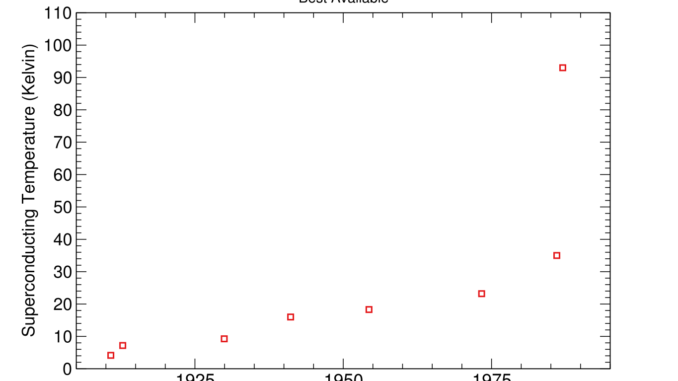](http://aiimpacts.org/wp-content/uploads/2020/04/YBa2Cu3O7.png)The high temperature superconductor discontinuity: close up on the preceding trend, cut off at [YBa2Cu3O7](https://en.wikipedia.org/wiki/Yttrium_barium_copper_oxide)\nThe first of the cuprates, LaBaCuO4, seems mostly surprising for theoretical reasons, rather than being radically above the temperature trend.[28](https://aiimpacts.org/discontinuous-progress-in-history-an-update/#easy-footnote-bottom-28-2389 \"We do measure it as a 26 year discontinuity, but it doesn’t seem robust, because the trend wasn’t all that even beforehand.\") The big jump came the following year, from [YBa2Cu3O7](https://en.wikipedia.org/wiki/Yttrium_barium_copper_oxide), with its threshold at over 90 K.[29](https://aiimpacts.org/discontinuous-progress-in-history-an-update/#easy-footnote-bottom-29-2389 \"We have this as the second discovery, but I notice that this figure shows another one in between. Different sources also seem to list slightly different temperatures and chemical names for many of these records. None of this seems likely to change the conclusion that there was a large discontinuity from around 30K to around 90K in around 1987 involving something called roughly YBaCuO, which was an early cuprate but not the first.\")\nThis seems like a striking instance of the story where the new technology doesn’t necessarily cause a jump so much as a new rate of progress. I wonder if there was a good reason for the least surprising cuprate to be discovered first. My guess is that there were many unsurprising ones, and substances are only famous if they were discovered before more exciting substances.\n\n\n[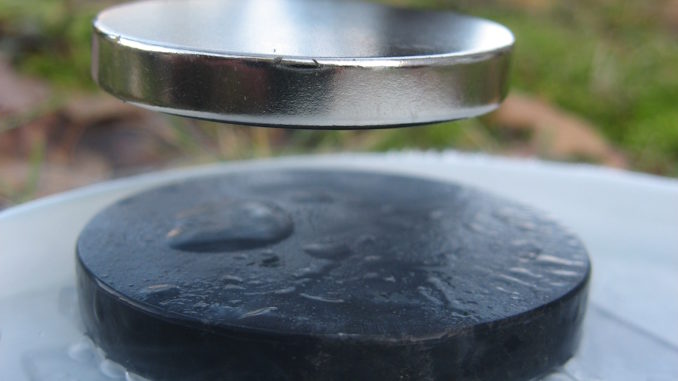](http://aiimpacts.org/wp-content/uploads/2020/04/Stable_Levitation_of_a_magnet_on_a_superconductor-scaled.jpg)[Magnet levitating on top of a superconductor of YBa2Cu3O7 cooled to merely -196°C (77.15 Kelvin)](https://commons.wikimedia.org/wiki/File:Stable_Levitation_of_a_magnet_on_a_superconductor.jpg) Superconductors can allow magnetic levitation, [consistently repelling](https://en.wikipedia.org/wiki/Superdiamagnetism) permanent magnets [while stably pinned in place](https://en.wikipedia.org/wiki/Flux_pinning). (Picture: [Julien Bobroff (user:Jubobroff), Frederic Bouquet (user:Fbouquet), LPS, Orsay, France](https://commons.wikimedia.org/wiki/File:Stable_Levitation_of_a_magnet_on_a_superconductor.jpg \"via Wikimedia Commons\") / [CC BY-SA](https://creativecommons.org/licenses/by-sa/3.0))\nIt is interesting to me that this is associated with a substantial update in very basic science, much like nuclear weapons. I’m not sure if that makes basic science updates ripe for discontinuity, or if there are just enough of them that some would show up in this list. (Though glancing at [this list](https://en.wikipedia.org/wiki/Timeline_of_scientific_discoveries#20th_century) suggests to me that there were about 70 at this level in the 20th Century, and probably many fewer immediately involving a new capability rather than e.g. an increased understanding of pulsars. Penicillin also makes that list though, and we didn’t find any discontinuities it caused.)\n\n\nModerate robust discontinuities (10-100 years of extra progress):\n-----------------------------------------------------------------\n\n\nThe 10-100 year discontinuous events were:\n\n\n* HMS Warrior, 1860 (discontinuity in both [Royal Navy ship tonnage and Royal Navy ship displacement](https://aiimpacts.org/historic-trends-in-ship-size/)[30](https://aiimpacts.org/discontinuous-progress-in-history-an-update/#easy-footnote-bottom-30-2389 \"at least when modeled as linear or exponential as usual—see note above on the Great Eastern\"))\n* Eiffel Tower, 1889 (discontinuity in [tallest existing freestanding structure height](http://aiimpacts.org/discontinuity-from-the-burj-khalifa/), and in other height trends non-robustly)\n* Fairey Delta 2, 1956 (discontinuity in [airspeed](http://aiimpacts.org/historic-trends-in-flight-airspeed-records/))\n* Pellets shot into space, 1957, measured after one day of travel (discontinuity in [altitude achieved by man-made means](http://aiimpacts.org/discontinuity-in-altitude-records/))[31](https://aiimpacts.org/discontinuous-progress-in-history-an-update/#easy-footnote-bottom-31-2389 \"This was the first of various altitude records where the object continues to gain distance from Earth’s surface continuously for more than a year and perhaps indefinitely. One could choose to treat these in different ways, and get different size of discontinuity numbers. Strictly, all altitude increases are continuous, so we are anyway implicitly looking at something like discontinuities in heights reached within some period. We somewhat arbitrarily chose to measure altitudes roughly every year, including one day in for the pellets, the only one where the very start mattered. The interesting point is that progress was already robustly discontinuous measured after a day—you could get different size of discontinuity numbers with different specific measurement procedures.\")\n* Burj Khalifa, 2009 (discontinuity in [height of tallest building ever](http://aiimpacts.org/discontinuity-from-the-burj-khalifa/))\n\n\nOther places we looked\n----------------------\n\n\nHere are places we didn’t find robust discontinuities[32](https://aiimpacts.org/discontinuous-progress-in-history-an-update/#easy-footnote-bottom-32-2389 \"These places often saw discontinuities that weren’t robust, and they may still have robust discontinuities that we didn’t find. We are usually only looking at a trend for a certain period of time, so there may be discontinuities at other times, and our datasets are presumably somewhat inaccurate and incomplete.\")) – follow the links to read about any in detail:\n\n\n* [Alexnet](https://aiimpacts.org/effect-of-alexnet-on-historic-trends-in-image-recognition/): This convolutional neural network made important progress on labeling images correctly, but was only a few years ahead of the previous trend of success in the ImageNet contest (which was also a very short trend).\n* [Light intensity](https://aiimpacts.org/historic-trends-in-light-intensity/): We measured argon flashes in 1943 as a large discontinuity, but I judge it non-robust. The rate of progress shot up at around that time though, from around half a percent per year to an average of 90% per year over the next 65 years, the rest of it involving increasingly intense lasers.\n* [Real price of books](https://aiimpacts.org/historic-trends-in-book-production/): After the invention of the printing press, the real price of books seems to have dropped sharply, relative to a recent upward trajectory. However this was not long after a similarly large drop purportedly from paper replacing parchment. So in the brief history we have data for, the second drop is not unusual. We are also too uncertain about this data to confidently conclude much.\n* [Manuscripts and books produced over the last hundred years](https://aiimpacts.org/historic-trends-in-book-production/): This was another attempt to find a discontinuity from the printing press. We measured several discontinuities, including one after the printing press. However, it is not very surprising for a somewhat noisy trend with data points every hundred years to be a hundred years ahead of the best-guess curve sometimes. The discontinuity at the time of the printing press was not much larger than others in nearby centuries. The clearer effect of the printing press at this scale appears to be a new faster growth trajectory.\n* [Bandwidth distance product](https://aiimpacts.org/historic-trends-in-telecommunications-performance/): This measures how much can be sent how far by communication media. It was just pretty smooth.\n* [Total transatlantic bandwidth](https://aiimpacts.org/historic-trends-in-telecommunications-performance/): This is how much cable goes under the Atlantic Ocean. It was also pretty smooth.\n* [Whitney’s cotton gin](https://aiimpacts.org/effect-of-eli-whitneys-cotton-gin-on-historic-trends-in-cotton-ginning/): Cotton gins remove seeds from cotton. Whitney’s gin is often considered to have revolutionized the cotton industry and maybe contributed to the American Civil War. We looked at its effects on pounds of cotton ginned per person per day, and our best guess is that it was a moderate discontinuity, but the trend is pretty noisy and the available data is pretty dubious. Interestingly, progress on gins was speeding up a lot prior to Whitney (the two previous data points look like much bigger discontinuities, but we are less sure that we aren’t just missing data that would make them part of fast incremental progress). We also looked at evidence on whether Whitney’s gin might have been a discontinuity in the more inclusive metric of cost per value of cotton ginned, but this was unclear. As evidence about the impact of Whitney’s gin, US cotton production appears to us to have been on the same radically fast trajectory before it as after it, and it seems people continued to use various other ginning methods for at least sixty years.\n* [Group index of light or pulse delay of light](https://aiimpacts.org/historic-trends-in-slow-light-technology/): These are two different measures of how slowly light can be made to move through a medium. It can now be ‘stopped’ in some sense, though not the strict normal one. We measured two discontinuities in group index, but both were relative to a fairly unclear trend, so don’t seem robust.\n* [Particle accelerator performance](https://aiimpacts.org/particle-accelerator-performance-progress/): natural measures include center-of-mass energy, particle energy, and lorentz factor achieved. All of these progressed fairly smoothly.\n* [US syphilis cases, US syphilis deaths, effectiveness of syphilis treatment, or inclusive costs of syphilis treatment](https://aiimpacts.org/penicillin-and-historic-syphilis-trends/): We looked at syphilis trends because we thought penicillin might have caused a discontinuity in something, and syphilis was apparently a key use case. But we didn’t find any discontinuities there. US syphilis deaths became much rarer over a period around its introduction, but the fastest drop slightly predates plausible broad use of penicillin, and there are no discontinuities of more than ten years in either US deaths or cases. Penicillin doesn’t even appear to be much more effective than its predecessor, conditional on being used.[33](https://aiimpacts.org/discontinuous-progress-in-history-an-update/#easy-footnote-bottom-33-2389 \"On a tentative survey of the literature, which is not enough evidence to be that confident.\") Rather, it seems to have been much less terrible to use (which in practice makes treatment more likely). That suggested to us that progress might have been especially visible in ‘inclusive costs of syphilis treatment’. There isn’t ready quantitative data for that, but we tried to get a rough qualitative picture of the landscape. It doesn’t look clearly discontinuous, because the trend was already radically improving. The preceding medicine sounds terrible to take, yet was nicknamed ‘[magic bullet](https://en.wikipedia.org/wiki/Arsphenamine)’ and is considered ‘[the first effective treatment for syphilis](https://en.wikipedia.org/wiki/Arsphenamine)‘. Shortly beforehand, [mercury was still a usual treatment](https://jmvh.org/article/syphilis-its-early-history-and-treatment-until-penicillin-and-the-debate-on-its-origins/) and deliberately contracting malaria had recently been added to the toolbox.\n* [Nuclear weapons on cost-effectiveness of explosives](https://aiimpacts.org/discontinuity-from-nuclear-weapons/): Using nuclear weapons as explosives was not clearly cheaper than using traditional explosives, let alone discontinuously cheaper. However these are very uncertain estimates.\n* [Maximum landspeed](https://aiimpacts.org/historic-trends-in-land-speed-records/): Landspeed saw vast and sudden changes in the rate of progress, but the developments were so close together that none was very far from average progress between the first point and the most recent one. If we more readily expect short term trends to continue (which arguably makes sense when they are as well-defined as these), then we find several moderate discontinuities. Either way, the more basic thing going on appears to be very distinct changes in the rate of progress.\n* [AI chess performance](https://aiimpacts.org/historic-trends-in-chess-ai/): This was so smooth that a point four years ahead of the trend in 2008 is eye-catching.\n* [Breech-loading rifles on the firing rate of guns](https://aiimpacts.org/effects-of-breech-loading-rifles-on-historic-trends-in-firearm-progress/): Breech-loading rifles were suggested to us as a potential discontinuity, and firing rate seemed like a metric on which they plausibly excelled. However there seem to have been other guns with similarly fast fire rates at the time breech-loading rifles were introduced. We haven’t checked whether they produced a discontinuity in some other metric (e.g. one that combines several features), or if anything else caused discontinuities in firing rate.\n\n\nIII. Some observations\n======================\n\n\n### Prevalence of discontinuities\n\n\nSome observations on the overall prevalence of discontinuities:\n\n\n* [32%](https://docs.google.com/spreadsheets/d/1iMIZ57Ka9-ZYednnGeonC-NqwGC7dKiHN9S-TAxfVdQ/edit#gid=1906429870&range=M45) of trends we investigated saw at least one large, robust discontinuity (though note that trends were selected for being discontinuous, and were a very non-uniform collection of topics, so this could at best inform an upper bound on how likely an arbitrary trend is to have a large, robust discontinuity somewhere in a chunk of its history)\n* [53%](https://docs.google.com/spreadsheets/d/1iMIZ57Ka9-ZYednnGeonC-NqwGC7dKiHN9S-TAxfVdQ/edit#gid=1906429870&range=I45) of trends saw any discontinuity (including smaller and non-robust ones), and in expectation a trend saw [more than two](https://docs.google.com/spreadsheets/d/1iMIZ57Ka9-ZYednnGeonC-NqwGC7dKiHN9S-TAxfVdQ/edit#gid=1906429870&range=I50) of these discontinuities.\n* On average, each trend had [0.001](https://docs.google.com/spreadsheets/d/1iMIZ57Ka9-ZYednnGeonC-NqwGC7dKiHN9S-TAxfVdQ/edit#gid=1906429870&range=AG43) large robust discontinuities per year, or [0.002](https://docs.google.com/spreadsheets/d/1iMIZ57Ka9-ZYednnGeonC-NqwGC7dKiHN9S-TAxfVdQ/edit#gid=1906429870&range=AG49) for those trends with at least one at some point[34](https://aiimpacts.org/discontinuous-progress-in-history-an-update/#easy-footnote-bottom-34-2389 \"Across trends where it seemed reasonable to compare, not e.g. where we only looked at a single development. Also note that this is the average of discontinuity/years ratios across trends, not the number of discontinuities across all trends divided by the number of years across all trends.\")\n* On average [1.4%](https://docs.google.com/spreadsheets/d/1iMIZ57Ka9-ZYednnGeonC-NqwGC7dKiHN9S-TAxfVdQ/edit#gid=1906429870&range=AE43) of new data points in a trend make for large robust discontinuities, or [4.9%](https://docs.google.com/spreadsheets/d/1iMIZ57Ka9-ZYednnGeonC-NqwGC7dKiHN9S-TAxfVdQ/edit#gid=1906429870&range=AE49) for trends which have one.\n* On average [14%](https://docs.google.com/spreadsheets/d/1iMIZ57Ka9-ZYednnGeonC-NqwGC7dKiHN9S-TAxfVdQ/edit#gid=1906429870&range=AB43) of total progress in a trend came from large robust discontinuities (or [16%](https://docs.google.com/spreadsheets/d/1iMIZ57Ka9-ZYednnGeonC-NqwGC7dKiHN9S-TAxfVdQ/edit#gid=1906429870&range=AC43) of logarithmic progress), or [38%](https://docs.google.com/spreadsheets/d/1iMIZ57Ka9-ZYednnGeonC-NqwGC7dKiHN9S-TAxfVdQ/edit#gid=1906429870&range=AB49) among trends which have at least one\n\n\nThis all suggests that discontinuities, and large discontinuities in particular, are more common than I thought previously (though still not that common). One reason for this change is that I was treating difficulty of finding good cases of discontinuous progress as more informative than I do now. I initially thought there weren’t many around because suggested discontinuities often turned out not to be discontinuous, and there weren’t a huge number of promising suggestions. However we later got more good suggestions, and found many discontinuities where we weren’t necessarily looking for them. So I’m inclined to think there are a few around, but our efforts at seeking them out specifically just weren’t very effective. Another reason for a larger number now is that our more systematic methods now turn up many cases that don’t look very remarkable to the naked eye (those I have called non-robust), which we did not necessarily notice earlier. How important these are is less clear.\n\n\n### Discontinuities go with changes in the growth rate\n\n\nIt looks like discontinuities are often associated with changes in the growth rate. At a glance, 15 of the 38 trends had a relatively sharp change in their rate of progress at least once in their history. These changes in the growth rate very often coincided with discontinuities—in fourteen of the fifteen trends, at least one sharp change coincided with one of the discontinuities.[35](https://aiimpacts.org/discontinuous-progress-in-history-an-update/#easy-footnote-bottom-35-2389 \"We haven’t really carefully measured this, so my numbers here might be a bit off.\") If this is a real relationship, it means that if you see a discontinuity, there is a much heightened chance of further fast progress coming up. This seems important, but is a quick observation and should probably be checked and investigated further if we wanted to rely on it.\n\n\n### Where do we see discontinuities?\n\n\nAmong these case studies, when is a development more likely to produce a discontinuity in a trend?[36](https://aiimpacts.org/discontinuous-progress-in-history-an-update/#easy-footnote-bottom-36-2389 \"Remembering that this dataset is biased toward trends that people thought might be discontinuous, so e.g. it could be that A and B type trends both see discontinuities at the same rate, but outside observers are more likely to correctly identify discontinuities in A type trends, so most type A trends we look at have them, whereas type B trends do not.\") Some observations so far, based on the broader class including non-robust discontinuities, except where noted:\n\n\n* **When the trend is about products not technical measures** \nIf we loosely divide trends into ‘technical’ (to do with scientific results e.g. highest temperature of a superconductor), ‘product’ (to do with individual objects meant for use e.g. cotton ginned by a cotton gin, height of building), ‘industry’ (to do with entire industries e.g. books produced in the UK) or ‘societal’ (to do with features of non-industry society e.g. syphilis deaths in the US), then ‘product’ trends saw around [four times as many](https://docs.google.com/spreadsheets/d/1iMIZ57Ka9-ZYednnGeonC-NqwGC7dKiHN9S-TAxfVdQ/edit#gid=600317213&range=Z56:AA56) discontinuities as technical trends, and the other two are too small to say much. (Product trends are less than twice as likely to have any discontinuities, so the difference was largely in how many discontinuities they have per trend.)\n* **When the trend is about less important ‘features’ rather than overall performance** \nIf we loosely divide trends into ‘features’ (things that are good but not the main point of the activity), ‘performance proxies’ (things that are roughly the point of the activity) and ‘value proxies’ (things that roughly measure the net value of the activity, accounting for its costs as well as performance), then [features were more discontinuous than performance proxies](https://docs.google.com/spreadsheets/d/1iMIZ57Ka9-ZYednnGeonC-NqwGC7dKiHN9S-TAxfVdQ/edit#gid=600317213&range=AD56:AE57).[37](https://aiimpacts.org/discontinuous-progress-in-history-an-update/#easy-footnote-bottom-37-2389 \"There were only three value proxy measures, with no discontinuities. Aside from the small number, these were also particularly hard trends to measure, so more likely to have discontinuities that we missed.\")\n* **When the trend is about ‘product features’** \n(Unsurprisingly, given the above.) Overall, the 16 ‘[product features](https://docs.google.com/spreadsheets/d/1iMIZ57Ka9-ZYednnGeonC-NqwGC7dKiHN9S-TAxfVdQ/edit#gid=600317213&range=K1)’ we looked at had [4.6 discontinuities](https://docs.google.com/spreadsheets/d/1iMIZ57Ka9-ZYednnGeonC-NqwGC7dKiHN9S-TAxfVdQ/edit#gid=600317213&range=AG56:AH56) per trend on average, whereas the 22 other metrics had 0.7 discontinuities per trend on average ([2 vs. 0.3 for large discontinuities](https://docs.google.com/spreadsheets/d/1iMIZ57Ka9-ZYednnGeonC-NqwGC7dKiHN9S-TAxfVdQ/edit#gid=600317213&range=AG48:AH48)).[38](https://aiimpacts.org/discontinuous-progress-in-history-an-update/#easy-footnote-bottom-38-2389 \"That product features are much more likely to have discontinuities, and that we mostly look at product features is some evidence that we successfully directed our attention toward more discontinuous things. However it could also be that product features are relatively measurable, so we are both inclined to look at them, and can find discontinuities in them. For some of our metrics it was clear from the outset that it would be hard to find discontinuities if they were there, and we were checking for strong evidence of a discontinuity or a lack of discontinuity in spite of ambiguous information.\") ‘Product features’ include for instance sizes of ships and fire rate of guns, whereas non-product features include total books produced per century, syphilis deaths in the US, and highest temperature of known superconductors.\n* **When the development occurs after 1800** \nMost of the discontinuities we found [happened after 1800](https://docs.google.com/spreadsheets/d/1iMIZ57Ka9-ZYednnGeonC-NqwGC7dKiHN9S-TAxfVdQ/edit#gid=1171388482&range=H16:I18). This could be a measurement effect, since much more recent data is available, and if we can’t find enough data to be confident, we are not deeming things discontinuities. For instance, the two obscure [cotton gins](http://aiimpacts.org/effect-of-eli-whitneys-cotton-gin-on-historic-trends-in-cotton-ginning/) before Whitney’s famous 1793 one that look responsible for huge jumps according to our sparse and untrustworthy 1700s data. The concentration of discontinuities since 1800 might also be related to progress speeding up in the last couple of centuries. Interestingly, since 1800 the rate of discontinuities doesn’t seem to be obviously increasing. For instance, [seven of nine](https://docs.google.com/spreadsheets/d/1iMIZ57Ka9-ZYednnGeonC-NqwGC7dKiHN9S-TAxfVdQ/edit#gid=1171388482&range=K111) robust discontinuous events since 1900 happened by 1960.[39](https://aiimpacts.org/discontinuous-progress-in-history-an-update/#easy-footnote-bottom-39-2389 \"See ‘timing of discontinuities’ tab in spreadsheet\")\n* **When the trend is about travel speed across the Atlantic**Four of our ten robust discontinuous events of over a hundred years came from the three transatlantic travel speed trends we considered. They are also [high on non-robust discontinuities](https://docs.google.com/spreadsheets/d/1iMIZ57Ka9-ZYednnGeonC-NqwGC7dKiHN9S-TAxfVdQ/edit#gid=1906429870&range=AQ63:AR66).\n* **When the trend doesn’t have a consistent exponential or linear shape** \nTo measure discontinuities, we had to extrapolate past progress. We did this at each point, based on what the curve looked like so far. Some trends we consistently called exponential, some consistently linear, and some sometimes seemed linear and sometimes exponential. The ten in this third lot all had discontinuities, whereas the 20 that consistently looked either exponential or linear were about [half as likely](https://docs.google.com/spreadsheets/d/1iMIZ57Ka9-ZYednnGeonC-NqwGC7dKiHN9S-TAxfVdQ/edit#gid=1906429870&range=Q45) to have discontinuities.[40](https://aiimpacts.org/discontinuous-progress-in-history-an-update/#easy-footnote-bottom-40-2389 \"Another seven were neither of these, usually because it was too hard to find data, so we were mostly looking for evidence about whether a single data point was plausibly discontinuous without much longer term trend. This category saw no discontinuities.\")\n* **When the trend is in the size of some kind of object** \n‘Object size’ trends [had](https://docs.google.com/spreadsheets/d/1iMIZ57Ka9-ZYednnGeonC-NqwGC7dKiHN9S-TAxfVdQ/edit#gid=1906429870&range=AJ56) over five discontinuities per trend, compared to the average of [around 2](https://docs.google.com/spreadsheets/d/1iMIZ57Ka9-ZYednnGeonC-NqwGC7dKiHN9S-TAxfVdQ/edit#gid=1906429870&range=AQ63) across all trends.\n* **When [Isambard Kingdom Brunel](https://en.wikipedia.org/wiki/Isambard_Kingdom_Brunel) is somehow involved** \nI mentioned Brunel above in connection with the *Great Eastern*. As well as designing that discontinuously large ship, which lay one of the discontinuously fast transatlantic telegraph cables, he designed the non-robustly discontinuous earlier ship *Warrior.*\n\n\nI feel like there are other obvious patterns that I’m missing. Some other semi-obvious patterns that I’m noticing but don’t have time to actually check now, I am putting in the next section.\n\n\n### More things to observe\n\n\nThere are lots of other interesting things to ask about this kind of data, in particular regarding what kinds of things tend to see jumps. Here are some questions that we might answer in future, or which we welcome you to try to answer (and hope our data helps with):\n\n\n* Are trends less likely to see discontinuities when more effort is going more directly into maximizing them? (Do discontinuities arise easily in trends people don’t care about?)\n* How does the chance of discontinuity change with time, or with speed of progress? (Many trends get much faster toward the end, and there are more discontinuities toward the end, but how are they related at a finer scale?)\n* Do discontinuities come from ‘insights’ more than from turning known cranks of progress?\n* Are AI related trends similar to other trends? The two AI-related trends we investigated saw no substantial discontinuities, but two isn’t very many, and there is a persistent idea that once you can do something with AI, you can do it fast.[41](https://aiimpacts.org/discontinuous-progress-in-history-an-update/#easy-footnote-bottom-41-2389 \"Somewhat at odds with our other minimal investigation\")\n* Are trends more continuous as they depend on more ‘parts’? (e.g. is maximum fuel energy density more jumpy than maximum engine power, which is more jumpy than maximum car speed?) This would make intuitive sense, but is somewhat at odds with the 8 ‘basic physics related’ trends we looked at not being especially jumpy.\n* How does the specificity of trends relate to their jumpiness? I’d intuitively expect jumpier narrow trends to average out in aggregate to something smooth (for instance, so that maximum Volkswagen speed is more jumpy than maximum car speed, which is more jumpy than maximum transport speed, which is more jumpy than maximum man-made object speed). But I’m not sure that makes sense, and a contradictory observation is that discontinuities or sudden rate changes happen when a continuous narrow trend shoots up and intersects the broader trend. For instance, if record rocket altitude is continuously increasing, and record non-rocket altitude is continuously increasing more slowly but is currently ahead, then [overall altitude](http://aiimpacts.org/discontinuity-in-altitude-records/) will have some kind of corner in it where rockets surpass non-rockets. If you drew a line through liquid fuel rockets, pellets would have been less surprising, but they were surprising in terms of the broader measure.\n* What does a more random sample of trends look like?\n* What is the distribution of step sizes in a progress trend? (Looking at small ones as well as discontinuities.) If it generally follows a recognizable distribution, that could provide more information about the chance of rare large steps. It might also help recognize trends that are likely to have large discontinuities based on their observed distribution of smaller steps.\n* Relatively abrupt changes in the growth rate seem common. Are these in fact often abrupt rather than ramping up slowly? (Are discontinuities in the derivative relevantly different from more object-level discontinuities, for our purposes?)\n* How often is a ‘new kind of thing’ responsible for discontinuities? (e.g. the first direct flight and the first telegraph cable produced big discontinuities in trends that had previously been topped by ships for some time.) How often are they responsible for changes in the growth rate?\n* If you drew a line through liquid fuel rockets, it seems like pellets may not be surprise, but they were because of the broader measure. How often is that a thing? I think a similar thing may have happened with the altitude records, and the land speed records, both also with rockets in particular. In both of those // similar thing happened with rockets in particular in land-speed and altitude? Could see trend coming up from below for some time.\n* Is more fundamental science more likely to be discontinuous?\n* With planes and ICBMs crossing the ocean, there seemed to be a pattern where incremental progress had to pass a threshold on some dimension before incremental progress on a dimension of interest mattered, which gave rise to discontinuity. Is that a common pattern? (Is that a correct way to think about what was going on?)\n* If a thing sounds like a big deal, is it likely to be discontinuous? My impression was that these weren’t very closely connected, nor entirely disconnected. Innovations popularly considered a big deal were often not discontinuous, as far as we could tell. For instance penicillin seemed to help with syphilis a lot, but we didn’t find any actual discontinuity in anything. And we measured Whitney’s cotton gin as producing a moderate discontinuity in cotton ginned per person per day, but it isn’t robust, and there look to have been much larger jumps from earlier more obscure gins. On the other hand, nuclear weapons are widely considered a huge deal, and were a big discontinuity. It would be nice to check this more systematically.\n\n\nIV. Summary\n===========\n\n\n* Looking at past technological progress can help us tell whether AI trends are likely to be discontinuous or smooth\n* We looked for discontinuities in 38 technological trends\n* We found ten events that produced robust discontinuities of over a hundred years in at least one trend. (Djoser, Great Eastern, Telegraphs, Bridge, transatlantic flight, Paris Gun, ICBM, nukes, high temperature superconductors.)\n* We found [53](https://docs.google.com/spreadsheets/d/1iMIZ57Ka9-ZYednnGeonC-NqwGC7dKiHN9S-TAxfVdQ/edit#gid=1994197408&range=A95) events that produced smaller or less robust discontinuities\n* The average rate of large robust discontinuities per year across trends was about 0.1%, but the chance of a given level of progress arising in a large robust discontinuity was around 14%\n* Discontinuities were not randomly distributed: some classes of metric, some times, and some types of event seem to make them more likely or more numerous. We mostly haven’t investigated these in depth.\n* Growth rates sharply changed in many trends, and this seemed strongly associated with discontinuities. (If you experience a discontinuity, it looks like there’s a good chance you’re hitting a new rate of progress, and should expect more of that.)\n\n\n\n\n\n\n~\n\n\n*ETA: To be more clear, this is a blog post by Katja reporting on research involving many people at AI Impacts over the years, especially Rick Korzekwa, Asya Bergal, and Daniel Kokotajlo. The full page on the research is [here](http://aiimpacts.org/discontinuous-progress-investigation/).*\n\n\n\n\n\n\n*Thanks to Stephen Jordan, Jesko Zimmermann, Bren Worth, Finan Adamson, and others for suggesting potential discontinuities for this project in response to our 2015 bounty, and to many others for suggesting potential discontinuities since, especially notably Nuño Sempere, who conducted a detailed independent investigation into discontinuities in ship size and time to circumnavigate the world*[42](https://aiimpacts.org/discontinuous-progress-in-history-an-update/#easy-footnote-bottom-42-2389 \"Nuño Sempere. “Discontinuous Progress in Technological Trends.” Accessed March 8, 2021. https://nunosempere.github.io/rat/Discontinuous-Progress.html.\")*.* \n\n\n\n\nNotes\n-----\n\n\n\n\n\n\n\n\n\n\n\n\n\n\n\n\n\n\n\n\n\n\n", "url": "https://aiimpacts.org/discontinuous-progress-in-history-an-update/", "title": "Discontinuous progress in history: an update", "source": "aiimpacts.org", "source_type": "wordpress", "date_published": "2020-04-13T23:55:08+00:00", "paged_url": "https://aiimpacts.org/feed?paged=7", "authors": ["Katja Grace"], "id": "933832d0356afc9af8f98e6190fa860b", "summary": ["One of the big questions in AI alignment is whether there will be a discontinuous AI takeoff (see <@here@>(@Clarifying some key hypotheses in AI alignment@) for some reasons why the question is decision-relevant). To get a better outside view, AI Impacts has been looking for large discontinuities in historical technological trends. A discontinuity is measured by how many years ahead of time that value is reached, relative to what would have been expected by extrapolating the trend. \n\nThey found ten 100-year discontinuous events, for example in ship size (The SS *Great Eastern*), the average speed of military payload across the Atlantic Ocean (the first ICBM), and the warmest temperature of superconduction (yttrium barium copper oxide). \n \nThere are also some interesting negative examples of discontinuities. Particularly relevant to AI are AlexNet not being a discontinuity on the ImageNet benchmark and chess performance not having any discontinuities in Elo rating."]}
{"text": "Preliminary survey of prescient actions\n\n*Published 3 April 2020*\n\n\n In a 10-20 hour exploration, we did not find clear examples of ‘prescient actions’—specific efforts to address severe and complex problems decades ahead of time and in the absence of broader scientific concern, experience with analogous problems, or feedback on the success of the effort—though we found six cases that may turn out to be examples on further investigation. \n\n\nDetails\n-------\n\n\n We briefly investigated 20 leads on historical cases of actions taken to eliminate or mitigate a problem a decade or more in advance, evaluating them for their ‘prescience’. None were clearly as prescient as the [actions of Leó Szilárd](https://intelligence.org/files/SzilardNuclearWeapons.pdf), which were previously the best examples of such actions that we found. The primary ways in which these actions failed to exhibit prescience were the amount of feedback that was available while developing a solution and the number of years in advance of the threat that the action was taken. Although we are uncertain about most of the cases, we believe that six of them are promising for future investigation. \n\n\nBackground\n----------\n\n\n Current efforts to prepare for the impacts of artificial intelligence have several features that could make them unlikely to succeed. They typically require us to make complex predictions about novel threats over a timescale of decades, and many of these efforts will receive little feedback on whether they are on the right track, receive little input from the larger scientific community, and produce results that are not useful outside the problem of mitigating AI risk.\n\n\nIt may be useful to search for past cases of preparations that have similar features. It is important to know if humanity has failed to solve problems in advance because the attempts to do so have failed or because solutions were not attempted. If we find failed attempts, we want to know why they failed. For example, if it turns out that most previous actions were not successful because of failure to accurately predict the future, we may want to focus more of our efforts on forecasting. To this end, we use the following set of criteria for evaluating past efforts for their ‘prescience’, or the extent to which they represent early actions to mitigate a risk in absence of feedback:[1](https://aiimpacts.org/survey-of-prescient-actions/#easy-footnote-bottom-1-2362 \"Originally proposed by Alexander Berger in 2015.\")\n* **Years in Advance:** How many years in advance of the expected emergence of the threat was the action taken?\n* **Novelty:** Was the threat novel, or can we re-use (perhaps with modification) the solution to past threats?\n* **Scientific Concern:** Was the effort to address the threat endorsed by the larger scientific community?\n* **Complex Prediction:** Did the solution require a complex prediction, or is the solution clear and closely related to the problem?\n* **Specificity:** Was the solution specific to the threat or is it something that is broadly useful and may be done anyway?\n* **Feedback:** Was feedback available while developing a solution, so that we can make mistakes and learn from them, or will we need to get it right on the first try?\n* **Severity:** Was it a severe threat of global importance?\n\n\n In addition to these criteria, we took note of whether the outcome of the efforts is known, as cases with a known outcome may be more informative and more fruitful for further investigation. \n\n\nMethodology\n-----------\n\n\n Potential cases of interest were found by searching the Internet, asking our friends and colleagues, and offering a bounty on promising leads. We compiled a list of topics to research that were sufficiently narrow to allow for evaluation over a short period of time. This list included individual people that took actions (like Clair Patterson), specific actions that were taken (e.g. the installation of the Moscow-Washington Hotline), and the threats themselves (such as the destruction of infrastructure by a geomagnetic storm). \n\n\n One researcher spent approximately 30 minutes reviewing each case, and rated them on a scale of 0 to 10 on the criteria described in the previous section.[2](https://aiimpacts.org/survey-of-prescient-actions/#easy-footnote-bottom-2-2362 \"All of the ratings were assigned by Rick Korzekwa\") A score of 1 indicates the criterion described the case very poorly, while a score of 10 indicates the case demonstrated the criterion extremely well. These ratings were highly subjective, though we made efforts to evaluate the cases in a way that is consistent and which would avoid too many false negatives.[3](https://aiimpacts.org/survey-of-prescient-actions/#easy-footnote-bottom-3-2362 \"For example, efforts to reduce the risks of geomagnetic storms and antibiotic resistance both involve some actions that are high in specificity and others that are low in specificity. We evaluated both cases on the most specific-to-the-problem actions that we are aware of.\") A composite score was calculated from these by taking a weighted average with the following weights:[4](https://aiimpacts.org/survey-of-prescient-actions/#easy-footnote-bottom-4-2362 \" Because we were highly uncertain about our scores given only a half hour of research per case, we assigned scores for our best guess, or ‘median guess’ score, as well as 10th and 90th percentile estimates for each criterion for each case. These should be interpreted as the range of scores which we expect we would arrive at given several hours of investigation, with 80% credence, and equal likelihood of having over- or underestimated the score. We calculated 10th and 90th percentile estimates of the average by modeling the high and low estimates as uncorrelated deviations from the mean, so that they could be added in the usual way for propagating uncorrelated errors.\")\n\n\n| | |\n| --- | --- |\n| **Criterion** | **Weight** |\n| Number of years in advance[5](https://aiimpacts.org/survey-of-prescient-actions/#easy-footnote-bottom-5-2362 \" This score was calculated directly from the estimated number of years by a root logistic function with values 2.75, 7.1, and 9.6 for 0, 10, and 20 years, respectively \") | 20 |\n| Overall severity of threat | 2 |\n| Novelty of threat/solution | 3 |\n| Overall level of concern from the scientific community at large | 2 |\n| Complexity of prediction required to produce a solution | 5 |\n| Specificity of solution | 2 |\n| Level of feedback available while developing a solution | 10 |\n\n\n In addition to these ratings, we rated each one for how promising it was for further research, and annotated the ratings in the spreadsheet as seemed appropriate. We also assigned ratings to two cases that were previously the subject of in-depth investigations, for comparison. These were the [Asilomar Conference](https://intelligence.org/files/TheAsilomarConference.pdf) and [the actions of Leó Szilárd](https://intelligence.org/files/SzilardNuclearWeapons.pdf).\n\n\nResults\n-------\n\n\n The following table shows our ratings. The two reference cases are in italics. Our full spreadsheet of ratings and notes can be found [here](https://docs.google.com/spreadsheets/d/12mMQFjgWPjE6agOxD8jDceNTKBzIeplkjrpyTdcMa48/edit?usp=sharing).\n\n\n\n\n| | | |\n| --- | --- | --- |\n| **Case** | **Score** | **Suitability for Further Research** |\n| *Leo Szilard* | *7.24* | |\n| Antibiotic resistance | 7.11 | 7 |\n| Open Quantum Safe | 6.80 | 5 |\n| Nordic Gene Bank | 6.74 | 4 |\n| Geomagnetic Storm Prep | 6.74 | 5 |\n| Fukushima Daichii | 6.74 | 5 |\n| Swiss Redoubt | 6.60 | 2 |\n| Nonproliferation Treaty | 6.14 | 6 |\n| Cavendish Banana and TR4 | 6.12 | 5 |\n| WIPP | 6.02 | 4 |\n| Population Bomb | 5.99 | 3 |\n| Y2k | 5.76 | 4 |\n| *Asilomar Conference* | *5.70* | |\n| Cold War Civil Defense | 5.29 | 3 |\n| Religious Apocalypse | 4.88 | 2 |\n| Hurricane Katrina | 4.18 | 4 |\n| Iran Nuclear Deal | 4.18 | 4 |\n| Moscow-Washington Hotline | 3.90 | 3 |\n| England 1800s Policy Reform | 3.89 | 2 |\n| Clair Patterson | 3.74 | 2 |\n| Missile gap | 3.22 | 2 |\n| PQCrypto Conference 2006 | | 4 |\n\n\n For one case, the PQCrypto 2006 conference, we were unable to find sufficient information after 45 minutes of investigation to provide an evaluation.\n\n\nIn general the cases we investigated did not score highly on these criteria. The average score was 5.6 out of 10, with the US-Russia missile gap receiving the minimum score of 3.0 and antibiotic resistance receiving the maximum score of 7.11. None of the cases received a higher score than our reference case, the actions of Leó Szilárd (score = 7.24), which we consider to be sufficiently ‘prescient’ to be worth examining. Just over half (11) of our cases received higher ratings than the Asilomar Conference (rating = 5.6), which was previously judged to be less prescient.\n\n\nThe ratings are highly uncertain, as is natural for thirty minute reviews of complex topics. On average, our 90th percentile estimates were 80% larger than their corresponding 10th percentile estimate. All but four cases had minimum ratings lower than the best guess for Asilomar, and more than half had maximum ratings higher than the best guess for Leó Szilárd.\n\n\nThe axes on which the cases were least prescient were feedback and years in advance.[6](https://aiimpacts.org/survey-of-prescient-actions/#easy-footnote-bottom-6-2362 \"On average, the cases lost 1.35 points from their composite score on each of these criteria. This is partly due to the large weight assigned to these criteria. If we used an unweighted average to compute the scores, cases would lose .77 points for feedback and .39 for years in advance, with years in advance being the axis with the highest average score.\") The cases were most analogous on severity, novelty, and specificity of solution, losing on average .20, .30, and .20 points from their composite scores, respectively.\n\n\nTwo cases, antibiotic resistance and the Treaty on the Non-Proliferation of Nuclear Weapons, seemed particularly promising for additional research, and received scores of 7 and 6 accordingly. Five other cases received scores of at least five and seemed less promising, but likely worth some additional research.\n\n\nDiscussion\n----------\n\n\n Although the very short research time allotted to each case limits our ability to confidently draw conclusions, we ruled out some cases which were clearly not prescient, identified some promising cases, and roughly characterized some ways in which efforts to reduce AI risk may be different from past efforts to reduce risks.\n\n\n### Irrelevant Cases\n\n\n There were four cases that we found to be poor examples of prescient actions: The **US-Russia Missile Gap** of the late 1950’s, the actions of **Clair Patterson** to combat the use of leaded gasoline, **19th century policy reforms in England** that were made in response to the industrial revolution, and the **Moscow-US Nuclear Hotline**. All of these cases involved actions that were taken in response to, rather than in anticipation of, the emergence of a problem (or perceived problem), and for which the solutions were relatively straightforward, with the primary barriers being political.[7](https://aiimpacts.org/survey-of-prescient-actions/#easy-footnote-bottom-7-2362 \"Clair Patterson made some impressive inferences about the present state of the world, and seemed to believe that the problems he was observing would continue to get worse without intervention. In this respect, his actions were prescient. But in general, he was working to prevent a present problem from becoming worse, rather than working to avoid a future problem.\")\n### Questionable Cases\n\n\n Two cases involved actions based on highly dubious predictions: Preparations for a **religious apocalypse**[8](https://aiimpacts.org/survey-of-prescient-actions/#easy-footnote-bottom-8-2362 \" Preparations for religious apocalypse is a broad category. We attempted to find examples in this category that fell within our target reference class, but we were generally unable to find examples that involved specific actions taken more than a few years in advance. We are not highly confident that there do not exist examples that meet these criteria.\") and the book ***The Population Bomb*** and the accompanying actions of author Paul Erhlich. Although the actors in these cases were acting on predictions that have since been shown to be inaccurate, the cases do have some similarity to AI risk. They were addressing predictions of severe consequences from novel threats, they were acting without help from the scientific community, and they did not expect to receive a great deal of feedback along the way. However, the actions were only taken 5-10 years in advance of the threat, and we expect the apparent disconnect between the forecasts and reality to make it more difficult to learn from the actions.\n\n\nSome cases involved threats that had already emerged, in the sense that they could happen immediately, but had sufficiently low per-year risk for a reasonable person to expect the outcome to be at least a decade in the future. These include **Hurricane Katrina**, **US civil defense during the cold war**, **Fukushima Daichii**, the comparison case **Asilomar Conference**, and the **Nordic Gene Bank**.[9](https://aiimpacts.org/survey-of-prescient-actions/#easy-footnote-bottom-9-2362 \"The Nordic Gene Bank addresses a low per-year risk, so that it seems reasonable to consider it to be addressing a future risk. However, the first withdrawal from the seed vault happened relatively quickly, suggesting that either the risk is near term or that the solution is not highly specific to long term risks.\") [10](https://aiimpacts.org/survey-of-prescient-actions/#easy-footnote-bottom-10-2362 \" Although geomagnetic storm preparation has a similar quality, it seems that the per-year risk of a catastrophic outcome is low enough, and the preparations for such severe outcomes is specific enough that it qualifies as a promising case, as described in the next section.\")\nOther cases involved solutions that were easy or not dependent on complex forecasting. The **Swiss National Redoubt** relied on long-range forecasting, but was more of a large investment in defense than a complex search for a solution. The **year 2000 problem** was easy to address, even without taking action until relatively shortly before the event took place. The **Iran Nuclear Deal** (and perhaps also the **Nuclear Non-Proliferation Treaty**) required difficult political negotiations, but did not appear to rely on complex predictions.\n\n\n### Promising Cases\n\n\n We identified six cases that seem promising for further investigation:\n\n\n**Alexander Fleming** warned, in his 1945 Nobel Lecture, that widespread access to antibiotics without supervision may lead to antibiotic resistance.[11](https://aiimpacts.org/survey-of-prescient-actions/#easy-footnote-bottom-11-2362 \"“The time may come when penicillin can be bought by anyone in the shops. Then there is the danger that the ignorant man may easily underdose himself and by exposing his microbes to non-lethal quantities of the drugmake them resistant.” “Wayback Machine,” March 31, 2018. https://web.archive.org/web/20180331001640/https://www.nobelprize.org/nobel_prizes/medicine/laureates/1945/fleming-lecture.pdf.\") We are uncertain of the impact of Fleming’s warning, whether he took additional action to mitigate the risk, or how widespread within the scientific community such concerns were, but our impression is that it was not a widely known issue, that his was an early warning, and that his judgement was generally taken seriously by the time of his speech. His warning preceded the first documented cases of penicillin-resistant bacteria by more than 20 years, and the threat of antimicrobial resistance seems to be broadly analogous with AI risk on most of our criteria, though it does seem that feedback was available throughout efforts to reduce the threat. \n\n\n**The Treaty on the Non-Proliferation of Nuclear Weapons** required many actions from many actors, but it seems to have required a complex prediction about technological development and geopolitics to address a severe threat, was specific to a particular threat, and had limited opportunities for feedback. We are uncertain if any of the specific actions will prove to be prescient on further investigation, but it seems promising. \n\n\n\n**Open Quantum Safe** is an open-source project to develop cryptographic techniques that are resistant to the use of quantum computers. The threat of quantum computing to cryptography has several relevant features, including complex forecasting over a decades-time scale of a novel threat. We found limited information on the circumstances surrounding the founding of the project or the related case, the **2006 PQCrypto Conference**, but the problem generally seems prescient.\n\n\n**Geomagnetic Storm Preparation** addresses the threat caused by severe damage and disruption by solar weather to electronics and power infrastructure, which could be a severe global catastrophe.[12](https://aiimpacts.org/survey-of-prescient-actions/#easy-footnote-bottom-12-2362 \" See, for example https://allfed.info/industrial-civilisation/\") The expected time between such events is decades or centuries, and mitigating the risk involves actions that may be specific to the particular problem and requires complex predictions about the physics involved and how our infrastructure and institutions would be able to respond. However, we are uncertain about which actions were taken and when, and whether there is evidence that they are working. Additionally, there is substantial investment from the scientific community and we are uncertain how much feedback is available while developing solutions.\n\n\n**Panama Disease** is a fungal infection that has been spreading globally for decades and threatens the viability of the cavendish banana as a commercial crop. Cavendish bananas account for the vast majority of banana exports, and are integral to the food security of countries such as Costa Rica and Guatemala.[13](https://aiimpacts.org/survey-of-prescient-actions/#easy-footnote-bottom-13-2362 \"“export revenue from bananas covered 40 percent of Costa Rica’s food import bill and 27 percent of Guatemala’s in 2014” “EST: Banana Facts.” Accessed February 6, 2020. http://www.fao.org/economic/est/est-commodities/bananas/bananafacts/en/#.XjyilyOIYuV. \") Early action included measures to slow the spread of the fungus, a search for cultivars to replace the Cavendish, calls for greater diversity in banana varietals, and searches for fungicides that are able to kill the fungus. Although these actions have many opportunities for feedback, some of them involve complex predictions and searches for specific technical solutions, and, from the perspective of farmers on continents that have not yet encountered the infection, the arrival of the fungus represents a discrete event at some undetermined time in the future. We are uncertain if these are good examples of prescient actions, but they may be worth additional investigation. \n\n\n### Presence of Feedback\n\n\n The axis on which our cases most differed from efforts to reduce AI risk was the level of feedback available while developing a solution. The average score on feedback was 3.8, and none of the cases received a score higher than 7. Even cases that initially seemed that they would have very little feedback proved to have enough to aid those that were making preparations. Examples include Hurricane Katrina, which benefited from lessons learned from preceding hurricanes, and the National Redoubt of Switzerland, which benefited from the observation of conflicts between other actors, providing information about which military equipment and tactics were viable against likely adversaries. Assuming that these results are representative, here are two ways to interpret these results:\n\n\n**Feedback is abundant:** Feedback is abundant in a wide variety of situations, so that we should also expect to have opportunities for feedback while preparing for advanced artificial intelligence. In support of this view are the cases mentioned above that were initially expected to lack feedback, even on the part of those making preparations, but which nonetheless benefited from feedback. \n\n\n\n**AI risk is unusual:** The common perception that there is very little feedback available to efforts to reduce the risks of advanced AI is correct, and AI risk is unique (or very rare) in this regard. Support for this view comes from [arguments](https://intelligence.org/2018/10/03/rocket-alignment/) for the one-shot nature of solving the AI control problem.[14](https://aiimpacts.org/survey-of-prescient-actions/#easy-footnote-bottom-14-2362 \"For instance, Eliezer Yudkowsky obliquely argues this in The Rocket Alignment Problem. “The Rocket Alignment Problem – Machine Intelligence Research Institute.” Accessed March 26, 2020. https://intelligence.org/2018/10/03/rocket-alignment/.\")\n*Primary author: Rick Korzekwa*\n\n\nNotes\n-----\n\n\n\n\n\n\n\n\n\n\n\n", "url": "https://aiimpacts.org/survey-of-prescient-actions/", "title": "Preliminary survey of prescient actions", "source": "aiimpacts.org", "source_type": "wordpress", "date_published": "2020-04-04T00:15:54+00:00", "paged_url": "https://aiimpacts.org/feed?paged=7", "authors": ["richardkorzekwa"], "id": "a741bc48aa7c82f5cc7ec368012543be", "summary": ["AI Impacts is looking into other examples in history where people took actions in order to address a complex, novel, severe future problem, and in hindsight we recognize those actions as prescient. Ideally we could learn lessons for AI alignment from such cases. The survey is so far very preliminary, so I'll summarize it later when it has been further developed, but I thought I'd send it along if you wanted to follow along (I found the six cases they've identified quite interesting)."]}
{"text": "Takeaways from safety by default interviews\n\n*By Asya Bergal, 3 April 2020*\n\n\nLast year, several researchers at AI Impacts (primarily Robert Long and I) interviewed prominent researchers inside and outside of the AI safety field who are relatively optimistic about advanced AI being developed safely. These interviews were originally intended to focus narrowly on reasons for optimism, but we ended up covering a variety of topics, including AGI timelines, the likelihood of current techniques leading to AGI, and what the right things to do in AI safety are right now. \n\n\n\nWe talked to Ernest Davis, Paul Christiano, Rohin Shah, Adam Gleave, and Robin Hanson. \n\n\n\nHere are some more general things I personally found noteworthy while conducting these interviews. For interview-specific summaries, check out our [Interviews Page](https://aiimpacts.org/interviews-on-plausibility-of-ai-safety-by-default/). \n\n\n\n**Relative optimism in AI often comes from the belief that AGI will be developed gradually, and problems will be fixed as they are found rather than neglected.**\n\n\nAll of the researchers we talked to seemed to believe in non-discontinuous takeoff.[1](https://aiimpacts.org/takeaways-from-safety-by-default-interviews/#easy-footnote-bottom-1-2350 \"Paul Christiano: https://sideways-view.com/2018/02/24/takeoff-speeds/
Rohin Shah: “I don’t know, in a world where fast takeoff is true, lots of things are weird about the world, and I don’t really understand the world. So I’m like, “Shit, it’s quite likely something goes wrong.” I think the slow takeoff is definitely a crux. Also, we keep calling it slow takeoff and I want to emphasize that it’s not necessarily slow in calendar time. It’s more like gradual. … Yeah. And there’s no discontinuity between… you’re not like, “Here’s a 2X human AI,” and a couple of seconds later it’s now… Not a couple of seconds later, but like, “Yeah, we’ve got 2X AI,” for a few months and then suddenly someone deploys a 10,000X human AI. If that happened, I would also be pretty worried. It’s more like there’s a 2X human AI, then there’s like a 3X human AI and then a 4X human AI. Maybe this happens from the same AI getting better and learning more over time. Maybe it happens from it designing a new AI system that learns faster, but starts out lower and so then overtakes it sort of continuously, stuff like that.”
— From Conversation with Rohin Shah
Adam Gleave: “I don’t see much reason for AI progress to be discontinuous in particular. So there’s a lot of empirical records you could bring to bear on this, and it also seems like a lot of commercially valuable interesting research applications are going to require solving some of these problems. You’ve already seen this with value learning, that people are beginning to realize that there’s a limitation to what we can just write a reward function down for, and there’s been a lot more focus on imitation learning recently. Obviously people are solving much narrower versions of what the safety community cares about, but as AI progresses, they’re going to work on broader and broader versions of these problems.”
— From Conversastion with Adam Gleave
Robin Hanson: “That argument was a very particular one, that this would appear under a certain trajectory, under a certain scenario. That was a scenario where it would happen really fast, would happen in a very concentrated place in time, and basically once it starts, it happens so fast, you can’t really do much about it after that point. So the only chance you have is before that point. … But I was doubting that scenario. I was saying that that wasn’t a zero probability scenario, but I was thinking it was overestimated by him and other people in that space. I still think many people overestimate the probability of that scenario. Over time, it seems like more people have distanced themselves from that scenario, yet I haven’t heard as many substitute rationales for why we should do any of this stuff early.”
— From Conversation with Robin Hanson\") Rohin gave ‘problems will likely be fixed as they come up’ as his primary reason for optimism,[2](https://aiimpacts.org/takeaways-from-safety-by-default-interviews/#easy-footnote-bottom-2-2350 \"“The first one I had listed is that continual or gradual or slow takeoff, whatever you want to call it, allows you to correct the AI system online. And also it means that AI systems are likely to fail in not extinction-level ways before they fail in extinction-level ways, and presumably we will learn from that and not just hack around it and fix it and redeploy it.”
— From Conversation with Rohin Shah\") Adam[3](https://aiimpacts.org/takeaways-from-safety-by-default-interviews/#easy-footnote-bottom-3-2350 \"\n\n\n\n
“And then, I also have optimism that yes, the AI research community is going to try to solve these problems. It’s not like people are just completely disinterested in whether their systems cause harm, it’s just that right now, it seems to a lot of people very premature to work on this. There’s a sense of ‘how much good can we do now, where nearer to the time there’s going to just be naturally 100s of times more people working on the problem?’. I think there is still value you can do now, in laying the foundations of the field, but that maybe gives me a bit of a different perspective in terms of thinking, ‘What can we do that’s going to be useful to people in the future, who are going to be aware of this problem?’ versus ‘How can I solve all the problems now, and build a separate AI safety community?’.”
— From Conversation with Adam Gleave\") and Paul[4](https://aiimpacts.org/takeaways-from-safety-by-default-interviews/#easy-footnote-bottom-4-2350 \"“Before we get to resources or people, I think one of the basic questions is, there’s this perspective which is fairly common in ML, which is like, ‘We’re kind of just going to do a bunch of stuff, and it’ll probably work out’. That’s probably the basic thing to be getting at. How right is that?
This is the bad view of safety conditioned on– I feel like prosaic AI is in some sense the worst– seems like about as bad as things would have gotten in terms of alignment. Where, I don’t know, you try a bunch of shit, just a ton of stuff, a ton of trial and error seems pretty bad. Anyway, this is a random aside maybe more related to the previous point. But yeah, this is just with alignment. There’s this view in ML that’s relatively common that’s like, we’ll try a bunch of stuff to get the AI to do what we want, it’ll probably work out. Some problems will come up. We’ll probably solve them. I think that’s probably the most important thing in the optimism vs pessimism side.”
— From Conversation with Paul Christiano\") both mentioned it as a reason. \n\n\n\nRelatedly, both Rohin[5](https://aiimpacts.org/takeaways-from-safety-by-default-interviews/#easy-footnote-bottom-5-2350 \"“I think I could imagine getting more information from either historical case studies of how people have dealt with new technologies, or analyses of how AI researchers currently think about things or deal with stuff, could change my mind about whether I think the AI community would by default handle problems that arise, which feels like an important crux between me and others.”
— From Conversation with Rohin Shah\") and Paul[6](https://aiimpacts.org/takeaways-from-safety-by-default-interviews/#easy-footnote-bottom-6-2350 \"“One can learn… I don’t know very much about any of the relevant institutions, I may know a little bit. So you can imagine easily learning a bunch about them by observing how well they solve analogous problems or learning about their structure, or just learning better about the views of people. That’s the second category.”
— From Conversation with Paul Christiano\") said one thing that could update their views was gaining information about how institutions relevant to AI will handle AI safety problems– potentially by seeing them solve relevant problems, or by looking at historical examples. \n\n\n\nI think this is a pretty big crux around the optimism view; my impression is that MIRI researchers generally think that 1) the development of human-level AI will likely be fast and potentially discontinuous and 2) people will be incentivized to hack around and redeploy AI when they encounter problems. See [Likelihood of discontinuous progress around the development of AGI](https://aiimpacts.org/likelihood-of-discontinuous-progress-around-the-development-of-agi/#Intelligence_explosion) for more on 1). I think 2) could be a fruitful avenue for research; in particular, it might be interesting to look at recent examples of people in technology, particularly ML, correcting software issues, perhaps when they’re against their short-term profit incentives. Adam said he thought the AI research community wasn’t paying enough attention to building safe, reliable, systems.[7](https://aiimpacts.org/takeaways-from-safety-by-default-interviews/#easy-footnote-bottom-7-2350 \"“And then, if I look at the state of the art in AI, there’s a number of somewhat worrying trends. We seem to be quite good at getting very powerful superhuman systems in narrow domains when we can specify the objective that we want quite precisely. So AlphaStar, AlphaGo, OpenAI Five, these systems are very much lacking in robustness, so you have some quite surprising failure modes. Mostly we see adversarial examples in image classifiers, but some of these RL systems also have somewhat surprising failure modes. This seems to me like an area the AI research community isn’t paying much attention to, and I feel like it’s almost gotten obsessed with producing flashy results rather than necessarily doing good rigorous science and engineering. That seems like quite a worrying trend if you extrapolate it out, because some other engineering disciplines are much more focused on building reliable systems, so I more trust them to get that right by default.
Even in something like aeronautical engineering where safety standards are very high, there are still accidents in initial systems. But because we don’t even have that focus, it doesn’t seem like the AI research community is going to put that much focus on building safe, reliable systems until they’re facing really strong external or commercial pressures to do so. Autonomous vehicles do have a reasonably good safety track record, but that’s somewhere where it’s very obvious what the risks are. So that’s kinda the sociological argument, I guess, for why I don’t think that the AI research community is going to solve all of the safety problems as far ahead of time as I would like.”
— From Conversation with Adam Gleave\") \n\n\n\n**Many of the arguments I heard around relative optimism weren’t based on inside-view technical arguments.**\n\n\nThis isn’t that surprising in hindsight, but it seems interesting to me that though we interviewed largely technical researchers, a lot of their reasoning wasn’t based particularly on inside-view technical knowledge of the safety problems. See [the interviews](https://aiimpacts.org/interviews-on-plausibility-of-ai-safety-by-default/) for more evidence of this, but here’s a small sample of the not-particularly-technical claims made by interviewees:\n\n\n* *AI researchers are likely to stop and correct broken systems rather than hack around and redeploy them.*[8](https://aiimpacts.org/takeaways-from-safety-by-default-interviews/#easy-footnote-bottom-8-2350 \"See footnotes 2 – 4 above.\")\n* *AI has and will progress via* *a cumulation of lots of small things rather than via a sudden important insight.*\n\n\nMy instinct when thinking about AGI is to defer largely to safety researchers, but these reasons felt noteworthy to me in that they seemed like questions that were perhaps better answered by economists or sociologists (or for the latter case, neuroscientists) than safety researchers. I really appreciated Robin’s efforts to operationalize and analyze the second claim above. \n \n(Of course, many of the claims were also more specific to machine learning and AI safety.) \n\n\n\n**There are lots of calls for individuals with views around AI risk to engage with each other and understand the reasoning behind fundamental disagreements.**\n\n\nThis is especially true around views that MIRI have, which many optimistic researchers reported not having a good understanding of.\n\n\nThis isn’t particularly surprising, but there was a strong universal and unprompted theme that there wasn’t enough engagement around AI safety arguments. Adam and Rohin both said they had a much worse understanding than they would like of others viewpoints.[9](https://aiimpacts.org/takeaways-from-safety-by-default-interviews/#easy-footnote-bottom-9-2350 \"“I guess, I don’t know if this is really useful, but I do wish I had a better sense of what other people in the safety community and outside of it actually thought and why they were working on it, so I really appreciate you guys doing these interviews because it’s useful to me as well. I am generally a bit concerned about lots of people coming to lots of different conclusions regarding how pessimistic we should be, regarding timelines, regarding the right research agenda.
I think disagreement can be healthy because it’s good to explore different areas. The ideal thing would be for us to all converge to some common probability distribution and we decide we’re going to work on different areas. But it’s very hard psychologically to do this, to say, ‘okay, I’m going to be the person working on this area that I think isn’t very promising because at the margin it’s good’– people don’t work like that. It’s better if people think, ‘oh, I am working on the best thing, under my beliefs’. So having some diversity of beliefs is good. But it bothers me that I don’t know why people have come to different conclusions to me. If I understood why they disagree, I’d be happier at least.”
— From Conversation with Adam Gleave
“Slow takeoff versus fast takeoff…. I feel like MIRI still apparently believes in fast takeoff. I don’t have a clear picture of these reasons, I expect those reasons would move me towards fast takeoff. … Yeah, there’s a lot of just like.. MIRI could say their reasons for believing things and that would probably cause me to update. Actually, I have enough disagreements with MIRI that they may not update me, but it could in theory update me.”
— From Conversation with Rohin Shah\") Robin[10](https://aiimpacts.org/takeaways-from-safety-by-default-interviews/#easy-footnote-bottom-10-2350 \"“My experience is that I’ve just written on this periodically over the years, but I get very little engagement. Seems to me there’s just a lack of a conversation here. Early on, Eliezer Yudkowsky and I were debating, and then as soon as he and other people just got funding and recognition from other people to pursue, then they just stopped engaging critics and went off on pursuing their stuff.
Which makes some sense, but these criticisms have just been sitting and waiting. Of course, what happens periodically is they are most eager to engage the highest status people who criticize them. So periodically over the years, some high-status person will make a quip, not very thought out, at some conference panel or whatever, and they’ll be all over responding to that, and sending this guy messages and recruiting people to talk to him saying, “Hey, you don’t understand. There’s all these complications.”
Which is different from engaging the people who are the longest, most thoughtful critics. There’s not so much of that going on. You are perhaps serving as an intermediary here. But ideally, what you do would lead to an actual conversation. And maybe you should apply for funding to have an actual event where people come together and talk to each other. Your thing could be a preliminary to get them to explain how they’ve been misunderstood, or why your summary missed something; that’s fine. If it could just be the thing that started that actual conversation it could be well worth the trouble.”
— From Conversation with Robin Hanson\") and Paul[11](https://aiimpacts.org/takeaways-from-safety-by-default-interviews/#easy-footnote-bottom-11-2350 \"“And I don’t know, I mean this has been a project that like, it’s a hard project. I think the current state of affairs is like, the MIRI folk have strong intuitions about things being hard. Essentially no one in… very few people in ML agree with those, or even understand where they’re coming from. And even people in the EA community who have tried a bunch to understand where they’re coming from mostly don’t. Mostly people either end up understanding one side or the other and don’t really feel like they’re able to connect everything. So it’s an intimidating project in that sense. I think the MIRI people are the main proponents of the everything is doomed, the people to talk to on that side. And then in some sense there’s a lot of people on the other side who you can talk to, and the question is just, who can articulate the view most clearly? Or who has most engaged with the MIRI view such that they can speak to it?”
— From Conversation with Paul Christiano\") both pointed to some existing but meaningful unfinished debate in the space.\n\n\n*3 April 2020*\n\n\n\nNotes\n-----\n\n", "url": "https://aiimpacts.org/takeaways-from-safety-by-default-interviews/", "title": "Takeaways from safety by default interviews", "source": "aiimpacts.org", "source_type": "wordpress", "date_published": "2020-04-03T17:10:45+00:00", "paged_url": "https://aiimpacts.org/feed?paged=7", "authors": ["Asya Bergal"], "id": "9fb7053e829638260ceedcfee5c875f0", "summary": ["This post lists three key takeaways from AI Impacts' conversations with \"optimistic\" researchers (summarized mainly in [AN #80](https://mailchi.mp/b3dc916ac7e2/an-80-why-ai-risk-might-be-solved-without-additional-intervention-from-longtermists) with one in [AN #63](https://mailchi.mp/533c646a4b21/an-63how-architecture-search-meta-learning-and-environment-design-could-lead-to-general-intelligence)). I'll just name the takeaways here, see the post for more details:\n\n1. Relative optimism in AI often comes from the belief that AGI will be developed gradually, and problems will be fixed as they are found rather than neglected.\n2. Many of the arguments I heard around relative optimism weren’t based on inside-view technical arguments.\n3. There are lots of calls for individuals with views around AI risk to engage with each other and understand the reasoning behind fundamental disagreements."]}
{"text": "Interviews on plausibility of AI safety by default\n\nThis is a list of interviews on the plausibility of AI safety by default.\n\n\nBackground\n----------\n\n\nAI Impacts conducted interviews with several thinkers on AI safety in 2019 as part of a project exploring arguments for expecting advanced AI to be safe by default. The interviews also covered other AI safety topics, such as timelines to advanced AI, the likelihood of current techniques leading to AGI, and currently promising AI safety interventions. \n\n\nList\n----\n\n\n* [Conversation with Ernie Davis](https://aiimpacts.org/conversation-with-ernie-davis/)\n* [Conversation with Rohin Shah](https://aiimpacts.org/conversation-with-rohin-shah/)\n* [Conversation with Paul Christiano](https://aiimpacts.org/conversation-with-paul-christiano/)\n* [Conversation with Adam Gleave](https://aiimpacts.org/conversation-with-adam-gleave/)\n* [Conversation with Robin Hanson](https://aiimpacts.org/conversation-with-robin-hanson/)\n", "url": "https://aiimpacts.org/interviews-on-plausibility-of-ai-safety-by-default/", "title": "Interviews on plausibility of AI safety by default", "source": "aiimpacts.org", "source_type": "wordpress", "date_published": "2020-04-02T22:40:43+00:00", "paged_url": "https://aiimpacts.org/feed?paged=7", "authors": ["Asya Bergal"], "id": "9a0a048145bc49a73f2a2637ce6851af", "summary": []}
{"text": "Atari early\n\n*By Katja Grace, 1 April 2020*\n\n\nDeepmind [announced](https://deepmind.com/blog/article/Agent57-Outperforming-the-human-Atari-benchmark) that their Agent57 beats the ‘human baseline’ at all 57 Atari games usually used as a benchmark. I think this is probably enough to resolve one of the predictions we had respondents make in our [2016 survey](https://aiimpacts.org/2016-expert-survey-on-progress-in-ai/).\n\n\nOur question was when it would be feasible to ‘outperform professional game testers on all Atari games using no game specific knowledge’.[1](https://aiimpacts.org/atari-early/#easy-footnote-bottom-1-2351 \"\n\n\n\n
Full question wording:
\n\n\n\nHow many years until you think the following AI tasks will be feasible with:
\n\n\n\na small chance (10%)?\nan even chance (50%)?\na high chance (90%)?
\n\n\n\nLet a task be ‘feasible’ if one of the best resourced labs could implement it in less than a year if they chose to. Ignore the question of whether they would choose to.
\n\n\n\n[…]\n\n\n\nOutperform professional game testers on all Atari games using no game-specific knowledge. This includes games like Frostbite, which require planning to achieve sub-goals and have posed problems for deep Q-networks1,2.
\n\n\n\n1 Mnih et al. (2015). Human-level control through deep reinforcement learning\n2 Lake et al. (2015). Building Machines That Learn and Think Like People
\n\n\n\nsmall chance (10%)
even chance (50%)
high chance (90%)\") ‘Feasible’ was defined as meaning that one of the best resourced labs could do it in a year if they wanted to.\n\n\nAs I see it, there are four non-obvious things to resolve in determining whether this task has become feasible:\n\n\n* Did or could they outperform ‘professional game testers’?\n* Did or could they do it ‘with no game specific knowledge’?\n* Did or could they do it for ‘all Atari games’?\n* Is anything wrong with the result?\n\n\n**I. Did or could they outperform ‘professional game testers’?**\n\n\nIt looks like yes, for at least for 49 of the games: the ‘human baseline’ appears to have come from ‘professional human games testers’ described in [this paper](https://www.nature.com/articles/nature14236).[2](https://aiimpacts.org/atari-early/#easy-footnote-bottom-2-2351 \"“In addition to the learned agents, we also report scores for
a professional human games tester playing under controlled conditions…”
“The professional human tester used the same emulator engine as the agents, and played under controlled conditions. The human tester was not allowed to pause, save or reload games. As in the original Atari 2600 environment, the emulator was run at 60 Hz and the audio output was disabled: as such, the sensory input was equated between human player and agents. The human performance is the average reward achieved from around 20 episodes of each game lasting a maximum of 5min each, following around 2 h of practice playing each game.”\") (What exactly the comparison was for the other games is less clear, but it sounds like what they mean by ‘human baseline’ is ‘professional game tester’, so I guess the other games meet a similar standard.)\n\n\nI’m not sure how good professional games testers are. It sounds like they were not top-level players, given that the paper doesn’t say that they were, that they were given two hours to practice the games, and that randomly searching for high scores online for a few of these games (e.g. [here](http://highscore.com/)) yields higher ones (though this could be complicated by e.g. their only being allowed a short time to play).\n\n\n**II. Did or could they do it with ‘no game specific knowledge’?**\n\n\nMy impression is that their system does not involve ‘game specific knowledge’ under likely meanings of this somewhat ambiguous term. However I don’t know a lot about the technical details here or how such things are usually understood, and would be interested to hear what others think.\n\n\n**III. Did or could they do it for ‘all Atari games’?**\n\n\nAgent57 only plays 57 [Atari 2600](https://en.wikipedia.org/wiki/Atari_2600) games, whereas [there are hundreds](https://en.wikipedia.org/wiki/List_of_Atari_2600_games) of Atari 2600 games (and [other](https://en.wikipedia.org/wiki/Atari_XEGS) [Atari](https://en.wikipedia.org/wiki/Atari_7800) [consoles](https://en.wikipedia.org/wiki/Atari_Jaguar) with presumably even more games). \n\n\nSupposing that Atari57 is a longstanding benchmark including only these 57 Atari games, it seems likely that the survey participants interpreted the question as about only those games. Or at least about all Atari 2600 games, rather than every game associated with the company Atari.\n\n\nInterpreting it as written though, does Agent57’s success suggest that playing all Atari games is now feasible? My guess is yes, at least for Atari 2600 games. \n\n\nFifty-five of the fifty-seven games were proposed in [this paper](https://arxiv.org/pdf/1207.4708.pdf)[3](https://aiimpacts.org/atari-early/#easy-footnote-bottom-3-2351 \"Section 3.1.2, https://arxiv.org/pdf/1207.4708.pdf\"), which describes how they chose fifty of them: \n\n\n\n> \n> Our testing set was constructed by choosing semi-randomly from the 381 games listed on Wikipedia [http://en.wikipedia.org/wiki/List\\_of\\_Atari\\_2600\\_games (July 12, 2012)] at the time of writing. Of these games, 123 games have their own Wikipedia page, have a single player mode, are not adult-themed or prototypes, and can be emulated in ALE. From this list, 50 games were chosen at random to form the test set.\n> \n> \n> \n\n\nThe other five games in that paper were a ‘training set’, and I’m not sure where the other two came from, but as long as fifty of them were chosen fairly randomly, the provenance of the last seven doesn’t seem important.\n\n\nMy understanding is that none of the listed constraints should make the subset of games chosen particularly easy rather than random. So being able to play these games well suggests being able to play any Atari 2600 game well, without too much additional effort.\n\n\nThis might not be true if having chosen those games (about eight years ago), systems developed in the meantime are good for this particular set of games, but a different set of methods would have been needed had a different subset of games been chosen, to the extent that more than an additional year would be needed to close the gap now. My impression is that this isn’t very likely.\n\n\nIn sum, my guess is that respondents usually interpreted the ambiguous ‘all Atari games’ at least as narrowly as Atari 2600 games, and that a well resourced lab could now develop AI that played all Atari 2600 games within a year (e.g. plausibly DeepMind could already do that).\n\n\n**IV. Is there anything else wrong with it?**\n\n\nNot that I know of, but let’s wait a few weeks and see if anything comes up.\n\n\n~\n\n\nGiven all this, I think it is more likely than not that this Atari task is feasible now. Which would be interesting, because the [median 2016 survey response](https://aiimpacts.org/2016-expert-survey-on-progress-in-ai/#Answers-9) put a 10% chance on it being feasible in five years, i.e. by 2021.[4](https://aiimpacts.org/atari-early/#easy-footnote-bottom-4-2351 \"Though note that only 19 participants answered the question about when there was a 10% chance.
We surveyed 352 machine learning researchers publishing at top conferences, asking each a random subset of many questions. Some of these questions were about when they expected thirty-two concrete AI tasks would become ‘feasible’. We asked each of those questions in two slightly different ways. The relevant Atari questions had 19 and 20 responses for the two wordings, only one of which gave an answer for 2021.\") They more robustly put a median 50% chance on ten years out (2026).[5](https://aiimpacts.org/atari-early/#easy-footnote-bottom-5-2351 \"Half the time we asked about chances in N years, and half the time we asked about years until P probability, and people fairly consistently had earlier distributions when asked the second way. Both methods yielded a 50% chance in ten years here, though later the distributions diverge, with a 90% chance in 15 years yet a 60% chance in 20 years. Note that small numbers of different respondents answered each question, so inconsistency is not a huge red flag, though the consistent inconsistency across many questions is highly suspicious.\")\nIt’s exciting to resolve expert predictions about early tasks so we know more about how to treat their later predictions about human-level science research and the obsolescence of all human labor for instance. But we should probably wait for a few more before reading much into it. \n\n\nAt a glance, some other tasks which we are already learning something about, or might soon:\n\n\n* The ‘reading Aloud’ task[6](https://aiimpacts.org/atari-early/#easy-footnote-bottom-6-2351 \"‘Take a written passage and output a recording that can’t be distinguished from a voice actor, by an expert listener.’\") [seems to be coming along](https://www.descript.com/lyrebird-ai?source=lyrebird) to my very non-expert ear, but I know almost nothing about it.\n* It seems like we are [close on Starcraft](https://aiimpacts.org/the-unexpected-difficulty-of-comparing-alphastar-to-humans/) though as far as I know the prediction hasn’t been exactly resolved as stated.\n\n\n*1 April 2020*\n\n\n*Thanks to Rick Korzekwa, Jacob Hilton and Daniel Filan for answering many questions.*\n\n\nNotes\n-----\n\n\n\n", "url": "https://aiimpacts.org/atari-early/", "title": "Atari early", "source": "aiimpacts.org", "source_type": "wordpress", "date_published": "2020-04-02T06:02:18+00:00", "paged_url": "https://aiimpacts.org/feed?paged=8", "authors": ["Katja Grace"], "id": "596625c54244a9210d5c332b279cefe4", "summary": ["With DeepMind's Agent57 (summarized below), it seems that it is feasible to outperform professional game testers on all Atari games using no game-specific knowledge. Interestingly, in a 2016 survey, the median response put a small chance (10%) on this being feasible by 2021, and a medium chance (50%) of being feasible by 2026."]}
{"text": "Three kinds of competitiveness\n\n*By Daniel Kokotajlo, 30 March 2020*\n\n\nIn this post, I distinguish between three different kinds of competitiveness — Performance, Cost, and Date — and explain why I think these distinctions are worth the brainspace they occupy. For example, they help me introduce and discuss a problem for AI safety proposals having to do with aligned AIs being outcompeted by unaligned AIs. \n\n\nDistinguishing three kinds of competitiveness and competition\n-------------------------------------------------------------\n\n\nA system is *performance-competitive* insofar as its ability to perform relevant tasks compares with competing systems. If it is better than any competing system at the relevant tasks, it is very performance-competitive. If it is almost as good as the best competing system, it is less performance-competitive. \n\n\n\n(For AI in particular, “speed” “quality” and “collective” intelligence as [Bostrom defines them](https://www.lesswrong.com/posts/semvkn56ZFcXBNc2d/superintelligence-5-forms-of-superintelligence) all contribute to performance-competitiveness.) \n\n\n\nA system is *cost-competitive* to the extent that it costs less to build and/or operate than its competitors. If it is more expensive, it is less cost-competitive, and if it is much more expensive, it is not at all cost-competitive. \n\n\n\nA system is *date-competitive* to the extent that it can be created sooner (or not much later than) its competitors. If it can only be created after a prohibitive delay, it is not at all date-competitive. \n\n\n\nA *performance competition* is a competition that performance-competitiveness helps you win. The more important performance-competitiveness is to winning, the more intense the performance competition is. \n\n\n\nLikewise for cost and date competitions. Most competitions are all three types, to varying degrees. Some competitions are none of the types; e.g. a “competition” where the winner is chosen randomly. \n\n\n\nI briefly searched the AI alignment forum for uses of the word “competitive.” It seems that when people talk about competitiveness of AI systems, they [usually](https://www.alignmentforum.org/posts/H5gXpFtg93qDMZ6Xn/aligning-a-toy-model-of-optimization#oGdcKrWwPfwGzXNjT) mean performance-competitiveness, but [sometimes](https://www.alignmentforum.org/posts/5Kv2qNfRyXXihNrx2/ai-safety-debate-and-its-applications) mean cost-competitiveness, and [sometimes](https://www.alignmentforum.org/posts/ZHXutm7KpoWEj9G2s/an-unaligned-benchmark) both at once. Meanwhile, I suspect that [this important post](https://ai-alignment.com/prosaic-ai-control-b959644d79c2) can be summarized as “We should do prosaic AI alignment in case only prosaic AI is date-competitive.”\n\n\nPutting these distinctions to work\n----------------------------------\n\n\nFirst, I’ll sketch some different future scenarios. Then I’ll sketch how different AI safety schemes might be more or less viable depending on which scenario occurs. For me at least, having these distinctions handy makes this stuff easier to think and talk about. \n\n\n\n*Disclaimer: The three scenarios I sketch aren’t supposed to represent the scenarios I think most likely; similarly, my comments on the three safety proposals are mere hot takes. I’m just trying to illustrate how these distinctions can be used.* \n\n\n\n**Scenario: FOOM:** There is a level of performance which leads to a localized FOOM, i.e. very rapid gains in performance combined with very rapid drops in cost, all within a single AI system (or family of systems in a single AI lab). Moreover, these gains & drops are enough to give decisive strategic advantage to the faction that benefits from them. Thus, in this scenario, *control over the future is mostly a date competition.* If there are two competing AI projects, and one project is building a system which is twice as capable and half the price but takes 100 days longer to build, *that project will lose*. \n\n\n\n**Scenario: Gradual Economic Takeover:** The world economy gradually accelerates over several decades, and becomes increasingly dominated by billions of AGI agents. However, no one entity (AI or human, individual or group) has most of the power. In this scenario, *control over the future is mostly a cost and performance competition.* The values which shape the future will be the values of the bulk of the economy, and that in turn will be the values of the most popular and successful AGI designs, which in turn will be the designs that have the best combination of performance- and cost-competitiveness. Date-competitiveness is mostly irrelevant. \n\n\n\n**Scenario:** **Final Conflict:** It’s just like the Gradual Economic Takeover scenario, except that several powerful factions are maneuvering and scheming against each other, in a Final Conflict to decide the fate of the world. This Final Conflict takes almost a decade, and mostly involves “cold” warfare, propaganda, coalition-building, alliance-breaking, and that sort of thing. Importantly, the victor in this conflict will be determined not so much by economic might as by clever strategy; a less well resourced faction that is nevertheless more far-sighted and strategic will gradually undermine and overtake a larger/richer but more dysfunctional faction. In this context, having themost *capable* AI advisors is of the utmost importance; having your AIs be cheap is much less important.In this scenario, *control of the future is mostly a performance competition.* (Meanwhile, in this same scenario, popularity in the wider economy is a moderately intense competition of all three kinds.) \n\n\n\n**Proposal:** [**Value Learning**](https://www.alignmentforum.org/posts/5eX8ko7GCxwR5N9mN/what-is-ambitious-value-learning)**:** By this I mean schemes that take state-of-the-art AIs and train them to have human values. I currently think of these schemes as not very date-competitive, but pretty cost-competitive and very performance-competitive. I say value learning isn’t date-competitive because my impression is that it is probably harder to get right, and thus slower to get working, than other alignment proposals. Value learning would be better for the gradual economic takeover scenario because the world will change slowly, so we can afford to spend the time necessary to get it right, and once we do it’ll be a nice add-on to the existing state-of-the-art systems that won’t sacrifice much cost or performance. \n\n\n\n**Proposal:** [**Iterated Distillation and Amplification:**](https://ai-alignment.com/iterated-distillation-and-amplification-157debfd1616) By this I mean… well, it’s hard to summarize. It involves training AIs to imitate humans, and then scaling them up until they are arbitrarily powerful while still human-aligned. I currently think of this scheme as decently date-competitive but not as cost-competitive or performance-competitive. But lack of performance-competitiveness isn’t a problem in the FOOM scenario because IDA is above the threshold needed to go FOOM; similarly, lack of cost-competitiveness is only a minor problem because if they don’t have enough money already, the first project to build FOOM-capable AI will probably be able to attract a ton of investment (e.g. via being nationalized) without even using their AI for anything, and then reinvest that investment into paying the extra cost of aligning it via IDA. \n\n\n\n**Proposal:** [**Impact regularization:**](https://medium.com/@deepmindsafetyresearch/designing-agent-incentives-to-avoid-side-effects-e1ac80ea6107)By this I mean attempts to modify state-of-the-art AI designs so that they deliberately avoid having a big impact on the world. I think of this scheme as being cost-competitive and fairly date-competitive. I think of it as being performance-uncompetitive in some competitions, but performance-competitive in others. In particular, I suspect it would be very performance-uncompetitive in the Final Conflict scenario (because AI advisors of world leaders need to be impactful to do anything), yet nevertheless performance-competitive in the Gradual Economic Takeover scenario. \n\n\n\nPutting these distinctions to work again\n----------------------------------------\n\n\nI came up with these distinctions because they helped me puzzle through the following problem: \n\n\n\n\n> \n> Lots of people worry that in a vastly multipolar, hypercompetitive AI economy (such as described in Hanson’s *Age of Em* or Bostrom’s “Disneyland without children” scenario) eventually pretty much everything of merely intrinsic value will be stripped away from the economy; the world will be dominated by hyper-efficient self-replicators various kinds, performing their roles in the economy very well and seeking out new roles to populate but not spending any time on art, philosophy, leisure, etc. Some value might remain, but the overall situation will be Malthusian. \n> Well, why not apply this reasoning more broadly? Shouldn’t we be pessimistic about *any* AI alignment proposal that involves using aligned AI to compete with unaligned AIs? After all, at least one of the unaligned AIs will be willing to cut various ethical corners that the aligned AIs won’t, and this will give it an advantage.\n> \n> \n> \n\n\nThis problem is more serious the more the competition is cost-intensive and performance-intensive. Sacrificing things humans value is likely to lead to cost- and performance-competitiveness gains, so the more intense the competition is in those ways, the worse our outlook is. \n\n\n\nHowever, it’s plausible that the gains from such sacrifices are small. If so, we need only worry in scenarios of extremely intense cost and performance competition. \n\n\n\nMoreover, the extent to which the competition is date-intensive seems relevant. Optimizing away things humans value, and gradually outcompeting systems which didn’t do that, takes time. And plausibly, scenarios which are not at all date competitions are also very intense performance and cost competitions. (Given enough time, lots of different designs will appear, and minor differences in performance and cost will have time to overcome differences in luck.) On the other hand, aligning AI systems might take time too, so if the competition is *too* date-intensive things look grim also. Perhaps we should hope for a scenario in between, where control of the future is a moderate date competition. \n\n\n\nConcluding thoughts\n-------------------\n\n\nThese distinctions seem to have been useful for me. However, I could be overestimating their usefulness. Time will tell; we shall see if others make use of them. \n\n\n\nIf you think they would be better if the definitions were rebranded or modified, now would be a good time to say so! I currently expect that a year from now my opinions on which phrasings and definitions are most useful will have evolved. If so, I’ll come back and update this post.\n\n\n*30 March 2020*\n\n\n*Thanks to Katja Grace and Ben Pace for comments on a draft.* \n\n\n", "url": "https://aiimpacts.org/three-kinds-of-competitiveness/", "title": "Three kinds of competitiveness", "source": "aiimpacts.org", "source_type": "wordpress", "date_published": "2020-03-31T00:55:04+00:00", "paged_url": "https://aiimpacts.org/feed?paged=8", "authors": ["Daniel Kokotajlo"], "id": "27cd32bdbc23fa3129d8cc3406a11be8", "summary": []}
{"text": "AGI in a vulnerable world\n\n*By Asya Bergal, 25 March 2020*\n\n\nI’ve been thinking about a class of AI-takeoff scenarios where a very large number of people can build dangerous, unsafe AGI before anyone can build safe AGI. This seems particularly likely if:\n\n\n* It is considerably more difficult to build safe AGI than it is to build unsafe AGI.\n* AI progress is software-constrained rather than compute-constrained.\n* Compute available to individuals grows quickly and unsafe AGI turns out to be more of a straightforward extension of existing techniques than safe AGI is.\n* Organizations are bad at keeping software secret for a long time, i.e. it’s hard to get a considerable lead in developing anything.\n\t+ This may be because information security is bad, or because actors are willing to go to extreme measures (e.g. extortion) to get information out of researchers.\n\n\nAnother related scenario is one where safe AGI is built first, but isn’t defensively advantaged enough to protect against harms by unsafe AGI created soon afterward.\n\n\nThe intuition behind this class of scenarios comes from an extrapolation of what machine learning progress looks like now. It seems like large organizations make the majority of progress on the frontier, but smaller teams are close behind and [able to reproduce impressive results with dramatically fewer resources](https://www.fast.ai/2018/04/30/dawnbench-fastai/). I don’t think the large organizations making AI progress are (currently) well-equipped to keep software secret if motivated and well-resourced actors put effort into acquiring it. There are strong openness norms in the ML community as a whole, which means knowledge spreads quickly. I worry that there are strong incentives for progress to continue to be very open, since decreased openness can hamper an organization’s ability to recruit talent. If compute available to individuals increases a lot, and building unsafe AGI is much easier than building safe AGI, we could suddenly find ourselves in a [vulnerable world](https://nickbostrom.com/papers/vulnerable.pdf). \n\n\n\nI’m not sure if this is a meaningfully distinct or underemphasized class of scenarios within the AI risk space. My intuition is that there is more attention on incentives failures within a small number of actors, e.g. via arms races. I’m curious for feedback about whether many-people-can-build-AGI is a class of scenarios we should take seriously and if so, what things society could do to make them less likely, e.g. invest in high-effort info-security and secrecy work. AGI development seems much more likely to go existentially badly if more than a small number of well-resourced actors are able to create AGI.\n\n\n*25 March 2020*\n\n", "url": "https://aiimpacts.org/agi-in-a-vulnerable-world/", "title": "AGI in a vulnerable world", "source": "aiimpacts.org", "source_type": "wordpress", "date_published": "2020-03-26T00:05:46+00:00", "paged_url": "https://aiimpacts.org/feed?paged=8", "authors": ["Asya Bergal"], "id": "5623ec68303120bc86abba335e762bc5", "summary": []}
{"text": "2019 recent trends in GPU price per FLOPS\n\n*Published 25 March, 2020*\n\n\nWe estimate that in recent years, GPU prices have fallen at rates that would yield an order of magnitude over roughly:\n\n\n* 17 years for single-precision FLOPS\n* 10 years for half-precision FLOPS\n* 5 years for half-precision fused multiply-add FLOPS\n\n\nDetails\n=======\n\n\nGPUs (graphics processing units) are specialized electronic circuits originally used for computer graphics.[1](https://aiimpacts.org/2019-recent-trends-in-gpu-price-per-flops/#easy-footnote-bottom-1-2316 \"“A graphics processing unit (GPU) is a specialized electronic circuit designed to rapidly manipulate and alter memory to accelerate the creation of images in a frame buffer intended for output to a display device … Modern GPUs are very efficient at manipulating computer graphics and image processing … The term was popularized by Nvidia in 1999, who marketed the GeForce 256 as “the world’s first GPU”. It was presented as a “single-chip processor with integrated transform, lighting, triangle setup/clipping, and rendering engines”.”
“Graphics Processing Unit.” Wikipedia. Wikimedia Foundation, March 24, 2020. https://en.wikipedia.org/w/index.php?title=Graphics_processing_unit&oldid=947270104.\") In recent years, they have been popularly used for machine learning applications.[2](https://aiimpacts.org/2019-recent-trends-in-gpu-price-per-flops/#easy-footnote-bottom-2-2316 \"Fraenkel, Bernard. “Council Post: For Machine Learning, It’s All About GPUs.” Forbes. Forbes Magazine, December 8, 2017. https://www.forbes.com/sites/forbestechcouncil/2017/12/01/for-machine-learning-its-all-about-gpus/#5ed90c227699.\") One measure of GPU performance is FLOPS, the number of operations on floating-point numbers a GPU can perform in a second.[3](https://aiimpacts.org/2019-recent-trends-in-gpu-price-per-flops/#easy-footnote-bottom-3-2316 \"“In computing, floating point operations per second (FLOPS, flops or flop/s) is a measure of computer performance, useful in fields of scientific computations that require floating-point calculations. For such cases it is a more accurate measure than measuring instructions per second.”
“FLOPS.” Wikipedia. Wikimedia Foundation, March 24, 2020. https://en.wikipedia.org/w/index.php?title=FLOPS&oldid=947177339\") This page looks at the trends in GPU price / FLOPS of theoretical peak performance over the past 13 years. It does not include the cost of operating the GPUs, and it does not consider GPUs rented through cloud computing.\n\n\nTheoretical peak performance\n----------------------------\n\n\n‘Theoretical peak performance’ numbers appear to be determined by adding together the theoretical performances of the processing components of the GPU, which are calculated by multiplying the clock speed of the component by the number of instructions it can perform per cycle.[4](https://aiimpacts.org/2019-recent-trends-in-gpu-price-per-flops/#easy-footnote-bottom-4-2316 \"From this discussion on Nvidia’s forums about theoretical GFLOPS: “GPU theoretical flops calculation is similar conceptually. It will vary by GPU just as the CPU calculation varies by CPU architecture and model. To use K40m as an example: http://www.nvidia.com/content/PDF/kepler/Tesla-K40-PCIe-Passive-Board-Spec-BD-06902-001_v05.pdf
there are 15 SMs (2880/192), each with 64 DP ALUs that are capable of retiring one DP FMA instruction per cycle (== 2 DP Flops per cycle).
15 x 64 x 2 * 745MHz = 1.43 TFlops/sec
which is the stated perf:
\n\n\n\nhttp://www.nvidia.com/content/tesla/pdf/NVIDIA-Tesla-Kepler-Family-Datasheet.pdf “
\n\n\n\nPerson. “Comparing CPU and GPU Theoretical GFLOPS.” NVIDIA Developer Forums, May 21, 2014. https://forums.developer.nvidia.com/t/comparing-cpu-and-gpu-theoretical-gflops/33335.\") These numbers are given by the developer and may not reflect actual performance on a given application.[5](https://aiimpacts.org/2019-recent-trends-in-gpu-price-per-flops/#easy-footnote-bottom-5-2316 \"From this blog post on the performance of TensorCores, a component of new Nvidia GPUs specialized for deep learning: “The problem is it’s totally unclear how to approach the peak performance of 120 TFLOPS, and as far as I know, no one could achieve so significant speedup on real tasks. Let me know if you aware of good cases.”
Sapunov, Grigory. “Hardware for Deep Learning. Part 3: GPU.” Medium. Intento, January 20, 2020. https://blog.inten.to/hardware-for-deep-learning-part-3-gpu-8906c1644664.\")\nMetrics\n-------\n\n\nWe collected data on multiple slightly different measures of GPU price and FLOPS performance.\n\n\n### Price metrics\n\n\nGPU prices are divided into release prices, which reflect the manufacturer suggested retail prices that GPUs are originally sold at, and active prices, which are the prices at which GPUs are actually sold at over time, often by resellers.\n\n\nWe expect that active prices better represent prices available to hardware users, but collect release prices also, as supporting evidence.\n\n\n### FLOPS performance metrics\n\n\nSeveral varieties of ‘FLOPS’ can be distinguished based on the specifics of the operations they involve. Here we are interested in single-precision FLOPS, half-precision FLOPS, and half-precision fused-multiply add FLOPS.\n\n\n‘Single-precision’ and ‘half-precision’ refer to the number of bits used to specify a floating point number.[6](https://aiimpacts.org/2019-recent-trends-in-gpu-price-per-flops/#easy-footnote-bottom-6-2316 \"Gupta, Geetika. “Difference Between Single-, Double-, Multi-, Mixed-Precision: NVIDIA Blog.” The Official NVIDIA Blog, November 21, 2019. https://blogs.nvidia.com/blog/2019/11/15/whats-the-difference-between-single-double-multi-and-mixed-precision-computing/.\") Using more bits to specify a number achieves greater precision at the cost of more computational steps per calculation. Our data suggests that GPUs have largely been improving in single-precision performance in recent decades,[7](https://aiimpacts.org/2019-recent-trends-in-gpu-price-per-flops/#easy-footnote-bottom-7-2316 \"See our 2017 analysis, footnote 4, which notes that single-precision price performance seems to be improving while double-precision price performance is not\") and half-precision performance appears to be increasingly popular because it is adequate for deep learning.[8](https://aiimpacts.org/2019-recent-trends-in-gpu-price-per-flops/#easy-footnote-bottom-8-2316 \"“With the growing importance of deep learning and energy-saving approximate computing, half precision floating point arithmetic (FP16) is fast gaining popularity. Nvidia’s recent Pascal architecture was the first GPU that offered FP16 support.”
N. Ho and W. Wong, “Exploiting half precision arithmetic in Nvidia GPUs,” 2017 IEEE High Performance Extreme Computing Conference (HPEC), Waltham, MA, 2017, pp. 1-7.\")\nNvidia, the main provider of chips for machine learning applications,[9](https://aiimpacts.org/2019-recent-trends-in-gpu-price-per-flops/#easy-footnote-bottom-9-2316 \"“In a recent paper, Google revealed that its TPU can be up to 30x faster than a GPU for inference (the TPU can’t do training of neural networks). As the main provider of chips for machine learning applications, Nvidia took some issue with that, arguing that some of its existing inference chips were already highly competitive to the TPU.”
Armasu, Lucian. “On Tensors, Tensorflow, And Nvidia’s Latest ‘Tensor Cores’.” Tom’s Hardware. Tom’s Hardware, May 11, 2017. https://www.tomshardware.com/news/nvidia-tensor-core-tesla-v100,34384.html.\") recently released a series of GPUs featuring Tensor Cores,[10](https://aiimpacts.org/2019-recent-trends-in-gpu-price-per-flops/#easy-footnote-bottom-10-2316 \"“Tensor Cores in NVIDIA Volta GPU Architecture.” NVIDIA. Accessed May 2, 2020. https://www.nvidia.com/en-us/data-center/tensorcore/.
\") which claim to deliver “groundbreaking AI performance”. Tensor Core performance is measured in FLOPS, but they perform exclusively certain kinds of floating-point operations known as fused multiply-adds (FMAs).[11](https://aiimpacts.org/2019-recent-trends-in-gpu-price-per-flops/#easy-footnote-bottom-11-2316 \"“Volta is equipped with 640 Tensor Cores, each performing 64 floating-point fused-multiply-add (FMA) operations per clock. That delivers up to 125 TFLOPS for training and inference applications.”
“Tensor Cores in NVIDIA Volta GPU Architecture.” NVIDIA. Accessed March 25, 2020. https://www.nvidia.com/en-us/data-center/tensorcore/.\") Performance on these operations is important for certain kinds of deep learning performance,[12](https://aiimpacts.org/2019-recent-trends-in-gpu-price-per-flops/#easy-footnote-bottom-12-2316 \"“A useful operation in computer linear algebra is multiply-add: calculating the sum of a value c with a product of other values a x b to produce c + a x b. Typically, thousands of such products may be summed in a single accumulator for a model such as ResNet-50, with many millions of independent accumulations when running a model in deployment, and quadrillions of these for training models.”
Johnson, Jeff. “Making Floating Point Math Highly Efficient for AI Hardware.” Facebook AI Blog, November 8, 2018. https://ai.facebook.com/blog/making-floating-point-math-highly-efficient-for-ai-hardware/.\") so we track ‘GPU price / FMA FLOPS’ as well as ‘GPU price / FLOPS’. \n\n\n\nIn addition to purely half-precision computations, Tensor Cores are capable of performing mixed-precision computations, where part of the computation is done in half-precision and part in single-precision.[13](https://aiimpacts.org/2019-recent-trends-in-gpu-price-per-flops/#easy-footnote-bottom-13-2316 \"See Figure 2:
Gupta, Geetika. “Using Tensor Cores for Mixed-Precision Scientific Computing.” NVIDIA Developer Blog, April 19, 2019. https://devblogs.nvidia.com/tensor-cores-mixed-precision-scientific-computing/.\") Since explicitly mixed-precision-optimized hardware is quite recent, we don’t look at the trend in mixed-precision price performance, and only look at the trend in half-precision price performance.\n\n\n#### Precision tradeoffs\n\n\nAny GPU that performs multiple kinds of computations (single-precision, half-precision, half-precision fused multiply add) trades off performance on one for performance on the other, because there is limited space on the chip, and transistors must be allocated to either one type of computation or the other.[14](https://aiimpacts.org/2019-recent-trends-in-gpu-price-per-flops/#easy-footnote-bottom-14-2316 \"Three different individuals told us about this constraint, including one Nvidia employee.\") All current GPUs that perform half-precision or TensorCore fused-multiply-add computations also do single-precision computations, so they are splitting their transistor budget. For this reason, our impression is that half-precision FLOPS could be much cheaper now if entire GPUs were allocated to each one alone, rather than split between them.\n\n\nRelease date prices\n-------------------\n\n\nWe collected data on theoretical peak performance (FLOPS), release date, and price from several sources, including Wikipedia.[15](https://aiimpacts.org/2019-recent-trends-in-gpu-price-per-flops/#easy-footnote-bottom-15-2316 \"See the ‘Source’ column in this spreadsheet, tab ‘GPU Data’. We largely used TechPowerUp, Wikipedia’s List of Nvidia GPUs, List of AMD GPUs, and this document listing GPU performance.\") (Data is available in [this spreadsheet](https://docs.google.com/spreadsheets/d/1ZZm5Wgr3BDRtloTZGylWzYTaVr5VqjiwOiRNu5Pz_q8/edit?usp=sharing)). We found GPUs by looking at Wikipedia’s existing large lists[16](https://aiimpacts.org/2019-recent-trends-in-gpu-price-per-flops/#easy-footnote-bottom-16-2316 \"See Wikipedia’s List of Nvidia GPUs and List of AMD GPUs.\") and by Googling “popular GPUs” and “popular deep learning GPUs”. We included any hardware that was labeled as a ‘GPU’. We adjusted prices for inflation based on the consumer price index.[17](https://aiimpacts.org/2019-recent-trends-in-gpu-price-per-flops/#easy-footnote-bottom-17-2316 \"“CPI Home.” U.S. Bureau of Labor Statistics. U.S. Bureau of Labor Statistics. Accessed May 2, 2020. https://www.bls.gov/cpi/.\")\nWe were unable to find price and performance data for many popular GPUs and suspect that we are missing many from our list. In our search, we did not find any GPUs that beat our 2017 minimum of $0.03 (release price) / single-precision GFLOPS. We put out a $20 bounty on a popular Facebook group to find a cheaper GPU / FLOPS, and the bounty went unclaimed, so we are reasonably confident in this minimum.[18](https://aiimpacts.org/2019-recent-trends-in-gpu-price-per-flops/#easy-footnote-bottom-18-2316 \"The Facebook group is for posting and claiming bounties and has around 750 people, many with interests in computers. The bounty has been up for two months, as of March 13 2020.\")\n### GPU price / single-precision FLOPS\n\n\nFigure 1 shows our collected dataset for GPU price / single-precision FLOPS over time.[19](https://aiimpacts.org/2019-recent-trends-in-gpu-price-per-flops/#easy-footnote-bottom-19-2316 \"See this spreadsheet, tab ‘Cleaned GPU Data for SP’ for the chart generation.\")\n**Figure 1: Real GPU price / single-precision FLOPS over time. The vertical axis is log-scale. Price is measured in 2019 dollars.**\nTo find a clear trend for the prices of the cheapest GPUs / FLOPS, we looked at the running minimum prices every 10 days.[20](https://aiimpacts.org/2019-recent-trends-in-gpu-price-per-flops/#easy-footnote-bottom-20-2316 \"See this spreadsheet, tab ‘Cleaned GPU Data for SP Minimums’ for the plotting. We used this script on the data from the ‘Cleaned GPU Data for SP’ to calculate the minimums and then import them into a new sheet of the spreadsheet.\")\n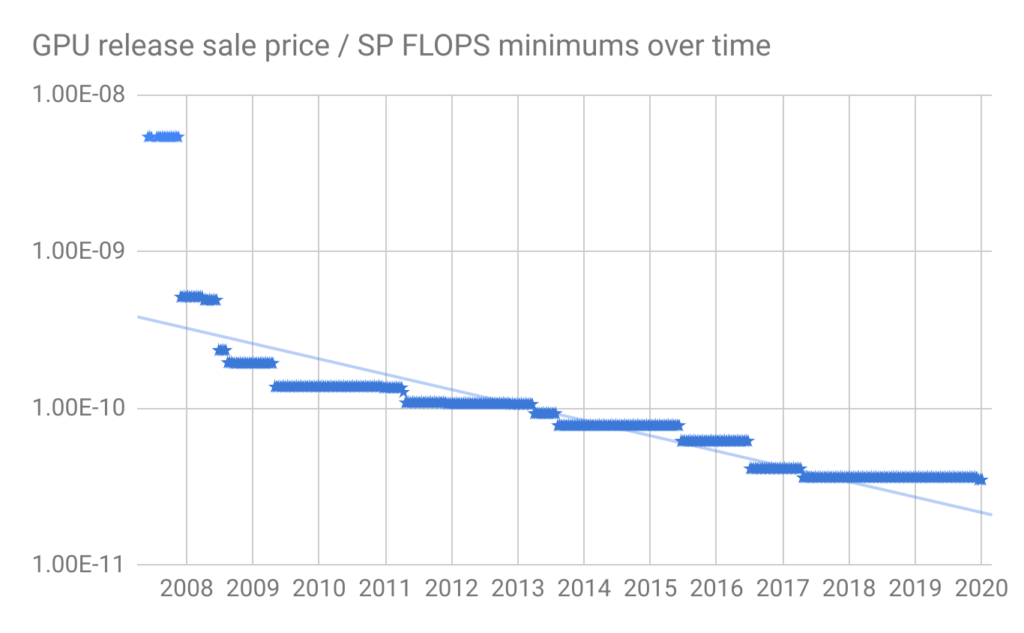**Figure 2: Ten-day minimums in real GPU price / single-precision FLOPS over time. The vertical axis is log-scale. Price is measured in 2019 dollars. The blue line shows the trendline ignoring data before late 2007. (We believe the apparent steep decline prior to late 2007 is an artefact of a lack of data for that time period.)**\nThe cheapest GPU price / FLOPS hardware using release date pricing has not decreased since 2017. However there was a similar period of stagnation between early 2009 and 2011, so this may not represent a slowing of the trend in the long run.\n\n\nBased on the figures above, the running minimums seem to follow a roughly exponential trend. If we do not include the initial point in 2007, (which we suspect is not in fact the cheapest hardware at the time), we get that the cheapest GPU price / single-precision FLOPS fell by around 17% per year, for a factor of ten in ~12.5 years.[21](https://aiimpacts.org/2019-recent-trends-in-gpu-price-per-flops/#easy-footnote-bottom-21-2316 \"See this spreadsheet, tab ‘Cleaned GPU Data for SP Minimums’ for the calculation.\")\n### GPU price / half-precision FLOPS\n\n\nFigure 3 shows GPU price / half-precision FLOPS for all the GPUs in our search above for which we could find half-precision theoretical performance.[22](https://aiimpacts.org/2019-recent-trends-in-gpu-price-per-flops/#easy-footnote-bottom-22-2316 \"See this spreadsheet, tab ‘Cleaned GPU Data for HP’ for the chart generation.\")\n**Figure 3: Real GPU price / half-precision FLOPS over time. The vertical axis is log-scale. Price is measured in 2019 dollars.**\nAgain, we looked at the running minimums of this graph every 10 days, shown in Figure 4 below.[23](https://aiimpacts.org/2019-recent-trends-in-gpu-price-per-flops/#easy-footnote-bottom-23-2316 \"See this spreadsheet, tab ‘Cleaned GPU Data for HP Minimums’ for the plotting. We used this script on the data from the ‘Cleaned GPU Data for HP’ to calculate the minimums and then import them into a new sheet of the spreadsheet.\")\n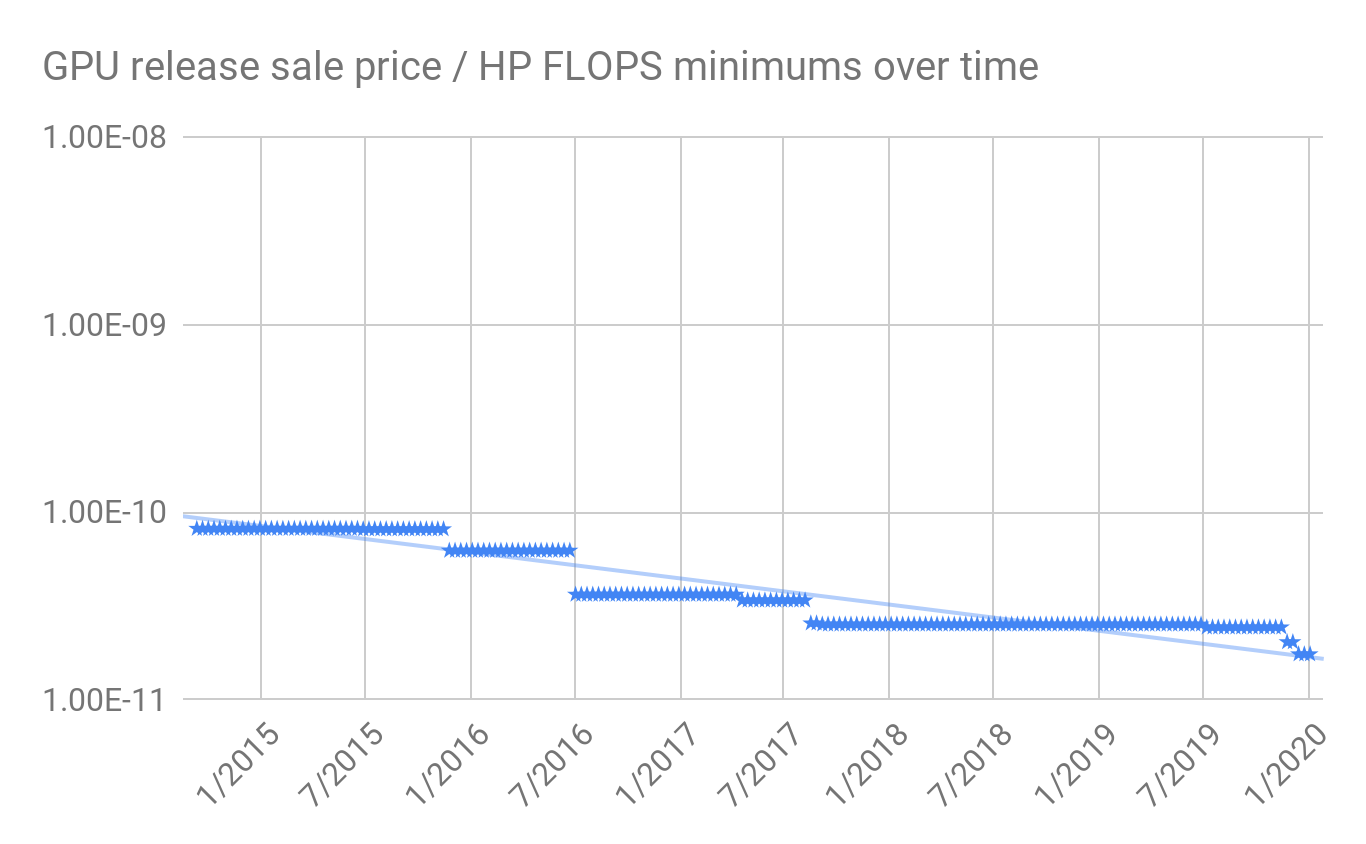**Figure 4: Minimums in real GPU price / half-precision FLOPS over time. The vertical axis is log-scale. Price is measured in 2019 dollars.**\nIf we assume an exponential trend with noise,[24](https://aiimpacts.org/2019-recent-trends-in-gpu-price-per-flops/#easy-footnote-bottom-24-2316 \"Where ambiguous, we assume these trends are exponential rather than linear, because our understanding is that that is much more common historically in computing hardware price trends.\") cheapest GPU price / half-precision FLOPS fell by around 26% per year, which would yield a factor of ten after ~8 years.[25](https://aiimpacts.org/2019-recent-trends-in-gpu-price-per-flops/#easy-footnote-bottom-25-2316 \"See this spreadsheet, tab ‘Cleaned GPU Data for HP Minimums’ for the calculation.\")\n### GPU price / half-precision FMA FLOPS\n\n\nFigure 5 shows GPU price / half-precision FMA FLOPS for all the GPUs in our search above for which we could find half-precision FMA theoretical performance.[26](https://aiimpacts.org/2019-recent-trends-in-gpu-price-per-flops/#easy-footnote-bottom-26-2316 \"See this spreadsheet, tab ‘Cleaned GPU Data for HP + Tensor Cores’ for the chart generation.\") (Note that this includes all of our half-precision data above, since those FLOPS could be used for fused-multiply adds in particular). GPUs with TensorCores are marked in red.\n\n\n**Figure 5: Real GPU price / half-precision FMA FLOPS over time. Price is measured in 2019 dollars.**\nFigure 6 shows the running minimums of GPU price / HP FMA FLOPS.[27](https://aiimpacts.org/2019-recent-trends-in-gpu-price-per-flops/#easy-footnote-bottom-27-2316 \"See this spreadsheet, tab ‘Cleaned GPU Data for HP + Tensor Cores Minimums’ for the plotting. We used this script on the data from the ‘Cleaned GPU Data for HP + Tensor Cores’ to calculate the minimums and then import them into a new sheet of the spreadsheet.\")\n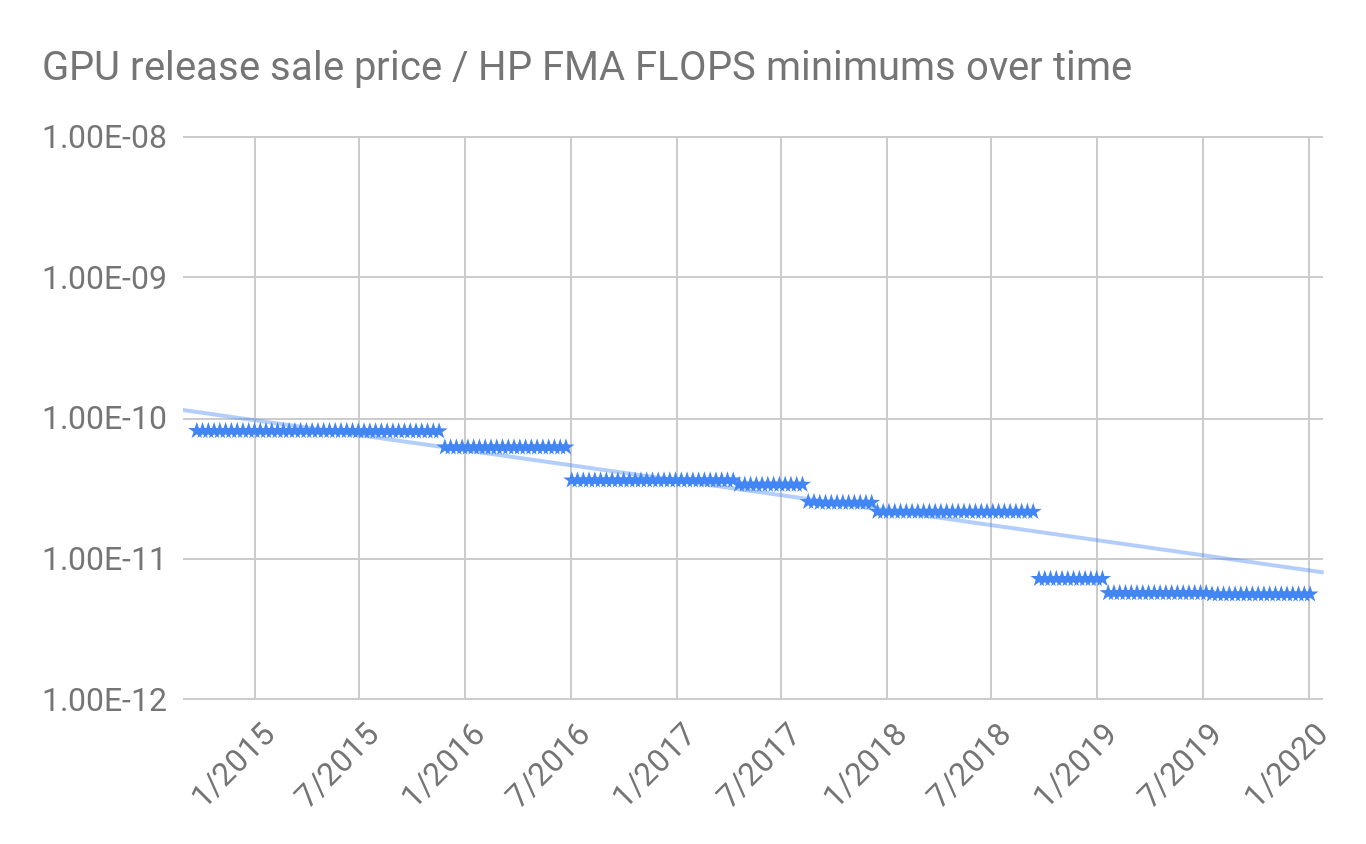**Figure 6: Minimums in real GPU price / half-precision FMA FLOPS over time. Price is measured in 2019 dollars.**\nGPU price / Half-Precision FMA FLOPS appears to be following an exponential trend over the last four years, falling by around 46% per year, for a factor of ten in ~4 years.[28](https://aiimpacts.org/2019-recent-trends-in-gpu-price-per-flops/#easy-footnote-bottom-28-2316 \"See this spreadsheet, tab ‘Cleaned GPU Data for HP + Tensor Cores Minimums’ for the calculation.\")\nActive Prices\n-------------\n\n\nGPU prices often go down from the time of release, and some popular GPUs are older ones that have gone down in price.[29](https://aiimpacts.org/2019-recent-trends-in-gpu-price-per-flops/#easy-footnote-bottom-29-2316 \"For example, one of the GPUs recommended for deep learning in this Reddit thread is the GTX 1060 (6GB), which has been around since 2016.\") Given this, it makes sense to look at active price data for the same GPU over time.\n\n\n### Data Sources\n\n\nWe collected data on peak theoretical performance in FLOPS from [TechPowerUp](https://www.techpowerup.com/)[30](https://aiimpacts.org/2019-recent-trends-in-gpu-price-per-flops/#easy-footnote-bottom-30-2316 \"We scraped data from individual TechPowerUp pages using this script. Our full scraped TechPowerUp dataset can be found here.\") and combined it with active GPU price data to get GPU price / FLOPS over time.[31](https://aiimpacts.org/2019-recent-trends-in-gpu-price-per-flops/#easy-footnote-bottom-31-2316 \"We chose to automatically scrape theoretical peak performance numbers from TechPowerUp instead of using the ones we manually collected above because there were several GPUs in the active pricing datasets that we hadn’t collected data for manually, and it was easier to scrape the entire site than just the subset of GPUs we needed.\") Our primary source of historical pricing data was Passmark, though we also found a less trustworthy dataset on Kaggle which we used to check our analysis. We adjusted prices for inflation based on the consumer price index.[32](https://aiimpacts.org/2019-recent-trends-in-gpu-price-per-flops/#easy-footnote-bottom-32-2316 \"“CPI Home.” U.S. Bureau of Labor Statistics. U.S. Bureau of Labor Statistics. Accessed May 2, 2020. https://www.bls.gov/cpi/.\")\n#### Passmark\n\n\nWe scraped pricing data[33](https://aiimpacts.org/2019-recent-trends-in-gpu-price-per-flops/#easy-footnote-bottom-33-2316 \"We used this script.\") on GPUs between 2011 and early 2020 from Passmark.[34](https://aiimpacts.org/2019-recent-trends-in-gpu-price-per-flops/#easy-footnote-bottom-34-2316 \"“PassMark – GeForce GTX 660 – Price Performance Comparison.” Accessed March 24, 2020. https://www.videocardbenchmark.net/gpu.php?gpu=GeForce+GTX+660&id=2152.\") Where necessary, we renamed GPUs from Passmark to be consistent with TechPowerUp.[35](https://aiimpacts.org/2019-recent-trends-in-gpu-price-per-flops/#easy-footnote-bottom-35-2316 \"In most cases where renaming was necessary, the same GPU had multiple clear names, e.g. the “Radeon HD 7970 / R9 280X” in PassMark was just called the “Radeon HD 7970” in TechPowerUp. In a few cases, Passmark listed some GPUs which TechPowerUp listed separately as one GPU, e.g. “Radeon R9 290X / 390X” seemed to ambiguously refer to the Radeon R9 290X or Radeon R9 390X. In these cases, we conservatively assume that the GPU refers to the less powerful / earlier GPU. In one exceptional case, we assumed that the “Radeon R9 Fury + Fury X” referred to the Radeon Fury X in PassMark. The ambiguously named GPUs were not in the minimum data we calculated, so probably did not have a strong effect on the final result.\") The Passmark data consists of 38,138 price points for 352 GPUs. We guess that these represent most popular GPUs. \n\n\n\nLooking at the ‘current prices’ listed on individual Passmark GPU pages, prices appear to be sourced from Amazon, Newegg, and Ebay. Passmark’s listed pricing data does not correspond to regular intervals. We don’t know if prices were pulled at irregular intervals, or if Passmark pulls prices regularly and then only lists major changes as price points. When we see a price point, we treat it as though the GPU is that price only at that time point, not indefinitely into the future. \n\n\n\nThe data contains several blips where a GPU is briefly sold very unusually cheaply. A random checking of some of these suggests to us that these correspond to single or small numbers of GPUs for sale, which we are not interested in tracking, because we are trying to predict AI progress, which presumably isn’t influenced by temporary discounts on tiny batches of GPUs. \n\n\n\n#### Kaggle\n\n\n[This Kaggle dataset](https://www.kaggle.com/raczeq/ethereum-effect-pc-parts) contains scraped data of GPU prices from price comparison sites PriceSpy.co.uk, PCPartPicker.com, Geizhals.eu from the years 2013 – 2018. The Kaggle dataset has 319,147 price points for 284 GPUs. Unfortunately, at least some of the data is clearly wrong, potentially because price comparison sites include pricing data from untrustworthy merchants.[36](https://aiimpacts.org/2019-recent-trends-in-gpu-price-per-flops/#easy-footnote-bottom-36-2316 \"For example, the Kaggle dataset includes extremely cheap FirePro S7150s sold in 2014, even though the FirePro S7150 only came out in 2016. One of the sellers of these cheap GPUs were ‘Club 3D’, which also appeared to sell several other erroneously cheap GPUs.\") As such, we don’t use the Kaggle data directly in our analysis, but do use it as a check on our Passmark data. The data that we get from Passmark roughly appears to be a subset of the Kaggle data from 2013 – 2018,[37](https://aiimpacts.org/2019-recent-trends-in-gpu-price-per-flops/#easy-footnote-bottom-37-2316 \"See this plot of Passmark single-precision GPU price / FLOPS compared to the combined Passmark and Kaggle single-precision GPU price / FLOPS, and this plot of Passmark half-precision GPU price / FLOPS compared to the combined Passmark and Kaggle half-precision $ / FLOPS. In both cases the 2013 – 2018 Passmark data appears to roughly be a subset of the Kaggle data.\") which is what we would expect if the price comparison engines picked up prices from the merchants Passmark looks at.\n\n\n#### Limitations\n\n\nThere are a number of reasons why we think this analysis may in fact not reflect GPU price trends:\n\n\n* We effectively have just one source of pricing data, Passmark.\n* Passmark appears to only look at Amazon, Newegg, and Ebay for pricing data.\n* We are not sure, but we suspect that Passmark only looks at the U.S. versions of Amazon, Newegg, and Ebay, and pricing may be significantly different in other parts of the world (though we guess it wouldn’t be different enough to change the general trend much).\n* As mentioned above, we are not sure if Passmark pulls price data regularly and only lists major price changes, or pulls price data irregularly. If the former is true, our data may be overrepresenting periods where the price changes dramatically.\n* None of the price data we found includes quantities of GPUs which were available at that price, which means some prices may be for only a very limited number of GPUs.\n* We don’t know how much the prices from these datasets reflect the prices that a company pays when buying GPUs in bulk, which we may be more interested in tracking.\n\n\nA better version of this analysis might start with more complete data from price comparison engines (along the lines of the Kaggle dataset) and then filter out clearly erroneous pricing information in some principled way.\n\n\n### Data\n\n\nThe original scraped datasets with cards renamed to match TechPowerUp can be found [here](https://drive.google.com/drive/folders/1cCjG_sUUePxbh5fN9ViOPX6GW9D2GyPJ?usp=sharing). GPU price / FLOPS data is graphed on a log scale in the figures below. Price points for the same GPU are marked in the same color. We adjusted prices for inflation using the consumer price index.[38](https://aiimpacts.org/2019-recent-trends-in-gpu-price-per-flops/#easy-footnote-bottom-38-2316 \"“CPI Home.” U.S. Bureau of Labor Statistics. U.S. Bureau of Labor Statistics. Accessed May 2, 2020. https://www.bls.gov/cpi/.\") All points below are in 2019 dollars.\n\n\nTo try to filter out noisy prices that didn’t last or were only available in small numbers, we took out the lowest 5% of data in every several day period[39](https://aiimpacts.org/2019-recent-trends-in-gpu-price-per-flops/#easy-footnote-bottom-39-2316 \"We set this period to be 10 days long when looking at single-precision data, and 30 days long when looking at half-precision data, since half-precision data was significantly more sparse.\") to get the 95th percentile cheapest hardware. We then found linear and exponential trendlines of best fit through the available hardware with the lowest GPU price / FLOPS every several days.[40](https://aiimpacts.org/2019-recent-trends-in-gpu-price-per-flops/#easy-footnote-bottom-40-2316 \"This calculation can be found in this spreadsheet.\")\n#### GPU price / single-precision FLOPS\n\n\nFigures 7-10 show the raw data, 95th percentile data, and trendlines for single-precision GPU price / FLOPS for the Passmark dataset. [This folder](https://drive.google.com/open?id=1-PEl2kSORRH78Qa4huRF-t_g_m1QOTDs) contains plots of all our datasets, including the Kaggle dataset and combined Passmark + Kaggle dataset.[41](https://aiimpacts.org/2019-recent-trends-in-gpu-price-per-flops/#easy-footnote-bottom-41-2316 \"We used a Python plotting library to generate our plots, the script can be found here. All of our resulting plots can be found here. ‘single’ vs. ‘half’ refers to whether its $ / FLOPS data for single or half-precision FLOPS, ‘passmark’, ‘kaggle’, and ‘combined’ refer to which dataset is being plotted and ‘raw’ vs. ‘95’ refer to whether we’re plotting all the data or the 95th percentile data.\")\n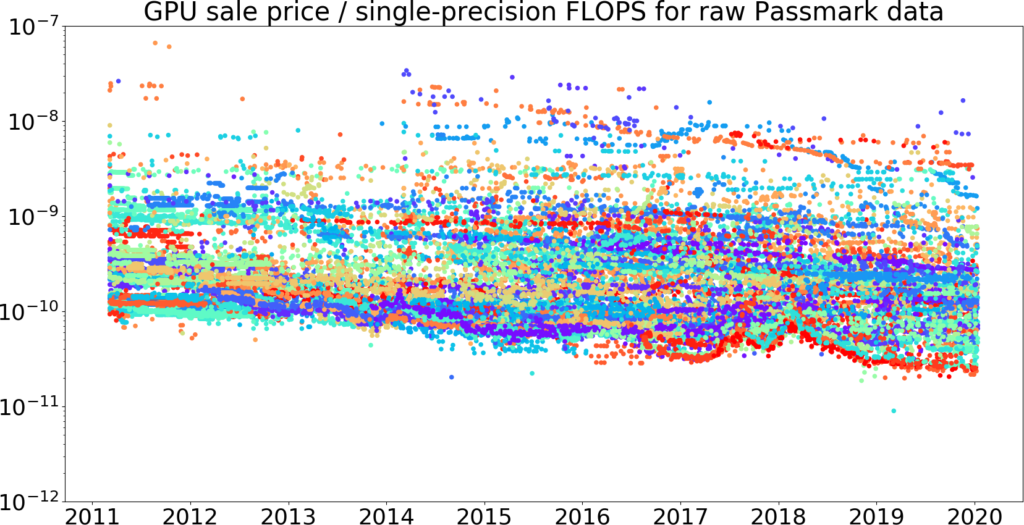 \n**Figure 7: GPU price / single-precision FLOPS over time, taken from our Passmark dataset.[42](https://aiimpacts.org/2019-recent-trends-in-gpu-price-per-flops/#easy-footnote-bottom-42-2316 \"The dataset we used for this plot can be found here. This a processed version of our scraped dataset, with prices / FLOPS adjusted for inflation. The script we used to process and plot can be found here.\") Price is measured in 2019 dollars. [This picture](https://drive.google.com/open?id=194Tqrcix2XdytbT-WbgcRbFpeHIHqsao) shows that the Kaggle data does appear to be a superset of the Passmark data from 2013 – 2018, giving us some evidence that the Passmark data is correct. The vertical axis is log-scale.**\n\n\n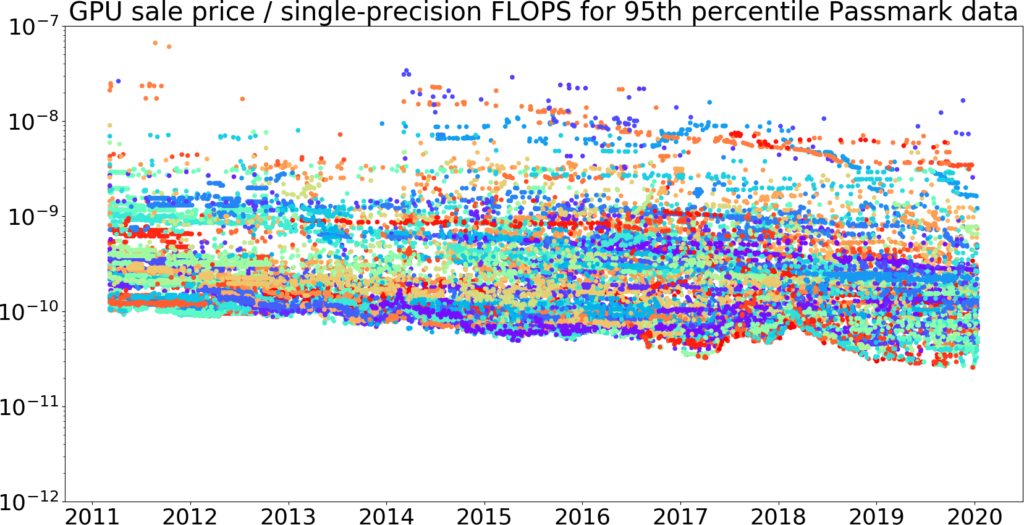 \n**Figure 8: The top 95% of data every 10 days for GPU price / single-precision FLOPS over time, taken from the Passmark dataset we plotted above. (Figure 7 with the cheapest 5% removed.) The vertical axis is log-scale.[43](https://aiimpacts.org/2019-recent-trends-in-gpu-price-per-flops/#easy-footnote-bottom-43-2316 \"The script to calculate the 95th percentile and generate this plot can be found here.\")**\n\n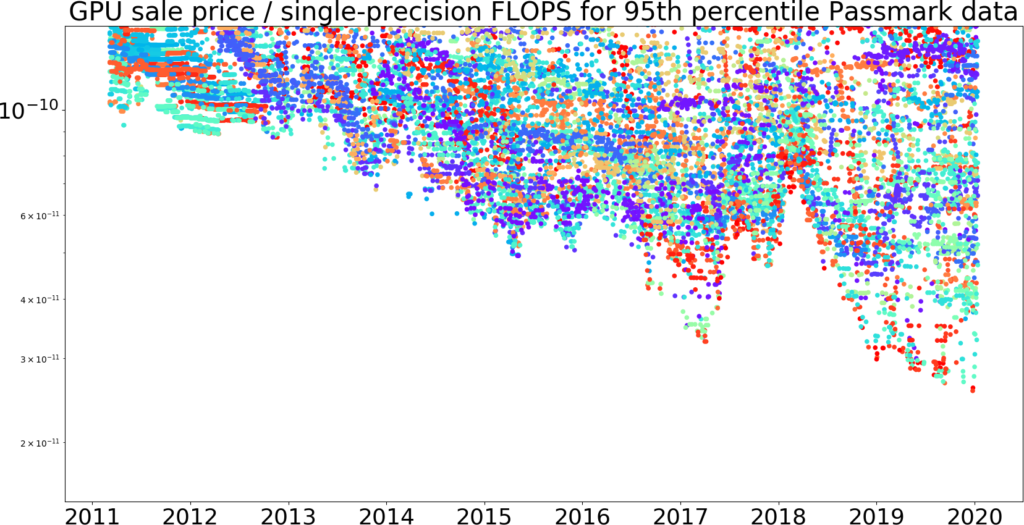 \n**Figure 9: The same data as Figure 8, with the vertical axis zoomed-in.**\n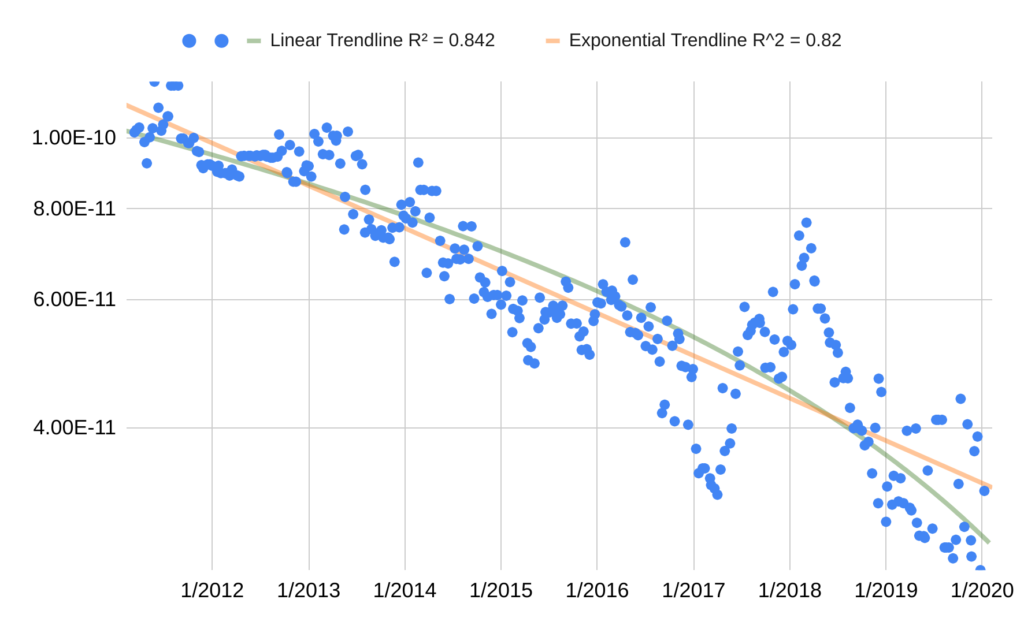**Figure 10: The minimum data points from the top 95% of the Passmark dataset, taken every 10 days. We fit linear and exponential trendlines through the data. The vertical axis is log-scale.[44](https://aiimpacts.org/2019-recent-trends-in-gpu-price-per-flops/#easy-footnote-bottom-44-2316 \"See here, tab ‘Passmark SP Minimums’ to see our calculation of the minimums over time. We used this script to generate the minimums, then imported them into this spreadsheet.\")**\n##### Analysis\n\n\nThe cheapest 95th percentile data every 10 days appears to fit relatively well to both a linear and exponential trendline. However we assume that progress will follow an exponential, because previous progress has [followed an exponential](https://aiimpacts.org/recent-trend-in-the-cost-of-computing/). \n\n\n\nIn the Passmark dataset, the exponential trendline suggested that from 2011 to 2020, 95th-percentile GPU price / single-precision FLOPS fell by around 13% per year, for a factor of ten in ~17 years,[45](https://aiimpacts.org/2019-recent-trends-in-gpu-price-per-flops/#easy-footnote-bottom-45-2316 \"You can see our calculations for this here, sheet ‘Passmark SP Minimums’. Each sheet has a cell ‘Rate to move an order of magnitude’ which has our calculation for how many years we need to move an order of magnitude. In the (untrustworthy) Kaggle dataset alone, its rate would yield an order of magnitude of decrease every ~12 years, and the rate in the combined dataset would yield an order of magnitude of decrease every ~16 years.\") bootstrap[46](https://aiimpacts.org/2019-recent-trends-in-gpu-price-per-flops/#easy-footnote-bottom-46-2316 \"Orloff, Jeremy, and Jonathan Bloom. “Bootstrap Confidence Intervals.” MIT OpenCourseWare, 2014. https://ocw.mit.edu/courses/mathematics/18-05-introduction-to-probability-and-statistics-spring-2014/readings/MIT18_05S14_Reading24.pdf.\") 95% confidence interval 16.3 to 18.1 years.[47](https://aiimpacts.org/2019-recent-trends-in-gpu-price-per-flops/#easy-footnote-bottom-47-2316 \"We used this script to generate bootstrap confidence intervals for our datasets.\") We believe the rise in price / FLOPS in 2017 corresponds to a rise in GPU prices due to increased demand from cryptocurrency miners.[48](https://aiimpacts.org/2019-recent-trends-in-gpu-price-per-flops/#easy-footnote-bottom-48-2316 \"We think this is the case because we’ve observed this dip in other GPU analyses we’ve done, and because the timing lines up: the first table in this article shows how GPU prices were increasing starting 2017 and continued to increase through 2018, and the chart here shows how GPU prices increased in 2017.\") If we instead look at the trend from 2011 through 2016, before the cryptocurrency rise, we instead get that 95th-percentile GPU price / single-precision FLOPS price fell by around 13% per year, for a factor of ten in ~16 years.[49](https://aiimpacts.org/2019-recent-trends-in-gpu-price-per-flops/#easy-footnote-bottom-49-2316 \"You can see our calculations for this here, sheet ‘Passmark SP Minimums’, next to ‘Exponential trendline from 2015 to 2016. The trendline calculated is technically the linear fit through the log of the data.\")\nThis is slower than the order of magnitude every ~12.5 years we found when looking at release prices. If we restrict the release price data to 2011 – 2019, we get an order of magnitude decrease every ~13.5 years instead,[50](https://aiimpacts.org/2019-recent-trends-in-gpu-price-per-flops/#easy-footnote-bottom-50-2316 \"See our calculation here, tab ‘Cleaned GPU Data for SP Minimums’, next to the cell marked “Exponential trendline from 2011 to 2019.”\") so part of the discrepancy can be explained because of the different start times of the datasets. To get some assurance that our active price data wasn’t erroneous, we spot checked the best active price at the start of 2011, which was somewhat lower than the best release price at the same time, and confirmed that its given price was consistent with surrounding pricing data.[51](https://aiimpacts.org/2019-recent-trends-in-gpu-price-per-flops/#easy-footnote-bottom-51-2316 \"At the start of 2011, the minimum release price / FLOPS (see tab, ‘Cleaned GPU Data for SP Minimums’) is .000135 $ / FLOPS, whereas the minimum active price / FLOPS (see tab, ‘Passmark SP Minimums’) is around .0001 $ / FLOPS. The initial GPU price / FLOPS minimum (see sheet ‘Passmark SP Minimums’) corresponds to the Radeon HD 5850 which had a price of $184.9 in 3/2011 and a release price of $259. Looking at the general trend in Passmark suggests that the Radeon HD 5850 did indeed rapidly decline from its $259 release price to consistently below $200 prices.\") We think active prices are likely to be closer to the prices at which people actually bought GPUs, so we guess that ~17 years / order of magnitude decrease is a more accurate estimate of the trend we care about.\n\n\n#### GPU price / half-precision FLOPS\n\n\nFigures 11-14 show the raw data, 95th percentile data, and trendlines for half-precision GPU price / FLOPS for the Passmark dataset. [This folder](https://drive.google.com/open?id=1-PEl2kSORRH78Qa4huRF-t_g_m1QOTDs) contains plots of the Kaggle dataset and combined Passmark + Kaggle dataset.\n\n\n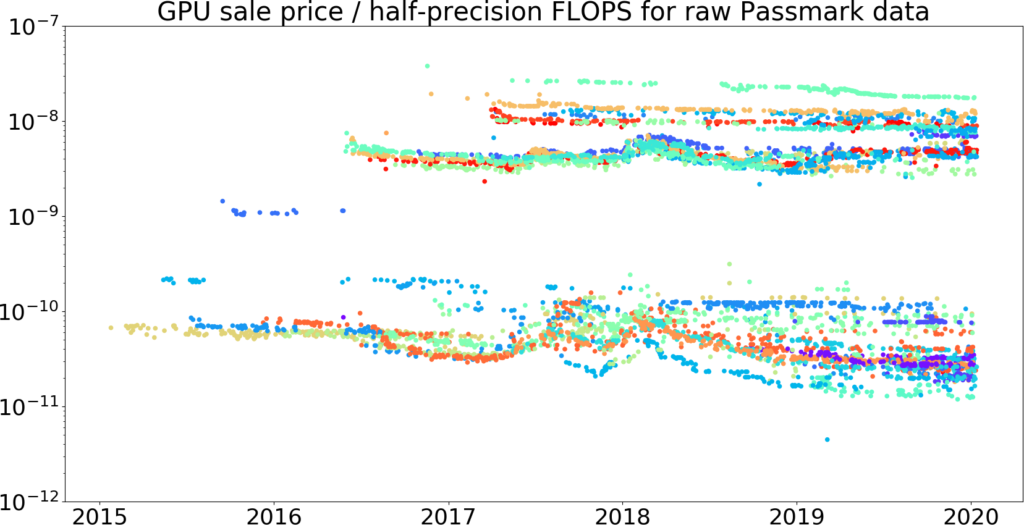 \n **Figure 11: GPU price / half-precision FLOPS over time, taken from our Passmark dataset. Price is measured in 2019 dollars.[52](https://aiimpacts.org/2019-recent-trends-in-gpu-price-per-flops/#easy-footnote-bottom-52-2316 \" The dataset we used for this plot can be found here. This is a processed version of our scraped dataset, with prices / FLOPS adjusted for inflation. The script we used to process and plot can be found here.\") This picture shows that the Kaggle data does appear to be a superset of the Passmark data from 2013 – 2018, giving us some evidence that the Passmark data is reasonable. The vertical axis is log-scale.**\n\n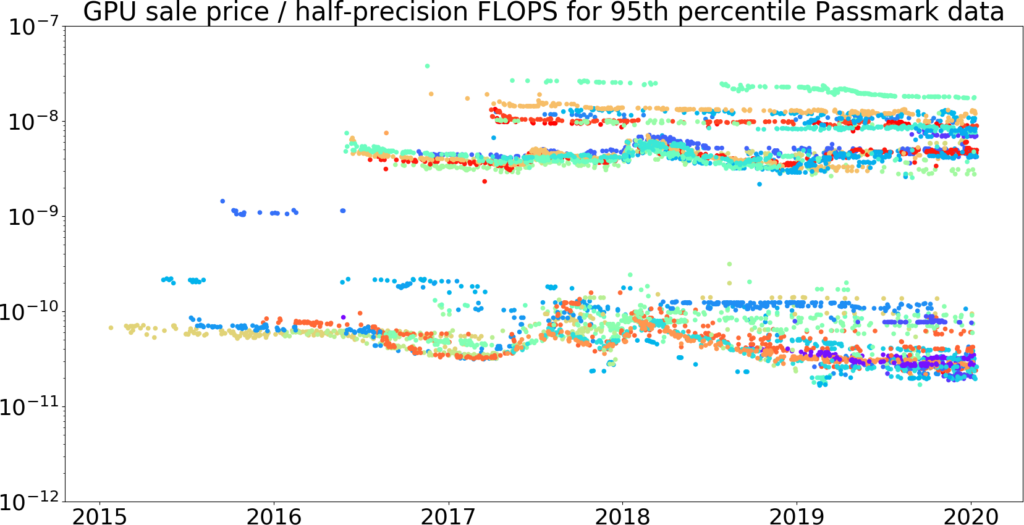 \n**Figure 12: The top 95% of data every 30 days for GPU price / half-precision FLOPS over time, taken from the Passmark dataset we plotted above. (Figure 11 with the cheapest 5% removed.) The vertical axis is log-scale.[53](https://aiimpacts.org/2019-recent-trends-in-gpu-price-per-flops/#easy-footnote-bottom-53-2316 \"The script to calculate the 95th percentile and generate this plot can be found here.\")**\n\n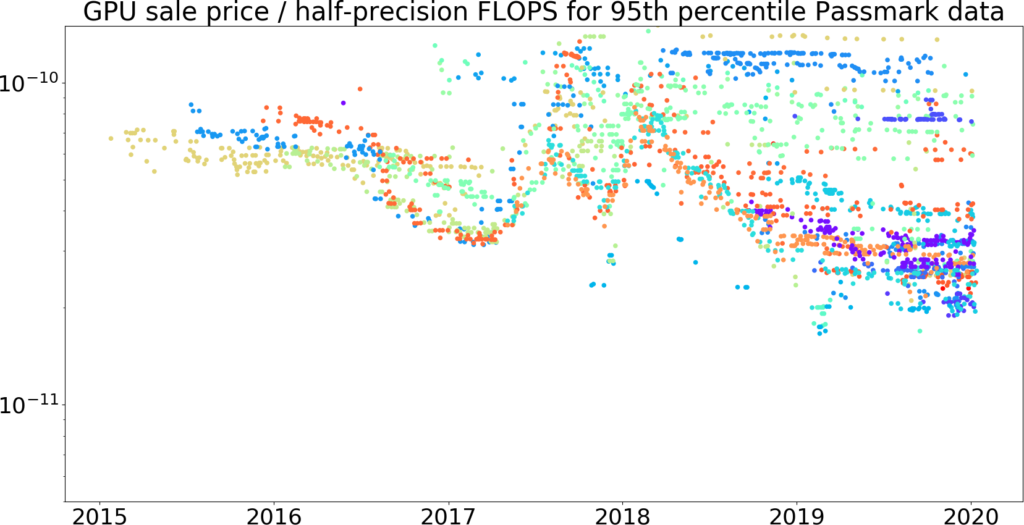 \n**Figure 13: The same data as Figure 12, with the vertical axis zoomed-in.**\n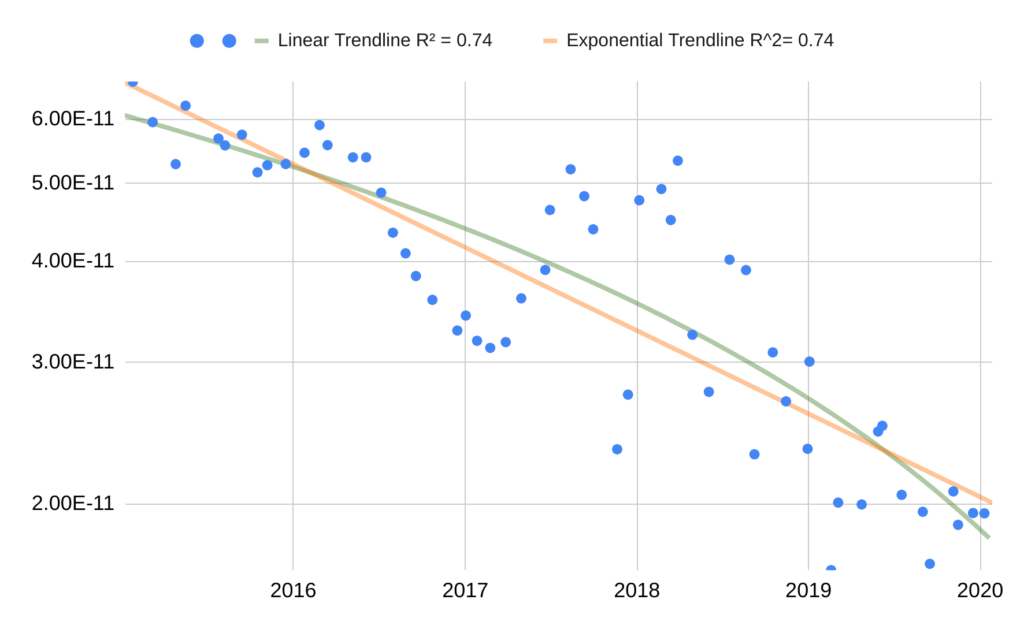**Figure 14: The minimum data points from the top 95% of the Passmark dataset, taken every 30 days. We fit linear and exponential trendlines through the data. The vertical axis is log-scale.[54](https://aiimpacts.org/2019-recent-trends-in-gpu-price-per-flops/#easy-footnote-bottom-54-2316 \"See here, tab ‘Passmark HP Minimums’ to see our calculation of the minimums over time. We used this script to generate the minimums, then imported them into this spreadsheet.\")**\n##### Analysis\n\n\nIf we assume the trend is exponential, the Passmark trend seems to suggest that from 2015 to 2020, 95th-percentile GPU price / half-precision FLOPS of GPUs has fallen by around 21% per year, for a factor of ten over ~10 years,[55](https://aiimpacts.org/2019-recent-trends-in-gpu-price-per-flops/#easy-footnote-bottom-55-2316 \"See the sheet marked ‘Passmark HP minimums’ in this spreadsheet. The trendline calculated is technically the linear fit through the log of the data.\") bootstrap[56](https://aiimpacts.org/2019-recent-trends-in-gpu-price-per-flops/#easy-footnote-bottom-56-2316 \"Orloff, Jeremy, and Jonathan Bloom. “Bootstrap Confidence Intervals.” MIT OpenCourseWare, 2014. https://ocw.mit.edu/courses/mathematics/18-05-introduction-to-probability-and-statistics-spring-2014/readings/MIT18_05S14_Reading24.pdf.\") 95% confidence interval 8.8 to 11 years.[57](https://aiimpacts.org/2019-recent-trends-in-gpu-price-per-flops/#easy-footnote-bottom-57-2316 \"We used this script to generate bootstrap confidence intervals for our datasets.\") This is fairly close to the ~8 years / order of magnitude decrease we found when looking at release price data, but we treat active prices as a more accurate estimate of the actual prices at which people bought GPUs. As in our previous dataset, there is a noticeable rise in 2017, which we think is due to GPU prices increasing as a result of cryptocurrency miners. If we look at the trend from 2015 through 2016, before this rise, we get that 95th-percentile GPU price / half-precision FLOPS has fallen by around 14% per year, which would yield a factor of ten over ~8 years.[58](https://aiimpacts.org/2019-recent-trends-in-gpu-price-per-flops/#easy-footnote-bottom-58-2316 \"See the sheet marked ‘Passmark HP minimums’ in this spreadsheet.\")\n#### GPU price / half-precision FMA FLOPS\n\n\nFigures 15-18 show the raw data, 95th percentile data, and trendlines for half-precision GPU price / FMA FLOPS for the Passmark dataset. GPUs with Tensor Cores are marked in black. [This folder](https://drive.google.com/open?id=1-PEl2kSORRH78Qa4huRF-t_g_m1QOTDs) contains plots of the Kaggle dataset and combined Passmark + Kaggle dataset.\n\n\n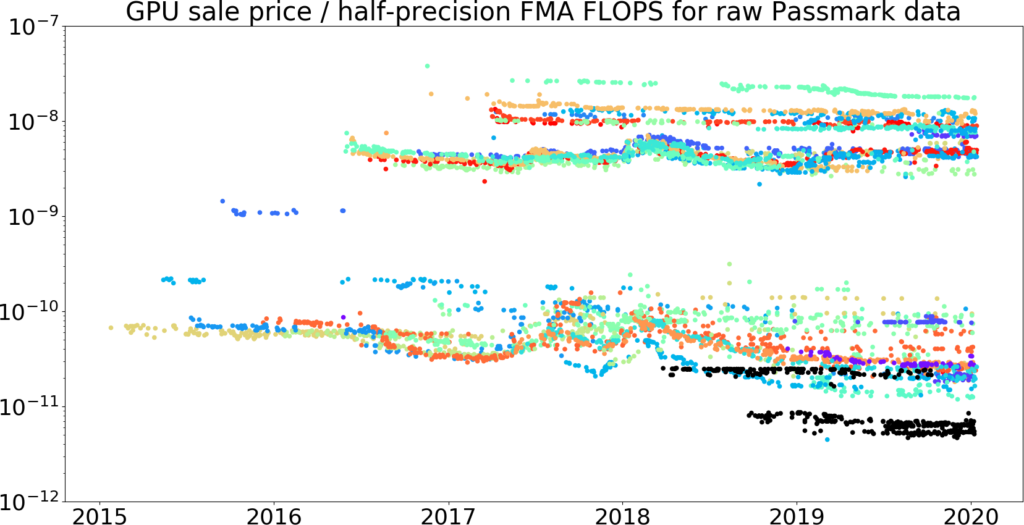 \n**Figure 15: GPU price / half-precision FMA FLOPS over time, taken from our Passmark dataset.[59](https://aiimpacts.org/2019-recent-trends-in-gpu-price-per-flops/#easy-footnote-bottom-59-2316 \"The dataset we used for this plot can be found here. This a processed version of our scraped dataset, with prices / FLOPS adjusted for inflation. The script we used to process and plot can be found here.\") price is measured in 2019 dollars. This picture shows that the Kaggle data does appear to be a superset of the Passmark data from 2013 – 2018, giving us some evidence that the Passmark data is correct. The vertical axis is log-scale.**\n\n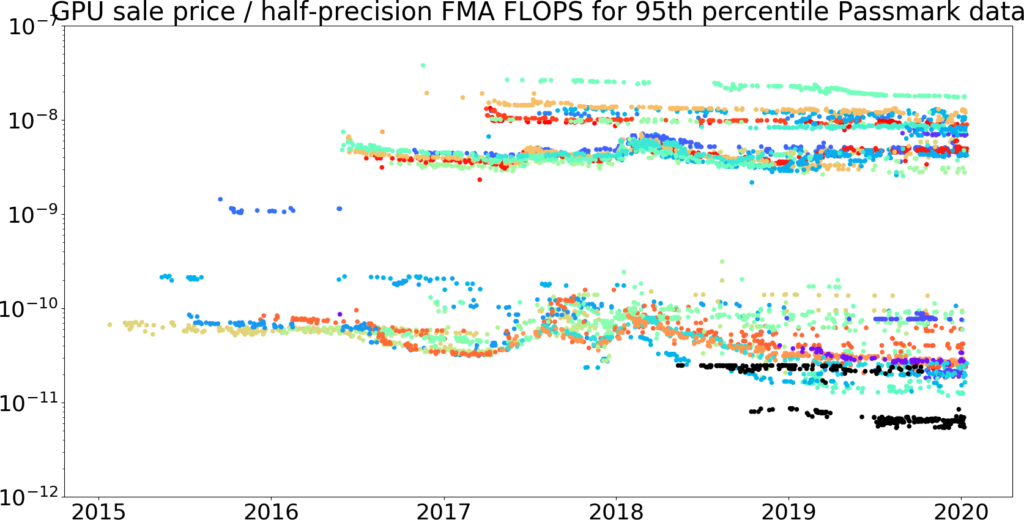 \n**Figure 16: The top 95% of data every 30 days for GPU price / half-precision FMA FLOPS over time, taken from the Passmark dataset we plotted above.[60](https://aiimpacts.org/2019-recent-trends-in-gpu-price-per-flops/#easy-footnote-bottom-60-2316 \"The script to calculate the 95th percentile and generate this plot can be found here.\") (Figure 15 with the cheapest 5% removed.)**\n\n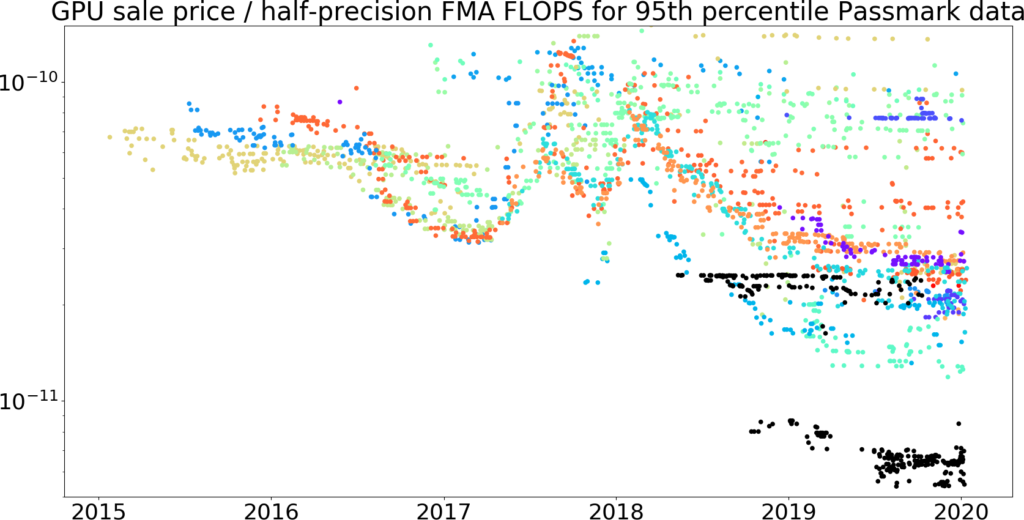 \n**Figure 17: The same data as Figure 16, with the vertical axis zoomed-in.**\n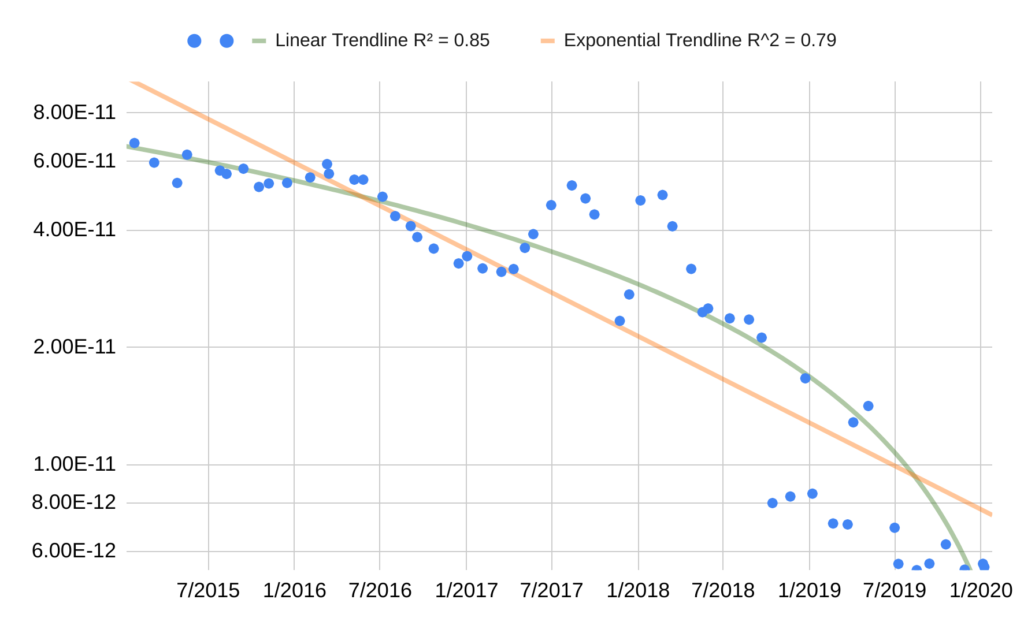**Figure 18: The minimum data points from the top 95% of the Passmark dataset, taken every 30 days. We fit linear and exponential trendlines through the data.[61](https://aiimpacts.org/2019-recent-trends-in-gpu-price-per-flops/#easy-footnote-bottom-61-2316 \"See here, tab ‘Passmark HP FMA Minimums’ to see our calculation of the minimums over time. We used this script to generate the minimums, then imported them into this spreadsheet.\")**\n##### Analysis\n\n\nIf we assume the trend is exponential, the Passmark trend seems to suggest the 95th-percentile GPU price / half-precision FMA FLOPS of GPUs has fallen by around 40% per year, which would yield a factor of ten in ~4.5 years,[62](https://aiimpacts.org/2019-recent-trends-in-gpu-price-per-flops/#easy-footnote-bottom-62-2316 \"See the sheet marked ‘Passmark HP FMA minimums’ in this spreadsheet. The trendline calculated is technically the linear fit through the log of the data.\") with a bootstrap[63](https://aiimpacts.org/2019-recent-trends-in-gpu-price-per-flops/#easy-footnote-bottom-63-2316 \"Orloff, Jeremy, and Jonathan Bloom. “Bootstrap Confidence Intervals.” MIT OpenCourseWare, 2014. https://ocw.mit.edu/courses/mathematics/18-05-introduction-to-probability-and-statistics-spring-2014/readings/MIT18_05S14_Reading24.pdf.\") 95% confidence interval 4 to 5.2 years.[64](https://aiimpacts.org/2019-recent-trends-in-gpu-price-per-flops/#easy-footnote-bottom-64-2316 \"We used this script to generate bootstrap confidence intervals for our datasets.\") This is fairly close to the ~4 years / order of magnitude decrease we found when looking at release price data, but we think active prices are a more accurate estimate of the actual prices at which people bought GPUs.\n\n\nThe figures above suggest that certain GPUs with Tensor Cores were a significant (~half an order of magnitude) improvement over existing GPU price / half-precision FMA FLOPS.\n\n\nConclusion\n==========\n\n\nWe summarize our results in the table below.\n\n\n\n\n| | | | |\n| --- | --- | --- | --- |\n| | **Release Prices** | **95th-percentile Active Prices** | **95th-percentile Active Prices** **(pre-crypto price rise)** |\n| | *11/2007 – 1/2020* | *3/2011 – 1/2020* | *3/2011 – 12/2016* |\n| **$ / single-precision FLOPS** | 12.5 | 17 | 16 |\n| | *9/2014 – 1/2020* | *1/2015 – 1/2020* | *1/2015 – 12/2016* |\n| **$ / half-precision FLOPS** | 8 | 10 | 8 |\n| **$ / half-precision FMA FLOPS** | 4 | 4.5 | — |\n\n\nRelease price data seems to generally support the trends we found in active prices, with the notable exception of trends in GPU price / single-precision FLOPS, which cannot be explained solely by the different start dates.[65](https://aiimpacts.org/2019-recent-trends-in-gpu-price-per-flops/#easy-footnote-bottom-65-2316 \"See our analysis in this section above.\") We think the best estimate of the overall trend for prices at which people recently bought GPUs is the 95th-percentile active price data from 2011 – 2020, since release price data does not account for existing GPUs becoming cheaper over time. The pre-crypto trends are similar to the overall trends, suggesting that the trends we are seeing are not anomalous due to cryptocurrency. \n\n\n\nGiven that, we guess that GPU prices as a whole have fallen at rates that would yield an order of magnitude over roughly:\n\n\n* 17 years for single-precision FLOPS\n* 10 years for half-precision FLOPS\n* 5 years for half-precision fused multiply-add FLOPS\n\n\nHalf-precision FLOPS seem to have become cheaper substantially faster than single-precision in recent years. This may be a “catching up” effect as more of the space on GPUs was allocated to half-precision computing, rather than reflecting more fundamental technological progress.\n\n\n*Primary author: Asya Bergal*\n\n\nNotes\n=====\n\n\n\n\n\n\n\n\n\n\n\n\n\n\n\n\n\n\n\n\n\n\n\n\n\n\n\n\n\n\n\n\n\n\n\n", "url": "https://aiimpacts.org/2019-recent-trends-in-gpu-price-per-flops/", "title": "2019 recent trends in GPU price per FLOPS", "source": "aiimpacts.org", "source_type": "wordpress", "date_published": "2020-03-25T23:46:49+00:00", "paged_url": "https://aiimpacts.org/feed?paged=8", "authors": ["Asya Bergal"], "id": "adf9e0fde3c60bf563f9e4e1c6002c7a", "summary": ["This post analyzes the the trends in cost per FLOP for GPUs. There are a bunch of details in how to do this analysis, but they end up finding that this cost goes down by an order of magnitude over 17 years for single-precision FLOPS (halving time: 5 years), 10 years for half-precision FLOPS (halving time: 3 years), and 5 years for half-precision fused multiply-add FLOPS (halving time: 1.5 years). However, the latter two categories have become more popular in recent years with the rise of deep learning, so their low halving times might be because some of the single-precision hardware was converted to half-precision hardware, rather than fundamental technological improvements."]}
{"text": "Cortés, Pizarro, and Afonso as precedents for takeover\n\n*Daniel Kokotajlo, 29 February 2020*\n\n\n*Epistemic status: I am not a historian, nor have I investigated these case studies in detail. I admit I am still uncertain about how the conquistadors were able to colonize so much of the world so quickly. I think my ignorance is excusable because this is just a blog post; I welcome corrections from people who know more. If it generates sufficient interest I might do a deeper investigation. Even if I’m right, this is just one set of historical case-studies; it doesn’t prove anything about AI, even if it is suggestive. Finally, in describing these conquistadors as “successful,” I simply mean that they achieved their goals, not that what they achieved was good.*\n\n\n### **Summary**\n\n\nIn the span of a few years, some minor European explorers (later known as the conquistadors) encountered, conquered, and enslaved several huge regions of the world. That they were able to do this is surprising; their technological advantage was not huge. (This was before the scientific and industrial revolutions.) From these cases, I think we learn that it is occasionally possible for a small force to quickly conquer large parts of the world, despite:\n\n\n1. Having only a minuscule fraction of the world’s resources and power\n2. Having technology + diplomatic and strategic cunning that is better but not *that* much better\n3. Having very little data about the world when the conquest begins\n4. Being disunited\n\n\nWhich all suggests that it isn’t as implausible that a small AI takes over the world in mildly favorable circumstances as is sometimes thought. \n \n *EDIT: In light of good pushback from people (e.g.* [*Lucy.ea8*](https://forum.effectivealtruism.org/posts/MNPrXCsPpwTgygMxc/cortes-pizarro-and-afonso-as-precedents-for-takeover#xZ8h23jc9pmp8Mqhy) *and* [*Matthew Barnett)*](https://www.alignmentforum.org/posts/ivpKSjM4D6FbqF4pZ/cortes-pizarro-and-afonso-as-precedents-for-takeover#kNFNjBJjuzTd3irrR) *about the importance of disease, I think one should probably add a caveat to the above: “In times of chaos & disruption, at least.”* \n*NEW EDIT: After reading three giant history books on the subject, I take back my previous edit. My original claims were correct.*\n\n\n### **Three shocking true stories**\n\n\nI highly recommend you read the wiki pages yourself; otherwise, here are my summaries:\n\n\n#### **Cortés:**[**[wiki]**](https://en.wikipedia.org/wiki/Fall_of_Tenochtitlan)[**[wiki]**](https://en.wikipedia.org/wiki/Spanish_conquest_of_the_Aztec_Empire)\n\n\n* April 1519: Hernán Cortés lands in Yucatan with ~500 men, 13 horses, and a few cannons. He destroys his ships so his men won’t be able to retreat. His goal is to conquer the Aztec empire of several million people.\n* He makes his way towards the imperial capital, Tenochtitlán. Along the way he encounters various local groups, fighting some and allying with some. He is constantly outnumbered but his technology gives him an advantage in fights. His force grows in size, because even though he loses Spaniards he gains local allies who resent Aztec rule.\n* Tenochtitlán is an island fortress (like Venice) with a population of over 200,000, making it one of the largest and richest cities *in the world* at the time. Cortés arrives in the city asking for an audience with the Emperor, who receives him warily.\n* Cortés takes the emperor hostage within his own palace, indirectly ruling Tenochtitlán through him.\n* Cortés learns that the Spanish governor has landed in Mexico with a force twice his size, intent on arresting him. (Cortés’ expedition was illegal!) Cortés leaves 200 men guarding the Emperor, marches to the coast with the rest, surprises and defeats the new Spaniards in battle, and incorporates the survivors into his army.\n* July 1520: Back at the capital, the locals are starting to rebel against his men. Cortés marches back to the capital, uniting his forces just in time to be besieged in the imperial palace. They murder the emperor and fight their way out of the city overnight, taking heavy losses.\n* They shelter in another city (Tlaxcala) that was thinking about rebelling against the Aztecs. Cortés allies with the Tlaxcalans and launches a general uprising against the Aztecs. Not everyone sides with him; many city-states remain loyal to Tenochtitlan. Some try to stay neutral. Some join him at first, and then abandon him later. Smallpox sweeps through the land, killing many on all sides and causing general chaos.\n* May 1521: The final assault on Tenochtitlán. By this point, Cortés has about 1,000 Spanish troops and 80,000 – 200,000 allied native warriors. He had 16 cannons and 13 boats. The Aztecs have 80,000 – 300,000 warriors and 400 boats. Cortés and his allies win.\n* Later, the Spanish would betray their native allies and assert hegemony over the entire region, in violation of the treaties they had signed.\n\n\n#### **Pizarro**[**[wiki]**](https://en.wikipedia.org/wiki/Francisco_Pizarro)[**[wiki]**](https://en.wikipedia.org/wiki/Spanish_conquest_of_Peru)\n\n\n* 1532: Francisco Pizarro arrives in Inca territory with 168 Spanish soldiers. His goal is to conquer the Inca empire, which was much bigger than the Aztec empire.\n* The Inca empire is in the middle of a civil war and a devastating plague.\n* Pizarro makes it to the Emperor right after the Emperor defeats his brother. Pizarro is allowed to approach because he promises that he comes in peace and will be able to provide useful information and gifts.\n* At the meeting, Pizarro ambushes the Emperor, killing his retinue with a volley of gunfire and taking him hostage. The remainder of the Emperor’s forces in the area back away, probably confused and scared by the novel weapons and hesitant to keep fighting for fear of risking the Emperor’s life.\n* Over the next months, Pizarro is able to leverage his control over the Emperor to stay alive and order the Incans around; eventually he murders the Emperor and makes an alliance with local forces (some of the Inca generals) to take over the capital city of Cuzco.\n* The Spanish continue to rule via puppets, primarily Manco Inca, who is their puppet ruler while they crush various rebellions and consolidate their control over the empire. Manco Inca escapes and launches a rebellion of his own, which is partly successful: He utterly wipes out four columns of Spanish reinforcements, but is unable to retake the capital. With the morale and loyalty of his followers dwindling, Manco Inca eventually gives up and retreats, leaving the Spanish still in control.\n* Then the Spanish ended up fighting *each other* for a while, while *also* putting down more local rebellions. After a few decades Spanish dominance of the region is complete. (1572).\n\n\n#### **Afonso**[**[wiki]**](https://en.wikipedia.org/wiki/Afonso_de_Albuquerque)[**[wiki]**](https://en.wikipedia.org/wiki/Capture_of_Malacca_(1511))[**[wiki]**](https://en.wikipedia.org/wiki/Portuguese_conquest_of_Goa)\n\n\n* 1506: Afonso helps the Portuguese king come up with a shockingly ambitious plan. *Eight years* prior, the first Europeans had rounded the coast of Africa and made it to the Indian Ocean. The Indian Ocean contained most of the world’s trade at the time, since it linked up the world’s biggest and wealthiest regions. See [this map of world population (timestamp 3:45)](https://www.youtube.com/watch?v=PUwmA3Q0_OE). Remember, this is prior to the Industrial and Scientific Revolutions; Europe is just coming out of the Middle Ages and does not have an obvious technological advantage over India or China or the Middle East, and has an obvious economic *disadvantage*. And Portugal is a just tiny state on the edge of the Iberian peninsula.\n* The plan is: Not only will we go into the Indian Ocean and participate in the trading there — cutting out all the middlemen who are currently involved in the trade between that region and Europe — we will *conquer strategic ports around the region so that no one else can trade there!*\n* Long story short, Afonso goes on to complete this plan by 1513. (!!!)\n\n\nSome comparisons and contrasts:\n\n\n* Afonso had more European soldiers at his disposal than Cortes or Pizarro, but not many more — usually he had about a thousand or so. He did have more reinforcements and support from home.\n* Like them, he was usually significantly outnumbered in battles. Like them, the empires he warred against were vastly wealthier and more populous than his forces.\n* Like them, Afonso was often able to exploit local conflicts to gain local allies, which were crucial to his success.\n* Unlike them, his goal wasn’t to conquer the empires entirely, just to get and hold strategic ports.\n* Unlike them, he was fighting empires that were technologically advanced; for example, in several battles his enemies had more cannons and gunpowder than he did.\n* That said, it does seem that Portuguese technology was qualitatively better in some respects (ships, armor, and cannons, I’d say.) Not dramatically better, though.\n* While Afonso’s was a naval campaign, he did fight many land battles, usually marine assaults on port cities, or defenses of said cities against counterattacks. So superior European naval technology is not by itself enough to explain his victory, though it certainly was important.\n* Plague and civil war were not involved in Afonso’s success.\n\n\n### **What explains these devastating conquests?**\n\n\n#### **Wrong answer: I cherry-picked my case studies.**\n\n\nHistory is full of incredibly successful conquerors: Alexander the Great, Ghenghis Khan, etc. Perhaps some people are just really good at it, or really lucky, or both.\n\n\nHowever: Three incredibly successful conquerors from the same tiny region and time period, conquering three separate empires? Followed up by dozens of less successful but still very successful conquerors from the same region and time period? Surely this is not a coincidence. Moreover, it’s not like the conquistadors had many failed attempts and a few successes. The Aztec and Inca empires were the two biggest empires in the Americas, and there weren’t any other Indian Oceans for the Portuguese to fail at conquering.\n\n\nFun fact: I had not heard of Afonso before I started writing this post this morning. Following the [Rule of Three](https://en.wikipedia.org/wiki/Rule_of_three_%28writing%29), I needed a third example and I predicted on the basis of Cortes and Pizarro that there would be other, similar stories happening in the world at around that time. That’s how I found Afonso.\n\n\n#### **Right answer: Technology**\n\n\nHowever, I don’t think this is the whole explanation. The technological advantage of the conquistadors was not overwhelming.\n\n\nWhatever technological advantage the conquistadors had over the existing empires, it was the sort of technological advantage that one could acquire *before* the Scientific and Industrial revolutions. Technology didn’t change very fast back then, yet Portugal managed to get a lead over the Ottomans, Egyptians, Mughals, etc. that was sufficient to bring them victory. On paper, the Aztecs and Spanish were pretty similar: Both were medieval, feudal civilizations. I don’t know for sure, but I’d bet there were at least a few techniques and technologies the Aztecs had that the Spanish didn’t. And of course the technological similarities between the Portuguese and their enemies were much stronger; the Ottomans even had access to European mercenaries! Even in cases in which the conquistadors had technology that was completely novel — like steel armor, horses, and gunpowder were to the Aztecs and Incas — it wasn’t god-like. The armored soldiers were still killable; the gunpowder was more effective than arrows but limited in supply, etc.\n\n\n(Contrary to popular legend, neither Cortés nor Pizarro were regarded as gods by the people they conquered. The Incas concluded pretty early on that the Spanish were mere men, and while the idea did float around the Aztecs for a bit the modern historical consensus is that most of them didn’t take it seriously.)\n\n\nAsk yourself: Suppose Cortés had found 500 local warriors, gave them all his equipment, trained them to use it expertly, and left. Would those local men have taken over all of Mexico? I doubt it. And this is despite the fact that they would have had much better local knowledge than Cortés did! Same goes for Pizarro and Afonso. Perhaps if he had found 500 local warriors *led by an exceptional commander* it would work. But the explanation for the conquistador’s success can’t just be that they were all exceptional commanders; that would be positing too much innate talent to occur in one small region of the globe at one time.\n\n\n#### **Right answer: Strategic and diplomatic cunning**\n\n\nThis is my non-expert guess about the missing factor that joins with technology to explain this pattern of conquistador success.\n\n\nThey didn’t just have technology; they had *effective* *strategy* and they had *effective diplomacy*. They made long-term plans that *worked* despite being breathtakingly ambitious. (And their short-term plans were usually pretty effective too, read the stories in detail to see this.) Despite not knowing the local culture or history, these conquistadors made surprisingly savvy diplomatic decisions. They knew when they could get away with breaking their word and when they couldn’t; they knew which outrages the locals would tolerate and which they wouldn’t; they knew how to convince locals to ally with them; they knew how to use words to escape militarily impossible situations… The locals, by contrast, often badly misjudged the conquistadors, e.g. not thinking Pizarro had the will (or the ability?) to kidnap the emperor, and thinking the emperor would be safe as long as they played along.\n\n\nThis raises the question, how did they get that advantage? My answer: they had *experience* with this sort of thing, whereas locals didn’t. Presumably Pizarro learned from Cortés’ experience; his strategy was pretty similar. (See also: [the prior conquest of the Canary Islands by the Spanish](https://en.wikipedia.org/wiki/Conquest_of_the_Canary_Islands)). In Afonso’s case, well, the Portuguese had been sailing around Africa, conquering ports and building forts for more than a hundred years.\n\n\n### **Lessons I think we learn**\n\n\nI think we learn that:\n\n\nIt is occasionally possible for a small force to quickly conquer large parts of the world, despite:\n\n\n1. Having only a minuscule fraction of the world’s resources and power\n2. Having technology + diplomatic and strategic cunning that is better but not *that* much better\n3. Having very little data about the world when the conquest begins\n4. Being disunited\n\n\nWhich all suggests that it isn’t as implausible that a small AI takes over the world in mildly favorable circumstances as is sometimes thought.\n\n\n *EDIT: In light of good pushback from people (e.g.* [*Lucy.ea8*](https://forum.effectivealtruism.org/posts/MNPrXCsPpwTgygMxc/cortes-pizarro-and-afonso-as-precedents-for-takeover#xZ8h23jc9pmp8Mqhy) *and* [*Matthew Barnett)*](https://www.alignmentforum.org/posts/ivpKSjM4D6FbqF4pZ/cortes-pizarro-and-afonso-as-precedents-for-takeover#kNFNjBJjuzTd3irrR) *about the importance of disease, I think one should probably add a caveat to the above: “In times of chaos & disruption, at least.”* \n\n\n#### **Having only a minuscule fraction of the world’s resources and power**\n\n\nIn all three examples, the conquest was more or less completed without support from home; while Spain/Portugal did send reinforcements, it wasn’t even close to the entire nation of Spain/Portugal fighting the war. So these conquests are examples of non-state entities conquering states, so to speak. (That said, their *claim* to represent a large state may have been crucial for Cortes and Pizarro getting audiences and respect initially.) Cortés landed with about a thousandth the troops of Tenochtitlan, which controlled a still larger empire of vassal states. Of course, his troops were better equipped, but on the other hand they were also cut off from resupply, whereas the Aztecs were in their home territory, able to draw on a large civilian population for new recruits and resupply.\n\n\nThe conquests succeeded in large part due to diplomacy. This has implications for AI takeover scenarios; rather than imagining a conflict of humans vs. robots, we could imagine humans vs. humans-with-AI-advisers, with the latter faction winning and somehow by the end of the conflict the AI advisers have managed to become *de facto* rulers, using the humans who obey them to put down rebellions by the humans who don’t.\n\n\n#### **Having technology + diplomatic and strategic skill that is better but not** ***that*** **much better**\n\n\nAs previously mentioned, the conquistadors didn’t enjoy god-like technological superiority. In the case of Afonso the technology was pretty similar. Technology played an important role in their success, but it wasn’t enough on its own. Meanwhile, the conquistadors may have had more diplomatic and strategic cunning (or experience) than the enemies they conquered. But not that much more–they are only human, after all. And their enemies were pretty smart.\n\n\nIn the AI context, we don’t need to imagine god-like technology (e.g. swarms of self-replicating nanobots) to get an AI takeover. It might even be possible without any new physical technologies at all! Just superior software, e.g. piloting software for military drones, targeting software for anti-missile defenses, cyberwarfare capabilities, data analysis for military intelligence, and of course excellent propaganda and persuasion.\n\n\nNor do we need to imagine an AI so savvy and persuasive that it can persuade anyone of anything. We just need to imagine it about as cunning and experienced relative to its enemies as Cortés, Pizarro, and Afonso were relative to theirs. (Presumably no AI would be experienced with world takeover, but perhaps an intelligence advantage would give it the same benefits as an experience advantage.) And if I’m wrong about this explanation for the conquistador’s success–if they had no such advantage in cunning/experience–then the conclusion is even stronger.\n\n\nAdditionally, in a rapidly-changing world that is undergoing [slow takeoff](https://sideways-view.com/2018/02/24/takeoff-speeds/), where there are lesser AIs and AI-created technologies all over the place, most of which are successfully controlled by humans, AI takeover might still happen if one AI is better, but not that much better, than the others.\n\n\n#### **Having very little data about the world when the conquest begins**\n\n\nCortés invaded Mexico knowing very little about it. After all, the Spanish had only realized the Americas existed two decades prior. He heard rumors of a big wealthy empire and he set out to conquer it, knowing little of the technology and tactics he would face. Two years later, he ruled the place.\n\n\nPizarro and Afonzo were in better epistemic positions, but still, they had to learn a lot of important details (like what the local power centers, norms, and conflicts were, and exactly what technology the locals had) on the fly. But they were good at learning these things and making it up as they went along, apparently.\n\n\nWe can expect superhuman AI to be good at learning. Even if it starts off knowing very little about the world — say, it figured out it was in a training environment and hacked its way out, having inferred a few general facts about its creators but not much else — if it is good at learning and reasoning, it might still be pretty dangerous.\n\n\n#### **Being disunited**\n\n\nCortés invaded Mexico in defiance of his superiors and had to defeat the army they sent to arrest him. Pizarro ended up fighting a civil war against his fellow conquistadors in the middle of his conquest of Peru. Afonzo fought Greek mercenaries and some traitor Portuguese, conquered Malacca against the orders of a rival conquistador in the area, and was ultimately demoted due to political maneuvers by rivals back home.\n\n\nThis astonishes me. Somehow these conquests were completed by people who were at the same time busy infighting and backstabbing each other!\n\n\nWhy was it that the conquistadors were able to split the locals into factions, ally with some to defeat the others, and end up on top? Why didn’t it happen the other way around: some ambitious local ruler talks to the conquistadors, exploits their internal divisions, allies with some to defeat the others, and ends up on top?\n\n\nI think the answer is partly the “diplomatic and strategic cunning” mentioned earlier, but mostly other things. (The conquistadors were disunited, but presumably were united in the ways that mattered.) At any rate, I expect AIs to be pretty [good at coordinating too](https://www.alignmentforum.org/posts/gYaKZeBbSL4y2RLP3/strategic-implications-of-ais-ability-to-coordinate-at-low); they should be able to conquer the world just fine even while competing fiercely with each other. For more on this idea, see [this comment](https://www.lesswrong.com/posts/gYaKZeBbSL4y2RLP3/strategic-implications-of-ais-ability-to-coordinate-at-low?commentId=pdXk8xKtHQKAiu8Pf).\n\n\n*By Daniel Kokotajlo*\n\n\n**Acknowledgements**\n--------------------\n\n\n*Thanks to Katja Grace for feedback on a draft. All mistakes are my own, and should be pointed out to me via email at daniel@aiimpacts.org. Edit: Also, when I wrote this post I had forgotten that the basic idea for it probably came from [this comment by JoshuaFox](https://www.lesswrong.com/posts/vkjWGJrFWBnzHtxrw/superintelligence-7-decisive-strategic-advantage#sWjzvXJToQ3KfH7pB).*\n\n\n(Front page image [from the Conquest of México series. Representing the 1521 Fall of Tenochtitlan, in the Spanish conquest of the Aztec Empire](https://en.wikipedia.org/wiki/Fall_of_Tenochtitlan#/media/File:The_Conquest_of_Tenochtitlan.jpg)) \n\n\n", "url": "https://aiimpacts.org/cortes-pizarro-and-afonso-as-precedents-for-ai-takeover/", "title": "Cortés, Pizarro, and Afonso as precedents for takeover", "source": "aiimpacts.org", "source_type": "wordpress", "date_published": "2020-03-01T03:43:04+00:00", "paged_url": "https://aiimpacts.org/feed?paged=8", "authors": ["Daniel Kokotajlo"], "id": "ef8d37dacdf398abb045c3ec75010255", "summary": ["This post lists three historical examples of how small human groups conquered large parts of the world, and shows how they are arguably precedents for AI takeover scenarios. The first two historical examples are the conquests of American civilizations by Hernán Cortés and Francisco Pizarro in the early 16th century. The third example is the Portugese capture of key Indian Ocean trading ports, which happened at roughly the same time as the other conquests. Daniel argues that technological and strategic advantages were the likely causes of these European victories. However, since the European technological advantage was small in this period, we might expect that an AI coalition could similarly take over a large portion of the world, even without a large technological advantage."]}
{"text": "Incomplete case studies of discontinuous progress\n\n*Published 7 Feb 2020*\n\n\nThis is a list of potential cases of discontinuous technological progress that we have investigated partially or not at all.\n\n\nList\n----\n\n\nIn the course of [investigating cases of potentially discontinuous technological progress](http://aiimpacts.org/discontinuous-progress-investigation/), we have collected around fifty suggested instances that we have not investigated fully. This is a list of them and what we know about them.\n\n\n### The Haber Process\n\n\nThis was previously listed as NSD, but that is tentatively revoked while we investigate a complication with the data.\n\n\n##### Previous explanation\n\n\nThe Haber process was [the first energy efficient method](http://en.wikipedia.org/wiki/Haber_process) of producing ammonia, which is key to making fertilizer. The reason to expect that the Haber process might represent discontinuous technological progress is that previous processes were barely affordable, while the Haber process was hugely valuable—it is [credited](http://en.wikipedia.org/wiki/Haber_process#Economic_and_environmental_aspects) with fixing much of the nitrogen now in human bodies—and has been used on an industrial scale since [1913](http://en.wikipedia.org/wiki/Haber_process#History).\n\n\nA likely place to look for discontinuities then is in the energy cost of fixing nitrogen. [Table 4](https://books.google.com/books?id=NDUXBQAAQBAJ&pg=PA74&dq=energy+efficiency+haber+birkeland+frank&hl=en&sa=X&ei=dG61VLm7IonroATIyoCADg&ved=0CC0Q6AEwAA#v=onepage&q=energy%20efficiency%20haber%20birkeland%20frank&f=false) in Grünewald’s Chemistry for the Future suggests that the invention of the Haber reduced the energy expense by around 60% per nitrogen bonded over a method developed eight years earlier. The previous step however appears to have represented at least a 50% improvement over the process of two years earlier (though the figure is hard to read). Later improvements to the Haber process appear to have been comparable. Thus it seems the Haber process was not an unusually large improvement in energy efficiency, but was probably instead the improvement that happened to take the process into the range of affordability.\n\n\nSince it appears that energy was an important expense, and the Haber process was especially notable for being energy efficient, and yet did not represent a particular discontinuity in energy efficiency progress, it seems unlikely that the Haber process involved a discontinuity. Furthermore, it appears that the world moved to using the Haber process over other sources of fertilizer gradually, suggesting there was not a massive price differential, nor any sharp practical change as a result of the adoption of the process. In the 20’s the US [imported](http://pubs.usgs.gov/of/2004/1290/2004-1290.pdf)[](https://docs.google.com/viewer?url=http%3A%2F%2Fpubs.usgs.gov%2Fof%2F2004%2F1290%2F2004-1290.pdf&embedded=true&chrome=false&dov=1 \"View this pdf file\")[](https://docs.google.com/viewer?url=http%3A%2F%2Fpubs.usgs.gov%2Fof%2F2004%2F1290%2F2004-1290.pdf&embedded=true&chrome=false&dov=1 \"View this pdf file\")[](https://docs.google.com/viewer?url=http%3A%2F%2Fpubs.usgs.gov%2Fof%2F2004%2F1290%2F2004-1290.pdf&embedded=true&chrome=false&dov=1 \"View this pdf file\") much nitrogen from Chile. Alternative nitrogen source calcium cyanamide [reached](http://www.acs.org/content/acs/en/education/whatischemistry/landmarks/calciumcarbideacetylene.html) peak production in 1945, thirty years since the Haber process reached industrial scale production.\n\n\nThe amount of synthetic nitrogen fertilizer applied hasn’t abruptly changed since 1860 (see [p24](http://www.slideshare.net/ILRI/ilri-lse-seminardavidson2014)). Neither has the amount of food produced, for [a few](http://gardenearth.blogspot.com/2013/08/chicken-and-fertilizers.html) [foods](http://www.washingtonpost.com/blogs/wonkblog/wp/2012/08/16/a-brief-history-of-u-s-corn-in-one-chart/) at least.\n\n\nIn sum, it seems the Haber process has had a large effect, but it was produced by a moderate change in efficiency, and manifest over a long period.\n\n\n\n### Aluminium\n\n\nIt is sometimes claimed that the discovery of the Hall–Héroult process in the 1880s brought the price of aluminium down precipitously. We found several pieces of quantitative data about this, but they seriously conflict. The most rigorous looking is a report from Patricia Plunkert at the US Geological Survey, from which we get the following data. However note that some of these figures may be off by orders of magnitude, according to other sources.\n\n\nPlunkert [provides a table of historic aluminium prices](http://minerals.usgs.gov/minerals/pubs/commodity/aluminum/050798.pdf), according to which the nominal price fell from $8 per pound to $0.58 per pound sometime between 1887 and 1895 (during most of which time no records are available). This period probably captures the innovation of interest, as the Hall–Héroult process was patented in 1886 according to Plunkert, and the price only dropped by $1 per pound during the preceding fifteen years according to her table. Plunkert also says that the price was held artificially low to encourage consumers in the early 1900s, suggesting the same may have been true earlier, however this seems likely to be a small correction.\n\n\n### The sewing machine\n\n\nEarly sewing machines apparently brought the time to produce clothing down by an order of magnitude (from 14 hours to 75 minutes for a man’s dress shirt by [one estimate](http://en.wikipedia.org/wiki/Sewing_machine#Social_impact)). However [it appears](http://www.sewalot.com/sewing_machine_history.htm) that the technology progressed more slowly, then was taken up by the public later – probably when it became cost-effective, at which time adoptees may have experienced a rapid reduction in sewing time (presumably at some expense). These impressions are from a very casual perusal of the evidence.\n\n\n### Video compression\n\n\nBlogger John McGowan [claims](https://mathblog.com/martin-fowlers-design-stamina-hypothesis-and-video-compression/) that video compression performance was constant at a ratio of around 250 for about seven years prior to 2003, then jumped to around 900.\n\n\n[](http://aiimpacts.org/wp-content/uploads/2020/02/VideoCompression-1.png)Figure 1: video compression performance in the past two decades.\n#### Information storage volume\n\n\nAccording to the Performance Curves Database (PCDB), ‘information storage volume’ for both [handwriting](http://pcdb.santafe.edu/graph.php?curve=201) and [printing](http://pcdb.santafe.edu/graph.php?curve=205) has grown by a factor of three in recent years, after less than doubling in the hundred years previously. It is unclear what exactly is being measured here however.\n\n\n### Undersea cable price\n\n\nThe bandwidth per cable length available for a dollar [apparently](http://pcdb.santafe.edu/graph.php?curve=214) grew by more than 1000 times in around 1880.\n\n\n\n\n### Infrared detector sensitivity\n\n\nWe understand that infrared detector sensitivity is measured in terms of ‘Noise Equivalent Power’ (NEP), or the amount of power (energy per time) that needs to hit the sensor for the sensor’s output to have a signal:noise ratio of one. We investigated progress in infrared detection technology because according to Academic Press (1974), the helium-cooled germanium bolometer represented a four order of magnitude improvement in sensitivity over uncooled detectors.[1](https://aiimpacts.org/incomplete-case-studies-of-discontinuous-progress/#easy-footnote-bottom-1-2267 \"‘Following Johnson’s work at shorter wavelengths, photometric systems were established at the University of Arizona for each of the infrared windows from 1 to 25μm. At 5, 10, and 22μm, the helium-cooled germanium bolometer was used. This detector provided four orders of magnitude improvement in sensitivity over uncooled detectors and was utilized at wavelengths out to 1000μm.’ – Academic press, 1974\") However our own investigation suggests there were other innovations between uncooled detectors and the bolometer in question, and thus no abrupt improvement.\n\n\nWe list advances we know of [here](https://docs.google.com/spreadsheets/d/1EDmWBL2yk-aYZjNUoKDUG2wZwN6qKdNPOdKors-vShI/edit?usp=sharing), and summarize them in Figure 5. The 1947 point is uncooled. The 1969 point is nearly four orders of magnitude better. However we know of at least four other detectors with intermediate levels of sensitivity, and these are spread fairly evenly between the uncooled device and the most efficient cooled one listed.\n\n\nWe have not checked whether the progress between the uncooled detector and the first cooled detector was discontinuous, given previous rates. This is because we have no strong reason to suspect it is.\n\n\n[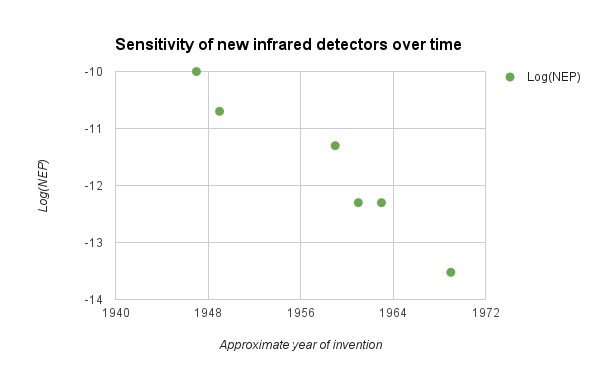](http://aiimpacts.org/wp-content/uploads/2015/02/image-11.png)Figure 2: Sensitivity of infrared detectors during the transition to liquid-helium-cooled devices.\n### Genome sequencing – IIP\n\n\nThis appears to have seen at least a moderate discontinuity. An investigation is in progress.\n\n\nIt was suggested to us in particular that Next Generation Sequencing produced discontinuous progress in output per instrument run for DNA sequencing.\n\n\n\n### Aircraft shot down per shell fired\n\n\n\n\nWe’ve seen it claimed that the [proximity fuse](https://en.wikipedia.org/wiki/Proximity_fuze) increased this metric by 2x or more. We don’t know what the trend was beforehand, however.\n\n\n\n\n### Time to produce clothing\n\n\n\n\nThe Sewing machine was proposed as discontinuous in this metric. We have not investigated.\n\n\n\n\n### Sensitivity of infrared detectors\n\n\n\n\nCryogenically cooled semiconductor sensors were proposed as discontinuous in this metric. We have not investigated.\n\n\n\n\nFrames per Second\n-----------------\n\n\n\n\nIt was suggested that something in high sensitivity, high precision metrology, e.g. trillion frame-per-second camera from MIT, would be discontinuous in this metric. We have not investigated.\n\n\n\n\nAccess to Information\n---------------------\n\n\n\n\nSmart phones were suggested as a discontinuity in this metric. We have not investigated.\n\n\n\n\nSpread of minimally invasive surgery\n------------------------------------\n\n\n\n\nLaparoscopic cholecystectomy was suggested as a discontinuity in this metric. We have not investigated.\n\n\n\n\nMax. submerged endurance, submerged runs\n----------------------------------------\n\n\n\n\nNuclear-powered submarines may be a discontinuity in this metric. We have not investigated.\n\n\n\n\nClothmaking efficiency\n----------------------\n\n\n\n\nThe Jacquard Loom and the Spinning Jenny were suggested as discontinuities in this metric. We have not investigated.\n\n\n\n\nPersonal armor protectiveness-to-weight ratio\n---------------------------------------------\n\n\n\n\nKevlar was suggested as discontinuities in this metric. We have not investigated.\n\n\n\n\nLumens per watt\n---------------\n\n\n\n\nHigh pressure sodium lamps were suggested as discontinuities in this metric. We have not investigated.\n\n\n\n\nLinear programming\n------------------\n\n\n\n\nThe Simplex algorithm was suggested as discontinuities in this metric. We have not investigated.\n\n\n\n\nFourier transform speed\n-----------------------\n\n\n\n\nFast fourier transform was suggested as discontinuities in this metric. We have not investigated.\n\n\n\n\nPolynomial identity testing efficiency\n--------------------------------------\n\n\n\n\nProbabilistic testing methods were suggested as discontinuities in this metric. We have not investigated.\n\n\n\n\nAudio compression efficiency\n----------------------------\n\n\n\n\nThe MP3 format was suggested as discontinuities in this metric. We have not investigated.\n\n\n\n\nCrop yields\n-----------\n\n\n\n\n[This amazing genetic modification](https://www.igb.illinois.edu/article/scientists-engineer-shortcut-photosynthetic-glitch-boost-crop-growth-40), if it works as claimed, may well be a discontinuity in this metric. We have not investigated.\n\n\n*Thanks to Stephen Jordan, Bren Worth, Finan Adamson and others for suggesting potential discontinuities in this list.*\n\n\n", "url": "https://aiimpacts.org/incomplete-case-studies-of-discontinuous-progress/", "title": "Incomplete case studies of discontinuous progress", "source": "aiimpacts.org", "source_type": "wordpress", "date_published": "2020-02-08T04:37:48+00:00", "paged_url": "https://aiimpacts.org/feed?paged=8", "authors": ["Katja Grace"], "id": "75e7da7830bcd45d3a20d005b13e0466", "summary": []}
{"text": "Effect of AlexNet on historic trends in image recognition\n\nAlexNet did not represent a greater than 10-year discontinuity in fraction of images labeled incorrectly, or log or inverse of this error rate, relative to progress in the past two years of competition data.\n\n\nDetails\n-------\n\n\nThis case study is part of AI Impacts’ [discontinuous progress investigation](https://aiimpacts.org/discontinuous-progress-investigation/).\n\n\n### Background\n\n\nThe annual ImageNet competition asks researchers to build programs to label images.[1](https://aiimpacts.org/effect-of-alexnet-on-historic-trends-in-image-recognition/#easy-footnote-bottom-1-1382 \"“Since 2010, the ImageNet project runs an annual software contest, the ImageNet Large Scale Visual Recognition Challenge (ILSVRC), where software programs compete to correctly classify and detect objects and scenes.” – “Imagenet”. 2019. En.Wikipedia.Org. Accessed June 20 2019. https://en.wikipedia.org/w/index.php?title=ImageNet&oldid=900080629.\") It began in 2010, when every team labeled at least 25% of images wrong. The same was true in 2011, and would have been true in 2012, if not for AlexNet, a [convolutional neural network](https://en.wikipedia.org/wiki/Convolutional_neural_network) that mislabeled only 16.4% of images.[2](https://aiimpacts.org/effect-of-alexnet-on-historic-trends-in-image-recognition/#easy-footnote-bottom-2-1382 \"See our data section for sources for this data.\")\n### Trends\n\n\n#### Percent of images mislabeled\n\n\n##### Data\n\n\nWe collected data on the error rate (%) of the 2010 – 2012 ImageNet competitors from Table 6 of Russakovsky et al[3](https://aiimpacts.org/effect-of-alexnet-on-historic-trends-in-image-recognition/#easy-footnote-bottom-3-1382 \"Olga Russakovsky et al., “ImageNet Large Scale Visual Recognition Challenge,” International Journal of Computer Vision 115, no. 3 (December 1, 2015): 211–52, https://doi.org/10.1007/s11263-015-0816-y.\") into [this spreadsheet](https://docs.google.com/spreadsheets/d/1HYdv4gLdtwkzYKeXaBJTXBbqeX_9onmw4aAaYVWVUfs/edit?usp=sharing). See Figure 1 below.\n\n\n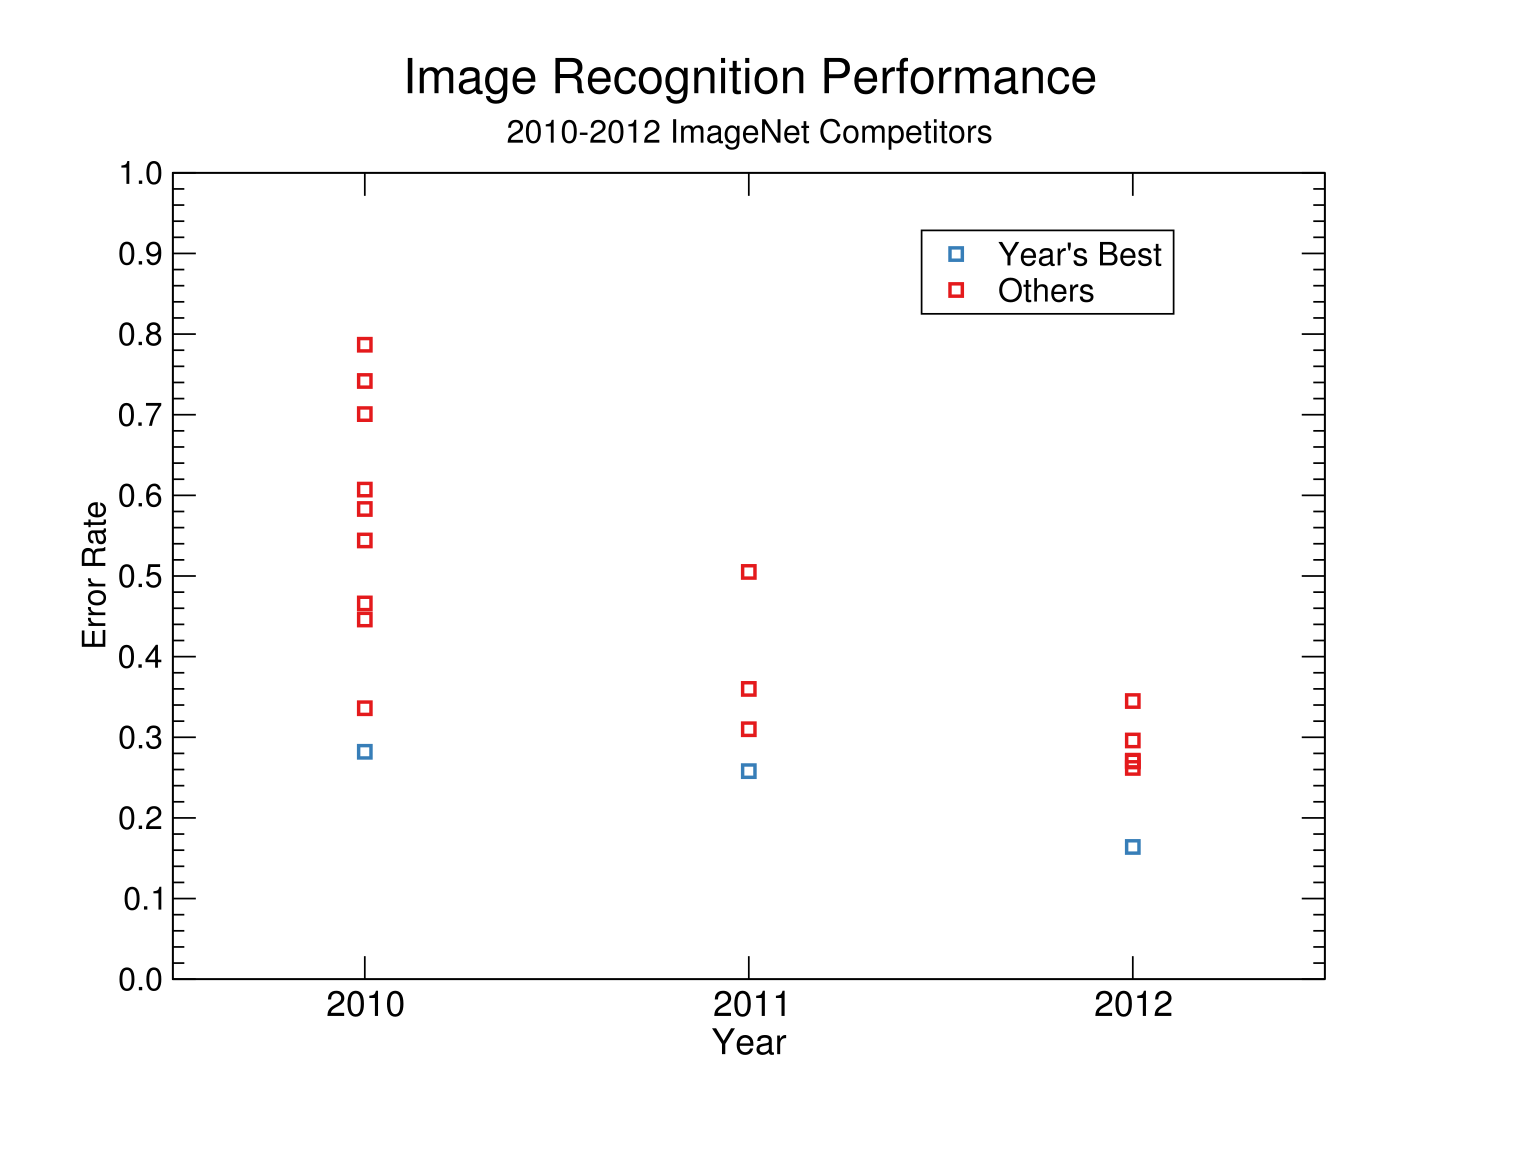Figure 1: Error rate (%) of ImageNet competitors from 2010 – 2012\n##### Discontinuity measurement\n\n\nThe ImageNet competition had only been going for two years when AlexNet entered, so the past trend is very short. Given this, the shape of the curve prior to AlexNet is entirely ambiguous. We treat the trend as linear for simplicity, but given that, it is better to choose a transformation of the data that we expect to be linear, given our understanding of the situation.\n\n\nTwo plausible transformations are the log of the error, and the reciprocal of the error rate.[4](https://aiimpacts.org/effect-of-alexnet-on-historic-trends-in-image-recognition/#easy-footnote-bottom-4-1382 \"Percentage of answers incorrect seems unlikely to change linearly over time, since we expect moving from 50% incorrect to 49% incorrect to be easier than halving a 2% error rate. Log of the error rate and inverse of the error rate seem to us more plausible.\") These two transformations of the data are shown in Figures 2 and 3 below.\n\n\n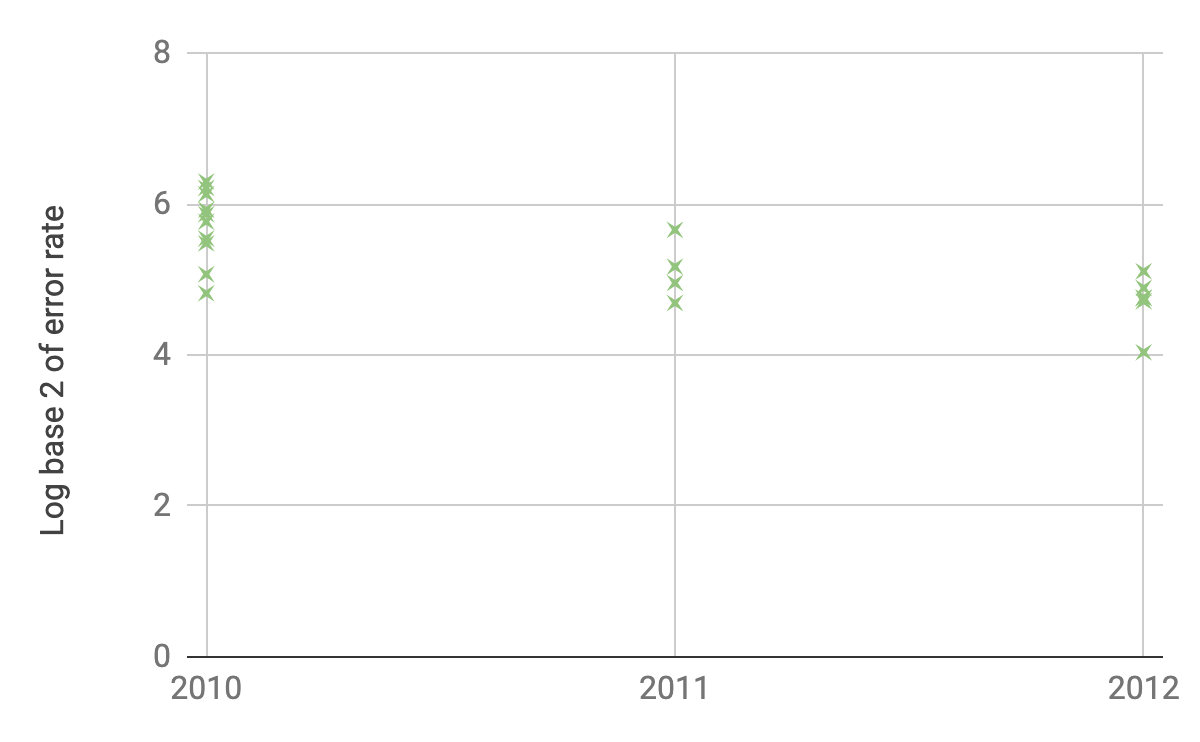Figure 2: Log base 2 / error rate of ImageNet competitors from 2010 – 2012 \n\nFigure 3: 1 / error rate of ImageNet competitors from 2010 – 2012\nThe best 2012 AlexNet competitor gives us discontinuous jumps of 3 years of progress at previous rates for the raw error rate, 4 years of progress at previous rates for log base 2 of the error rate, or 6 years of progress at previous rates for 1 / the error rate.[5](https://aiimpacts.org/effect-of-alexnet-on-historic-trends-in-image-recognition/#easy-footnote-bottom-5-1382 \"See our methodology page for more details our spreadsheet for calculation.\") For the 6-year discontinuity, we tabulated a number of other potentially relevant metrics in the ‘Notable discontinuities under 10 years’ tab **[here](https://docs.google.com/spreadsheets/d/1iMIZ57Ka9-ZYednnGeonC-NqwGC7dKiHN9S-TAxfVdQ/edit?usp=sharing)**.\n\n\n**Notes**\n---------\n\n\n\n\n", "url": "https://aiimpacts.org/effect-of-alexnet-on-historic-trends-in-image-recognition/", "title": "Effect of AlexNet on historic trends in image recognition", "source": "aiimpacts.org", "source_type": "wordpress", "date_published": "2020-02-08T02:40:36+00:00", "paged_url": "https://aiimpacts.org/feed?paged=8", "authors": ["Katja Grace"], "id": "5ed2afe4efa04c5b96e4ef0b4a57aa42", "summary": []}
{"text": "Historic trends in transatlantic message speed\n\nThe speed of delivering a short message across the Atlantic Ocean saw at least three discontinuities of more than ten years before 1929, all of which also were more than one thousand years: a 1465-year discontinuity from Columbus’ second voyage in 1493, a 2085-year discontinuity from the first telegraph cable in 1858, and then a 1335-year discontinuity from the second telegraph cable in 1866. \n\n\n\nDetails\n-------\n\n\nThis case study is part of AI Impacts’ [discontinuous progress investigation](https://aiimpacts.org/discontinuous-progress-investigation/).\n\n\n### Background\n\n\n#### **Summary of historic developments**\n\n\nAll communications between Europe and North America were carried on ships until 1858, when the first telegraph messages were transmitted over cable between the UK and US.[1](https://aiimpacts.org/historic-trends-in-transatlantic-message-speed/#easy-footnote-bottom-1-1869 \"” Exactly 150 years ago, August 1858, the world witnessed a historic event in the history of telecommunications: the successful transmission of telegraph messages across the Atlantic Ocean. Although the transatlantic cable carrying these messages failed after a few weeks of operation, and it wasn’t until 1866 that permanent transatlantic telegraph cable transmission became possible, the 1858 transmissions were heralded worldwide as a major achievement, introducing a new Age of Information. ” Schwartz, Mischa. “History of Communications.” IEEE Communications Magazine, vol. 46, no. 8, 2008, pp. 26–29., doi:10.1109/mcom.2008.4597099. \") That first cable only lasted six weeks, and took more than sixteen hours to send a message from the Queen.[2](https://aiimpacts.org/historic-trends-in-transatlantic-message-speed/#easy-footnote-bottom-2-1869 \"“The celebrations hit a sour note as the fireworks set fire to City Hall. Far worse news was to come, as the cable itself failed completely after six weeks. The cable never really worked well; the Queen’s message had taken 16-1/2 hours to transmit.” Schwartz, Mischa. “History of Communications.” IEEE Communications Magazine, vol. 46, no. 8, 2008, pp. 26–29., doi:10.1109/mcom.2008.4597099. \")\nA permanent cable wasn’t laid until eight years later.[3](https://aiimpacts.org/historic-trends-in-transatlantic-message-speed/#easy-footnote-bottom-3-1869 \"“…and it wasn’t until 1866 that permanent transatlantic telegraph cable transmission became possible”
Schwartz, Mischa. “History of Communications.” IEEE Communications Magazine, vol. 46, no. 8, 2008, pp. 26–29., doi:10.1109/mcom.2008.4597099. \") Better telegraph cables were laid a further thirty and sixty years later. We do not investigate developments after 1929.\n\n\nFigure 1: Undersea communications cables became common in the long run: map of undersea communications cables in 2007.[4](https://aiimpacts.org/historic-trends-in-transatlantic-message-speed/#easy-footnote-bottom-4-1869 \"From Wikimedia Commons:
Rarelibra [Public domain] \")\n### **Trends**\n\n\n#### Transatlantic message speed, 140 character message\n\n\nWe looked at historic times to send messages across the Atlantic Ocean.\n\n\nMessage speed can depend on the length of the message. Where this was relevant, we somewhat arbitrarily chose to investigate for a 140 character message. We measure fastest speeds of real historic systems that could send 140 character messages across the Atlantic Ocean. We do not require that a 140 character message was actually sent by the method in question. \n\n\nWe generally use whatever route was actually taken (or supposed in an estimate), and do not attempt to infer faster speeds possible had an optimal route been taken (though note that because we are measuring speed rather than time to cross the Ocean, route length is adjusted for to a first approximation).\n\n\nWe only investigated this metric from 1492-1493 and 1841-1928. We do not investigate 1493-1841 because our data is insufficiently complete to determine how continuous it was.[5](https://aiimpacts.org/historic-trends-in-transatlantic-message-speed/#easy-footnote-bottom-5-1869 \"See historic trends in transatlantic passenger travel for discussion of this.\")\n##### Data\n\n\nOur data for message speed came from a variety of online sources, and has not been thoroughly vetted. The full dataset with sources can be found [here.](https://docs.google.com/spreadsheets/d/11WV8JUIZeVNWKfggCmHaCEJrtG_YMiOdq18zjfwFUVk/edit#gid=1115870502)[6](https://aiimpacts.org/historic-trends-in-transatlantic-message-speed/#easy-footnote-bottom-6-1869 \"The ‘Message’ tab contains data for the speed in knots of different modes of transport for carrying messages, along with the source for each data point.\")\nBecause message delivery coincided with passenger travel until the first telegraph, data until then coincides with that used in our investigation into [historic trends in transatlantic passenger travel](https://aiimpacts.org/historic-trends-in-transatlantic-passenger-travel/). \n\n\nThe resulting trend is shown in Figures 2-3.\n\n\n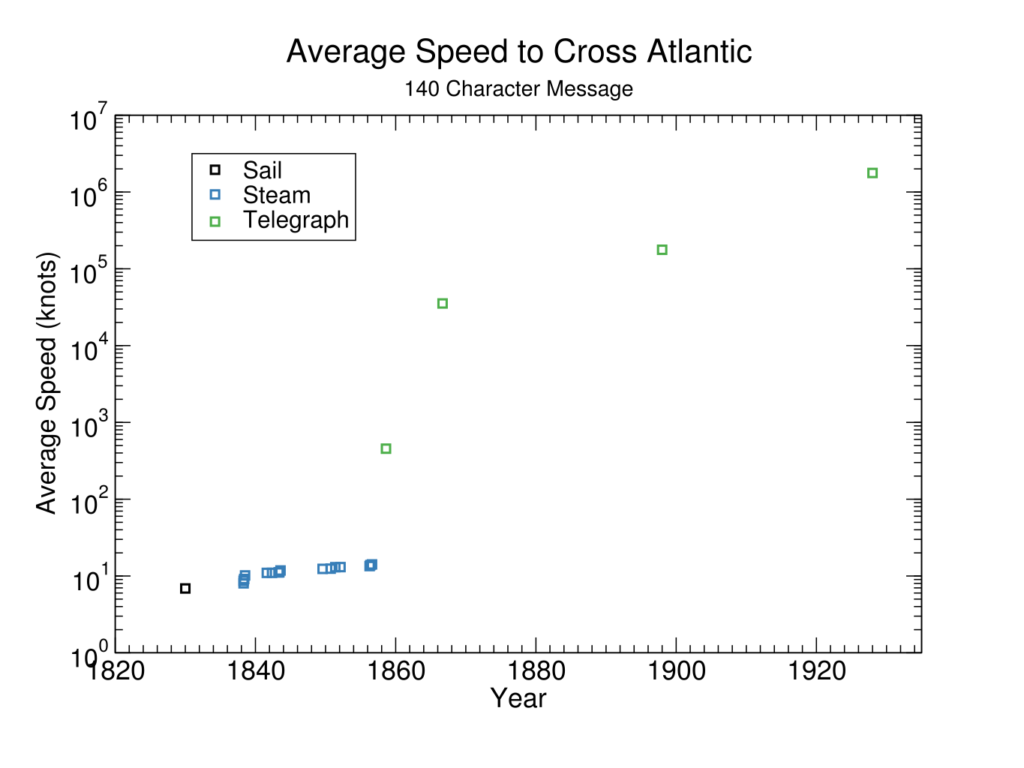 Figure 2: Average speed for message transmission across the Atlantic in recent centuries (see Figure 3 for longer term trend) \n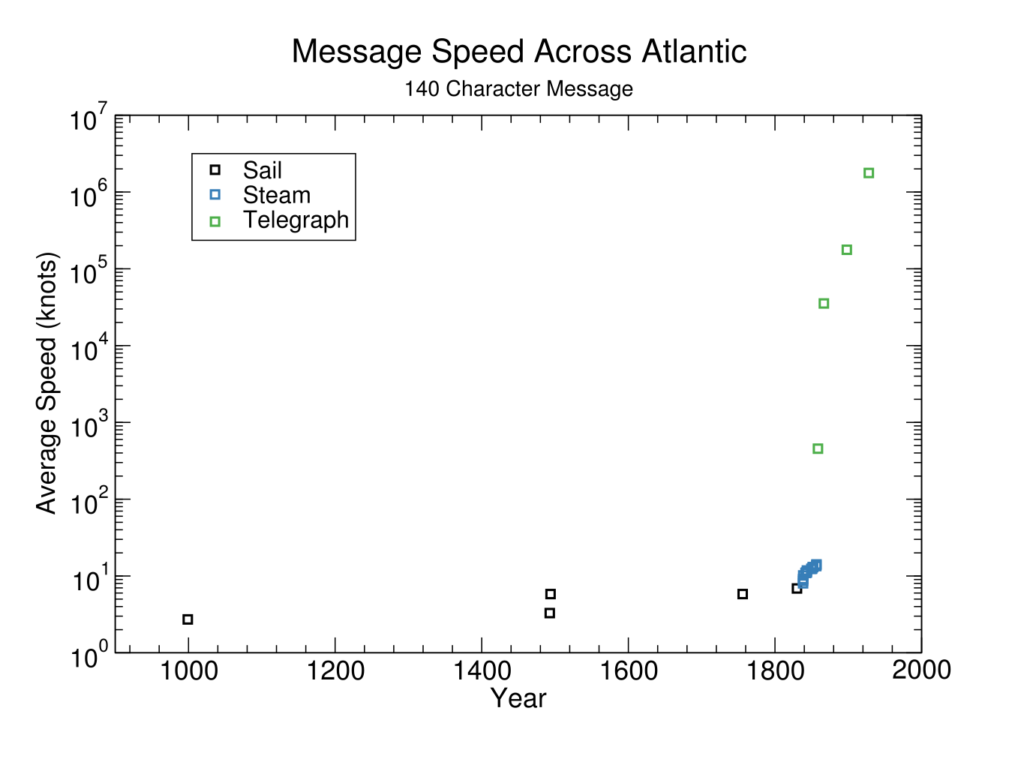 Figure 3: Average speed for message transmission across the Atlantic. \n##### Discontinuity Measurement\n\n\nWe measure discontinuities by comparing progress made at a particular time to the past trend. For this purpose, we treat the past trend at any given point as exponential or linear depending on apparent fit, and judge a new trend to have begun when the recent trend has diverged sufficiently from the longer term trend. See [our spreadsheet](https://docs.google.com/spreadsheets/d/11WV8JUIZeVNWKfggCmHaCEJrtG_YMiOdq18zjfwFUVk/edit?usp=sharing), tab ‘Message’ to view the trends, and [our methodology page](https://aiimpacts.org/methodology-for-discontinuity-investigation/#time-period-selection) for details on how to interpret our sheets and how we divide data into trends. \n\n\nGiven these judgments about past progress, there were three discontinuities of more than ten years, all of which were more than one thousand years: a 1465-year discontinuity from Columbus’ second voyage in 1493, then a 2085-year discontinuity from the first telegraph cable in 1858, and then a 1335-year discontinuity from the improved telegraph cable in 1866.[7](https://aiimpacts.org/historic-trends-in-transatlantic-message-speed/#easy-footnote-bottom-7-1869 \"See our methodology page for more details, and our spreadsheet, tab ‘Message’ for our calculation.\") In addition to the size of these discontinuity in years, we have tabulated a number of other potentially relevant metrics [here](https://docs.google.com/spreadsheets/d/1iMIZ57Ka9-ZYednnGeonC-NqwGC7dKiHN9S-TAxfVdQ/edit?usp=sharing).[8](https://aiimpacts.org/historic-trends-in-transatlantic-message-speed/#easy-footnote-bottom-8-1869 \"See our methodology page for more details.\").\n\n\n##### Discussion of causes\n\n\n Transatlantic message speed is a narrower metric than overall message speed, precluding some technologies that can only deliver messages short distances or on land (e.g. the [semaphore telegraph](https://en.wikipedia.org/wiki/Telegraphy#Early_signalling), which relied on a series of towers within line of sight). We expected this would make discontinuity more likely.\n\n\nNotes\n-----\n\n\n \n\n\n\n\n\n\n\n\n", "url": "https://aiimpacts.org/historic-trends-in-transatlantic-message-speed/", "title": "Historic trends in transatlantic message speed", "source": "aiimpacts.org", "source_type": "wordpress", "date_published": "2020-02-08T02:39:47+00:00", "paged_url": "https://aiimpacts.org/feed?paged=8", "authors": ["Katja Grace"], "id": "1c2b3bb676b83dd758d2194678b20626", "summary": []}
{"text": "Historic trends in long-range military payload delivery\n\nThe speed at which a military payload could cross the Atlantic ocean contained six greater than 10-year discontinuities in 1493 and between 1841 and 1957: \n\n\n\n\n| | | | |\n| --- | --- | --- | --- |\n| **Date** | **Mode of transport** | **Knots** | **Discontinuity size(years of progress at past rate)** |\n| 1493 | Columbus’ second voyage | 5.8 | 1465 |\n| 1884 | Oregon | 18.6 | 10 |\n| 1919 | WWI Bomber (first non-stop transatlantic flight) | 106 | 351 |\n| 1938 | Focke-Wulf Fw 200 Condor | 174 | 19 |\n| 1945 | Lockheed Constellation | 288 | 25 |\n| 1957 | R-7 (ICBM) | ~10,000 | ~500 |\n\n\nDetails\n-------\n\n\n### Background\n\n\nThe speed at which a weapons payload could be delivered to a target on the opposite side of the ocean appears to have been limited to the speed of a piloted vehicle (and so coincided with speed of passenger delivery) until the first long-range missiles became available in the late 1950s.[1](https://aiimpacts.org/historic-trends-in-long-range-military-payload-delivery/#easy-footnote-bottom-1-1870 \"If there was a pilotless way to quickly cross the Atlantic prior to ICBMs we have not been able to find it.\"). \n\n\n### Trends\n\n\nThis case study is part of AI Impacts’ [discontinuous progress investigation](https://aiimpacts.org/discontinuous-progress-investigation/).\n\n\n#### Transatlantic military payload delivery speed\n\n\nWe look at fastest speeds of real historic systems that could have delivered military payloads across the Atlantic Ocean. We do not require that any military payload was actually sent by the method in question. \n\n\nWe generally use whatever route was actually taken (or supposed in an estimate), and do not attempt to infer faster speeds possible had an optimal route been taken (though note that because we are measuring speed rather than time to cross the Ocean, route length is adjusted for to a first approximation). \n\n\nWe only investigated this metric from 1492-1493 and 1841-1957. We do not investigate 1493-1841 because our data is insufficiently complete to determine how continuous it was.[2](https://aiimpacts.org/historic-trends-in-long-range-military-payload-delivery/#easy-footnote-bottom-2-1870 \"See historic trends in transatlantic passenger travel for discussion of this.\")\n##### Data\n\n\nWe collated records of historic potential times to cross the Atlantic Ocean for military payloads. These are available at the ‘Payload’ tab of [this spreadsheet](https://docs.google.com/spreadsheets/d/11WV8JUIZeVNWKfggCmHaCEJrtG_YMiOdq18zjfwFUVk/edit?usp=sharing), and are displayed in Figure 1 and 2 below. We have not thoroughly verified this data. \n\n\nBecause military payload delivery coincided with passenger travel until the late 1950s, most of our data coincides with that used in our investigation into [historic trends in transatlantic passenger travel](https://aiimpacts.org/historic-trends-in-transatlantic-passenger-travel/). \n\n\nThe advent of ICBMs in 1957 probably increased the crossing speed to thousands of knots. We are fairly uncertain about how fast the first ICBMs were, but our impression is that they traveled at an average of least 5,000 knots and likely more like 10,000 knots.[3](https://aiimpacts.org/historic-trends-in-long-range-military-payload-delivery/#easy-footnote-bottom-3-1870 \"Some evidence:
- The first ICBM to successfully travel an intercontinental distance, R-7, was initially planned to travel at 13,000 knots.
- Our impression is that a typical ICBM flight trajectory is mostly free-fall and that most missiles were launched on trajectories that are optimally fuel efficient, which means ballistic missiles should have similar average flight times over similar distances. Later ICBMs seem to generally travel at speeds of at least 10,000 knots (though we are unsure whether this is horizontal motion or also includes vertical motion).
“The solid-fuelled propulsion system ensures the missile to cruise at a speed of 15,000mph (24,140km/h).”
\n\n\n\nArmy Technology. “Longest Range Intercontinental Ballistic Missiles (ICBM): The Top 10 Ranked,” November 3, 2013. https://www.army-technology.com/features/feature-the-10-longest-range-intercontinental-ballistic-missiles-icbm/.
\n\n\n\n\") so will not yield clear discontinuities, and we do not know of faster missiles than ICBMs.[6](https://aiimpacts.org/historic-trends-in-long-range-military-payload-delivery/#easy-footnote-bottom-6-1870 \"Cruise missiles are much slower. For instance, BrahMos is purportedly the fastest supersonic cruise missile, and can travel at mach 2.8 or 1867 knots.“It can gain a speed of Mach 2.8…” \n\n\n\n
“BrahMos.” In Wikipedia, November 27, 2019. https://en.wikipedia.org/w/index.php?title=BrahMos&oldid=928133032. \") \n\n\n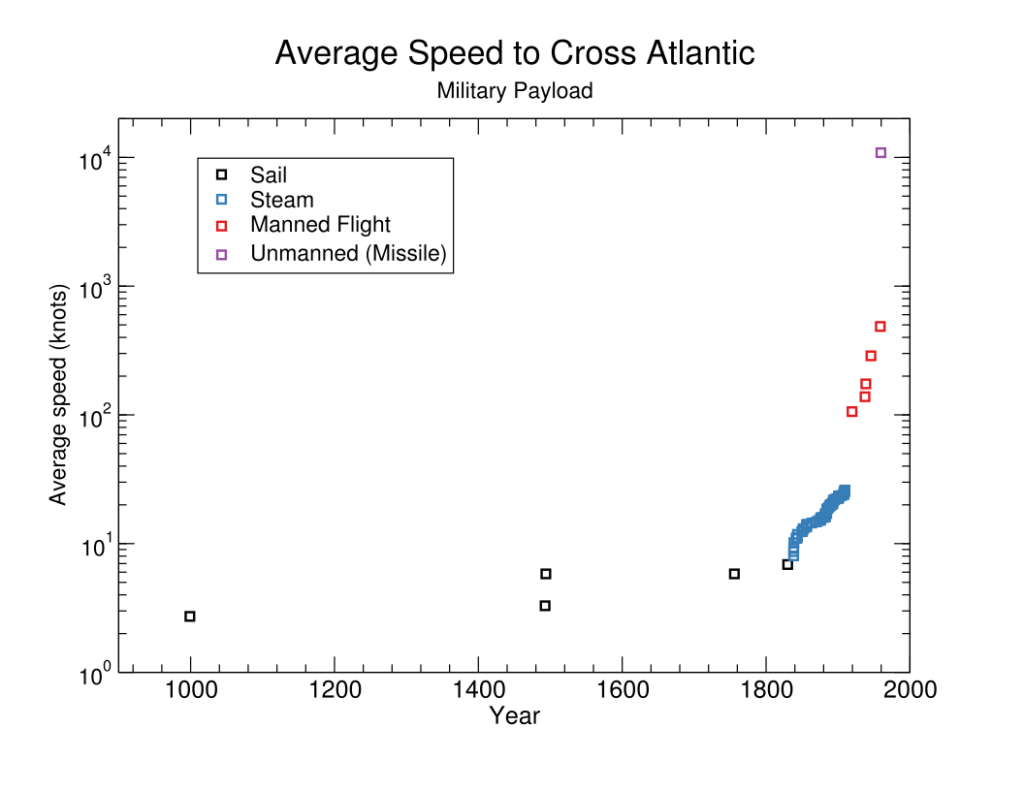 Figure 1: Historic speeds of sending hypothetical military payloads across the Atlantic Ocean \n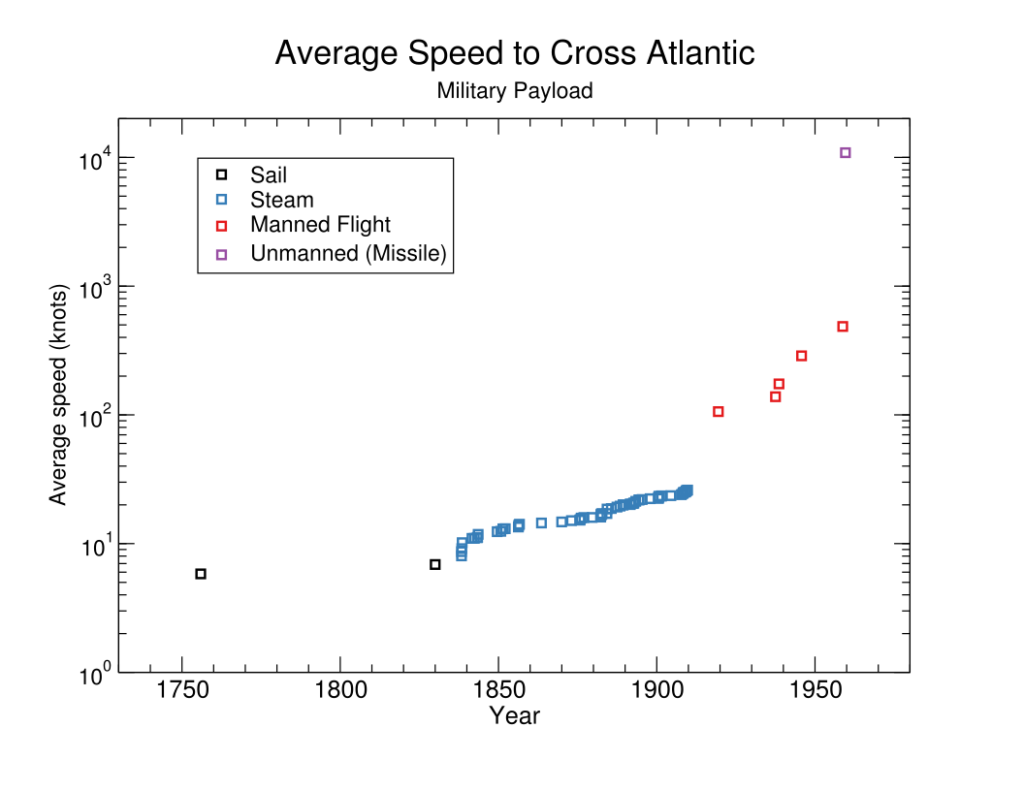 Figure 2: Historic speeds of sending hypothetical military payloads across the Atlantic Ocean since 1700 (close up of Figure 1) \n##### Discontinuity measurement\n\n\nUntil 1957, discontinuities are the same as those for [speed of transatlantic passenger travel](https://aiimpacts.org/historic-trends-in-transatlantic-passenger-travel/), since the data coincides. This gives us five discontinuities.\n\n\nWe calculate the final development, the ICBM, to probably represent a discontinuity of around 500 years, but at least 100[7](https://aiimpacts.org/historic-trends-in-long-range-military-payload-delivery/#easy-footnote-bottom-7-1870 \"See above for why it must be at least 100 years\"). See [this spreadsheet](https://docs.google.com/spreadsheets/d/11WV8JUIZeVNWKfggCmHaCEJrtG_YMiOdq18zjfwFUVk/edit?usp=sharing), tab ‘Payload’ for our calculation.[8](https://aiimpacts.org/historic-trends-in-long-range-military-payload-delivery/#easy-footnote-bottom-8-1870 \"See methodology for discontinuity investigation for more details. For instance, for the purpose of evaluating each point relative to past progress, we treat the data as several different linear or exponential trends. The methodology page describes how we decide what to treat as the trend of ‘past progress’ for each point.\") \n\n\nThis gives us six greater than 10-year discontinuities in total, including five shared with transatlantic passenger travel speed. Three of them represent more than one hundred years of past progress:\n\n\n\n\n| | | | |\n| --- | --- | --- | --- |\n| **Date** | **Mode of transport** | **Knots** | **Discontinuity size(years of progress at past rate)** |\n| 1493 | Columbus’ second voyage | 5.8 | 1465 |\n| 1884 | Oregon | 18.6 | 10 |\n| 1919 | WWI Bomber (first non-stop transatlantic flight) | 106 | 351 |\n| 1938 | Focke-Wulf Fw 200 Condor | 174 | 19 |\n| 1945 | Lockheed Constellation | 288 | 25 |\n| 1957 | R-7 (ICBM) | ~10,000 | ~500 |\n\n\nIn addition to the sizes of these discontinuity in years, we have tabulated a number of other potentially relevant metrics [here](https://docs.google.com/spreadsheets/d/1iMIZ57Ka9-ZYednnGeonC-NqwGC7dKiHN9S-TAxfVdQ/edit?usp=sharing).[9](https://aiimpacts.org/historic-trends-in-long-range-military-payload-delivery/#easy-footnote-bottom-9-1870 \"See our methodology page for more details.\")\nNotes\n-----\n\n\n\n\n\n\n\n", "url": "https://aiimpacts.org/historic-trends-in-long-range-military-payload-delivery/", "title": "Historic trends in long-range military payload delivery", "source": "aiimpacts.org", "source_type": "wordpress", "date_published": "2020-02-08T02:39:27+00:00", "paged_url": "https://aiimpacts.org/feed?paged=8", "authors": ["Katja Grace"], "id": "1d702769860837d527f8b7393b945423", "summary": []} {"text": "Historic trends in bridge span length\n\nWe measure eight discontinuities of over ten years in the history of longest bridge spans, four of them of over one hundred years, five of them robust as to slight changes in trend extrapolation. \n\n\nThe annual average increase in bridge span length increased by over a factor of one hundred between the period before 1826 and the period after (0.25 feet/year to 35 feet/year), though there was not a clear turning point in it. \n\n\nDetails\n-------\n\n\nThis case study is part of AI Impacts’ [discontinuous progress investigation](https://aiimpacts.org/discontinuous-progress-investigation/).\n\n\n### Background\n\n\nA bridge [span](https://en.wikipedia.org/wiki/Span_(engineering)) is a section of bridge between supports.[1](https://aiimpacts.org/historic-trends-in-bridge-span-length/#easy-footnote-bottom-1-1393 \"Span is the distance between two intermediate supports for a structure, e.g. a beam or a bridge.
\n\n\n\n“Span (Engineering).” In Wikipedia, November 7, 2017. https://en.wikipedia.org/w/index.php?title=Span_(engineering)&oldid=809190532.\") Bridges can have multiple spans, e.g. one for each arch.[2](https://aiimpacts.org/historic-trends-in-bridge-span-length/#easy-footnote-bottom-2-1393 \"See this quora explanation.\") Bridges are often measured by their ‘main span’. \n\n\nWe investigated bridge span (rather than bridge length, mass, or carrying capacity) because it was suggested to us as discontinuous. We also expect it to be a good metric for seeing technological progress, rather than economic progress, because additional spending can probably add more spans to a structure more easily than it can make each span longer. Span length is also a less ambiguous metric than total length, since it is not always clear where a road ends and a bridge begins.\n\n\nThe Akashi Kaikyō Bridge, current record-holder for longest bridge span[3](https://aiimpacts.org/historic-trends-in-bridge-span-length/#easy-footnote-bottom-3-1393 \"From Wikimedia Commons. The original uploader was Sam at English Wikipedia. [CC BY-SA 3.0 (http://creativecommons.org/licenses/by-sa/3.0/)]\")\n\n### Trends\n\n\n#### Longest bridge span length\n\n\n##### Data\n\n\nWe gathered data for bridge span lengths from several Wikipedia lists of longest bridge spans over history for particular types of bridge, plus a few additional datapoints from elsewhere. Our data and citations are in [this spreadsheet](https://docs.google.com/spreadsheets/d/1yPB8sDbWCXzmJwFbcOX6Al2ADip2P-h5ADC-X9MAoNU/edit?usp=sharing) in the tab ‘five bridge types’. \n\n\nProblems, ambiguities, and limitations of the data and our collection process:\n\n\n* Some span lengths are given as different lengths on different Wikipedia pages. We did not investigate this, and the one we used was arbitrary.\n* We did not find a list of historic longest bridge spans for all bridge types, so used several pages about longest bridges for particular bridge types, for instance [List of Longest Suspension Bridge Spans](https://en.wikipedia.org/wiki/List_of_longest_suspension_bridge_spans). It is quite possible we failed to find all such lists. In the data we have though, suspension bridges are usually longer than anything else, and the Wikipedia [History of Longest Suspension Bridge Spans](https://en.wikipedia.org/wiki/List_of_longest_suspension_bridge_spans#History_of_longest_suspension_spans) mentions in its list a few times when non-suspension bridges are the longest bridge span in the world, suggesting that the authors of that page at least believe that at all other times the suspension bridges are the longest. We had already found the other bridges they mention (all arch or cantilever bridges).\n* We have not investigated the accuracy of the Wikipedia data.\n* We are unsure what exact definition of ‘bridge’ is used in any of these pages. Our impression is that they need to allow foot vehicle traffic to cross independently (e.g. it looks like foot bridges are included, but not [this cable car](https://en.wikipedia.org/wiki/Vall%C3%A9e_Blanche_Cable_Car) with a 2831m span, which it seems would hold the current record were it a bridge). We have not investigated more.\n* We treated dates of N BC dates -N\n\n\nFigure 1-3 show the length of the longest bridge span for five types of bridge over time. If we understand correctly, these include the longest bridges of any kind at least since around 500AD.\n\n\n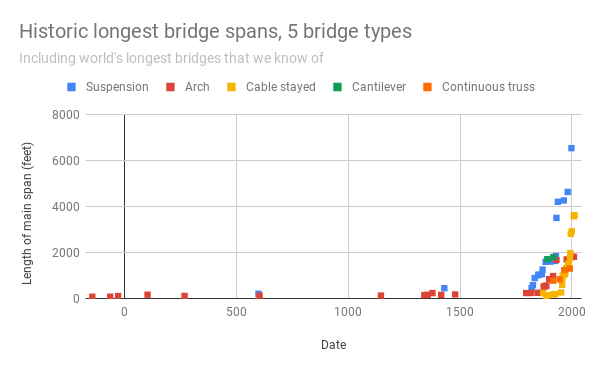Figure 1: Entire history of longest bridge spans of five types, measured in feet. See text for further details.\n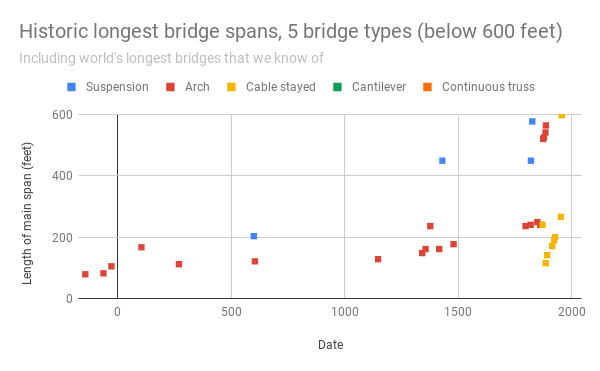Figure 2: Figure 1 only visible to 600 feet.\n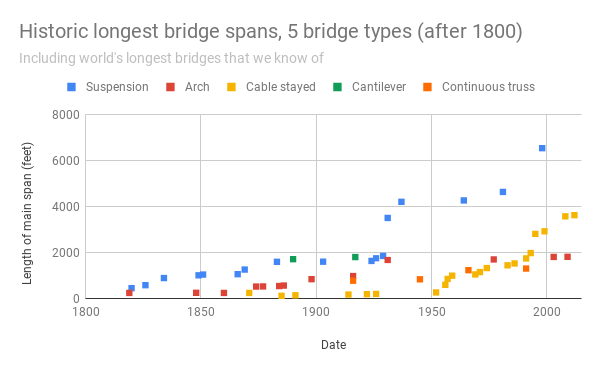Figure 3: Figure 1 since 1800\n##### Discontinuity measurement\n\n\nTo measure discontinuities relative to past progress, we treat past progress as linear, and belonging to five different periods (i.e. three times we consider the recent trend to be sufficiently different from the older trend that we base our extrapolation on a new period).[4](https://aiimpacts.org/historic-trends-in-bridge-span-length/#easy-footnote-bottom-4-1393 \"See our methodology page for details on how we divide the data into trends and how to interpret the spreadsheet.\")\nUsing this method, the length of the longest bridge span has seen a large number of discontinuities (see table below). \n\n\n\n\n| | | | |\n| --- | --- | --- | --- |\n| Name | Year opened/became longest of type | Main span (feet) | Discontinuity |\n| Chakzam Bridge\\* | 1430 | 449 | 2230 |\n| Menai Suspension Bridge | 1826 | 577 | 146 |\n| Great Suspension Bridge\\* | 1834 | 889 | 403 |\n| Wheeling Suspension Bridge | 1849 | 1010 | 70 |\n| Niagara Clifton Bridge\\* | 1869 | 1260 | 14 |\n| George Washington Bridge\\* | 1931 | 3501 | 132 |\n| Golden Gate Bridge | 1937 | 4200 | 19 |\n| Akashi-Kaikyo Bridge\\* | 1998 | 6532 | 56 |\n| \\*Entry was more robust to informal experimentation with different linear extrapolations | | | |\n\n\nDeciding what to treat as the previous trend at any point is hard in this dataset, because the shape of the trend isn’t close to being exponential or linear. The sizes of the discontinuities and even the particular bridges that count as notably discontinuous are not very robust to different choices. In a small amount of experimentation with different linear trends, five bridges were always discontinuities, marked with \\* in the above table. That the overall trend is marked by many discontinuities seems robust.\n\n\n In addition to the size of these discontinuity in years, we have tabulated a number of other potentially relevant metrics [here](https://docs.google.com/spreadsheets/d/1iMIZ57Ka9-ZYednnGeonC-NqwGC7dKiHN9S-TAxfVdQ/edit?usp=sharing).[5](https://aiimpacts.org/historic-trends-in-bridge-span-length/#easy-footnote-bottom-5-1393 \"See our methodology page for more details.\")\n##### Change in rate of progress\n\n\nThe annual average increase in bridge span length increased by over a factor of one hundred between the period before 1826 and the period after (0.25 feet/year to 35 feet/year), though there was not a clear turning point in it. See [spreadsheet](https://docs.google.com/spreadsheets/d/1yPB8sDbWCXzmJwFbcOX6Al2ADip2P-h5ADC-X9MAoNU/edit#gid=1397997396) for calculation (tab: ‘Five bridge types (longest)’)\n\n\nNotes\n-----\n\n\n\n\n\n\n", "url": "https://aiimpacts.org/historic-trends-in-bridge-span-length/", "title": "Historic trends in bridge span length", "source": "aiimpacts.org", "source_type": "wordpress", "date_published": "2020-02-08T02:39:02+00:00", "paged_url": "https://aiimpacts.org/feed?paged=8", "authors": ["Katja Grace"], "id": "55218882f0dc885507ea1a4e060a752c", "summary": []}
{"text": "Historic trends in light intensity\n\nMaximum light intensity of artificial light sources has discontinuously increased once that we know of: argon flashes represented roughly 1000 years of progress at past rates.\n\n\nAnnual growth in light intensity increased from an average of roughly 0.4% per year between 424BC and 1943 to an average of roughly 190% per year between 1943 and the end of our data in 2008.\n\n\nDetails\n-------\n\n\nThis case study is part of AI Impacts’ [discontinuous progress investigation](https://aiimpacts.org/discontinuous-progress-investigation/).\n\n\n### Background\n\n\nThat which is uncited on this page is our understanding, given familiarity with the topic.[1](https://aiimpacts.org/historic-trends-in-light-intensity/#easy-footnote-bottom-1-1330 \"Our primary researcher for this page, Rick Korzekwa, has a PhD in physics, with experience in experimental optical physics.\")\n[Electromagnetic waves](https://en.wikipedia.org/wiki/Electromagnetic_radiation) (also called electromagnetic radiation) are composed of oscillating electric and magnetic fields. They span in wavelength from gamma rays with wavelengths on the order of 10-20 meters to radio waves with wavelengths on the order of kilometers. The wavelengths from roughly 400 to 800 nanometers are visible to the human eye, and usually referred to as light waves, though the entire spectrum is sometimes referred to as light, especially in the context of physics. These waves carry energy and their usefulness and the effect that they have on matter is strongly affected by their intensity, or the amount of energy that they carry to a given area per time. Intensity is often measured in watts per square centimeter (W/cm2), and it can be increased either by increasing the power (energy per time, measured in watts) or focusing the light onto a smaller area.\n\n\nElectromagnetic radiation is given off by all matter as thermal radiation, with the power and wavelength of the waves determined by the temperature and material properties of the matter. When the matter is hot enough to emit visible light, as is the case with the tungsten filament in a light bulb or the sun, the process is referred to as incandescence. Processes which produce light by other means are commonly referred to as luminescence. Common sources of luminescence are LEDs and fireflies.\n\n\nThe total power emitted by a source of incandescent source of light is given by the Stefan-Boltzman Law.[2](https://aiimpacts.org/historic-trends-in-light-intensity/#easy-footnote-bottom-2-1330 \"“Specifically, the Stefan–Boltzmann law states that the total energy radiated per unit surface area of a black body across all wavelengths per unit time j* (also known as the black-body radiant emittance) is directly proportional to the fourth power of the black body’s thermodynamic temperature T…”“Stefan–Boltzmann Law.” In Wikipedia, September 25, 2019. https://en.wikipedia.org/w/index.php?title=Stefan%E2%80%93Boltzmann_law&oldid=917706970.\")\nLight intensity is relevant to applications such as starting fires with lenses, cutting with lasers, plasma physics, spectroscopy, and high-speed photography. \n\n\n#### History of progress\n\n\n##### Focused sunlight and magnesium\n\n\nFor much of history, our only practical sources of light have been the sun and burning various materials. In both cases, the light is incandescent (produced by a substance being hot), so light intensity depends on the temperature of the hot substance. It is difficult to make something as hot as the sun, so difficult to make something as bright as sunlight, even if it is very well focused. We do not know how close the best focused sunlight historically was to the practical limit, but focused sunlight was our most intense source of light for most of human history.\n\n\nThere is evidence that people have been using focused sunlight to start fires for a very long time.[3](https://aiimpacts.org/historic-trends-in-light-intensity/#easy-footnote-bottom-3-1330 \"“The technology of the burning glass has been known since antiquity. Vases filled with water used to start fires were known in the ancient world.” – “Burning Glass.” In Wikipedia, September 15, 2019. https://en.wikipedia.org/w/index.php?title=Burning_glass&oldid=915774651.\") There is further evidence that more advanced lens technology has existed for over 1000 years[4](https://aiimpacts.org/historic-trends-in-light-intensity/#easy-footnote-bottom-4-1330 \"The Visby lenses are a collection of lens-shaped manufactured objects made of rock crystal (quartz) found in several Viking graves on the island of Gotland, Sweden, and dating from the 11th or 12th century…
…The Visby lenses provide evidence that sophisticated lens-making techniques were being used by craftsmen over 1,000 years ago, at a time when researchers had only just begun to explore the laws of refraction…
“Visby Lenses.” In Wikipedia, September 19, 2019. https://en.wikipedia.org/w/index.php?title=Visby_lenses&oldid=916644137. \"), so that humans have been able to focus sunlight to near the theoretical limit[5](https://aiimpacts.org/historic-trends-in-light-intensity/#easy-footnote-bottom-5-1330 \"It may seem like it is possible to focus sunlight to an arbitrary intensity, but this turns out not to be the case. Due to thermodynamic and optical constraints, it is not possible to focus light from an incoherent source such as the sun to an intensity brighter than the source itself. Rick has written about this here. In practice, the limit is around 50% of the intensity of the source. \") for a very long time. Nonetheless, it appears that nobody fully understood how lenses worked until the [17th century](https://en.wikipedia.org/wiki/History_of_optics), and classical optics continued to advance well into the 19th and 20th century. So it seems likely that there were marginal improvements to be made in more recent times. In sum, we were probably slowly approaching an intensity limit for focusing sunlight for a very long time. There is no particular reason to think that there were any sudden jumps in progress during this time, but we have not investigated this. \n\n\nMagnesium is the first combustible material that we found that we are confident burns substantially brighter than crudely focused sunlight, and for which we have an estimated date of first availability. It was first isolated in 1808[6](https://aiimpacts.org/historic-trends-in-light-intensity/#easy-footnote-bottom-6-1330 \"“The metal itself was first isolated by Sir Humphry Davy in England in 1808.” “Magnesium.” In Wikipedia, October 17, 2019. https://en.wikipedia.org/w/index.php?title=Magnesium&oldid=921795645. \"), and burns with a temperature of 3370K[7](https://aiimpacts.org/historic-trends-in-light-intensity/#easy-footnote-bottom-7-1330 \"“The maximum measured combustion temperature is about 3100°C, which is very close to the magnesium adiabatic flame temperature in air, ca. 3200°C” Dreizin, Edward L., Charles H. Berman, and Edward P. Vicenzi. “Condensed-Phase Modifications in Magnesium Particle Combustion in Air.” Scripta Materialia, n.d., 10–1016. \"). Magnesium was bright enough and had a broad enough spectrum to be useful for early photography.\n\n\n##### Mercury Arc Lamp\n\n\nThe first arc lamp was invented as part of the same series of experiments that isolated magnesium. Arc lamps generate light by using an electrical current to generate a plasma[8](https://aiimpacts.org/historic-trends-in-light-intensity/#easy-footnote-bottom-8-1330 \"A plasma is a gas of charged particles, which are typically electrons and ions.\"), which emits light due to a combination of luminescence and incandescence. Although they seem to have been the first intense artificial light sources that do not rely on high combustion temperature[9](https://aiimpacts.org/historic-trends-in-light-intensity/#easy-footnote-bottom-9-1330 \"An example of a low-intensity artificial light source that does not rely on combustion might be a luminescent chemical reaction, such as when phosphorous is exposed to air.\"), they do not seem to have been brighter than a magnesium flame[10](https://aiimpacts.org/historic-trends-in-light-intensity/#easy-footnote-bottom-10-1330 \"Creating a very bright electrical arc requires a specialized atmosphere, and our understanding is that the first arc lamps were operated in open air.\") in the early stages of their development. Nonetheless, by the mid 1930s, mercury arc lamps, operated in glass tubes filled with particular gases, were the brightest sources available that we found. Our impression is that progress was incremental between their first demonstration around 1800 and their implementation as high intensity sources in the the 1930s, but we have not investigated this thoroughly. \n\n\n##### Argon Flashes\n\n\n[Argon flashes](https://en.wikipedia.org/wiki/Argon_flash) were invented during the Manhattan project[11](https://aiimpacts.org/historic-trends-in-light-intensity/#easy-footnote-bottom-11-1330 \"“To study the implosion design at Los Alamos’ Anchor Ranch site and later the Trinity Site, Optics group members and scientists developed new and improved photographic techniques. These techniques included rotating prism and rotating mirror photography, high-explosive flash (“argon bomb”) photography, and flash x-ray photography.”
Atomic Heritage Foundation. “High-Speed Photography.” Accessed November 8, 2019. https://www.atomicheritage.org/history/high-speed-photography. \") to enable the high speed photography that was needed for understanding plutonium implosions. They are created by surrounding a high explosive with argon gas. The shock from the explosive ionizes the argon, which then gives off a lot of UV light as it recombines. The UV light is absorbed by the argon, and because argon has a low heat capacity (that is, takes very little energy to become hot), it becomes extremely hot, emitting ~25000 Kelvin blackbody radiation. This was a large improvement in intensity of light from blackbody radiation. There does not seem to have been much improvement in blackbody sources in the 60 years since. \n\n\n##### Lasers\n\n\nLasers work by storing energy in a material by promoting electrons into higher energy states, so that the energy can then be used to amplify light that passes through the material. Because lasers can amplify light in a very controlled way, they can be used to make extremely short, high energy pulses of light, which can be focused onto a very small area. Because lasers are not subject to the same thermodynamic limits as blackbody sources, it is possible to achieve much higher intensities, with the current state of the art lasers creating light 16 orders of magnitude more intense than the light from an argon flash.\n\n\nFigure 1: Industrial laser[12](https://aiimpacts.org/historic-trends-in-light-intensity/#easy-footnote-bottom-12-1330 \"From Wikimedia Commons: Metaveld BV [CC BY-SA 3.0 (https://creativecommons.org/licenses/by-sa/3.0)] \")\n### Trends\n\n\n#### Light intensity\n\n\nWe investigated the highest publicly recorded light intensities we could find, over time.[13](https://aiimpacts.org/historic-trends-in-light-intensity/#easy-footnote-bottom-13-1330 \"It is plausible that the most intense light to exist (rather than to be be recorded) increased gradually but extremely fast at times, rather than discontinuously in a strict sense. This is because the intensity of a source is sometimes ramped up gradually in the lab (though for our purposes these are similar).\") Our estimates are for all light, not just the visible spectrum.\n\n\n##### Data\n\n\nOne of our researchers, Rick Korzekwa, collected estimated light intensities produced by new technologies over time into [this spreadsheet](https://docs.google.com/spreadsheets/d/19716LOwJPgr9oJjxV9f7pAh7GOb2Lkw0KkQtXK60XxE/edit?usp=sharing). Many sources lacked records of the intensity of light produced specifically, so the numbers are often inferred or estimated from available information. These inferences rely heavily on subject matter knowledge, so have not been checked by another researcher. Figures 2-3 illustrate this data.\n\n\n###### Pre-1808 trend\n\n\nWe do not start looking for discontinuities until 1943, though we have data from beforehand, because our data is not sufficiently complete to distinguish discontinuous progress from continuous, only to suggest the rough shape of the longer term trend.\n\n\nTogether, focused sunlight and magnesium give us a rough trend for slow long term progress, from lenses focusing to the minimum intensity required to ignite plant material in ancient times to intensities similar to a camera flash over the course of at least two millenia. On average during that time, the brightest known lights increased in intensity by a factor of 1.0025 per year (though we do not know how this was distributed among the years). \n\n\nDue to our uncertainty in the early development of optics for focusing sunlight, the trend from 424 BC to 1808 AD should be taken as the most rapid progress that we believe was likely to have occurred during that period. That is, we look at the earliest date for which we have strong verification that burning glasses were used, and assuming these burning glasses produced light that was just barely intense enough to start a fire. So progress may have been slower, if more intense light was available in 424 BC than we know about, however progress could only have been faster on average if burning glass (that could actually burn) didn’t exist in 424 BC, or if there were better things available in 1808 than we are aware, both of which seem less likely than that technology was better than that in 424 BC.\n\n\n\n[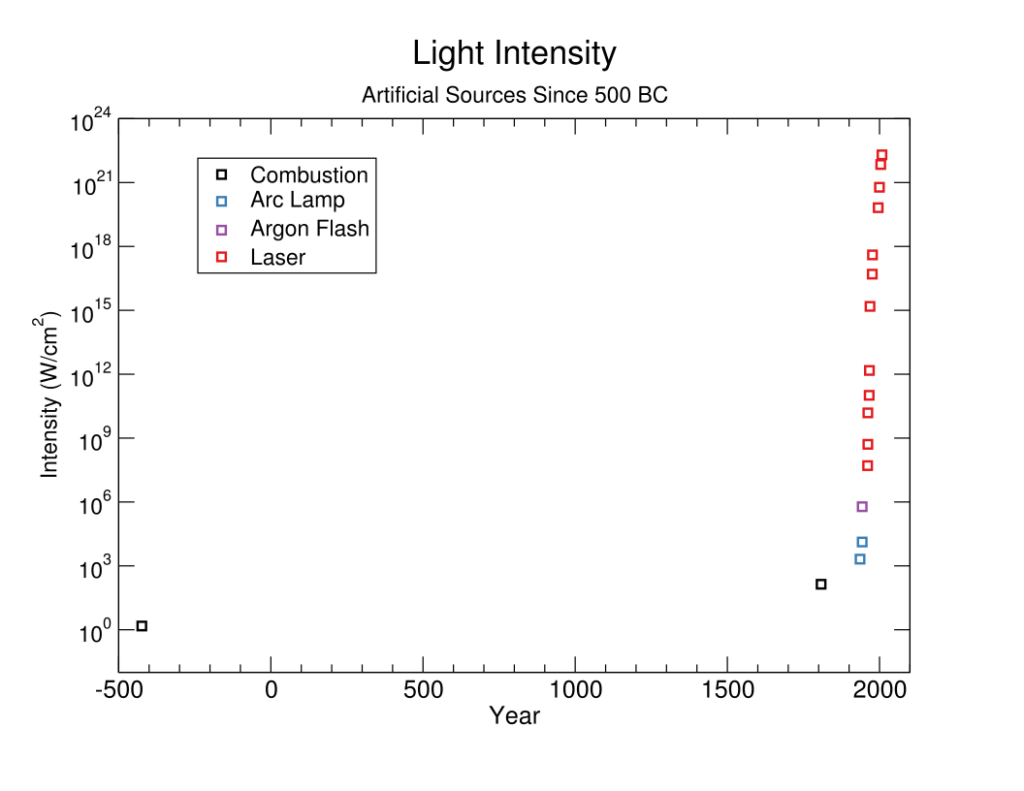](http://aiimpacts.org/wp-content/uploads/2019/04/LIDDetails.png)Figure 2: Estimated light intensity for some historic brightest artificial sources known to us. Note that the very earliest instances of a given type are not necessarily represented, for instance our understanding is that dimmer arc lamps existed in the early 1800s.\n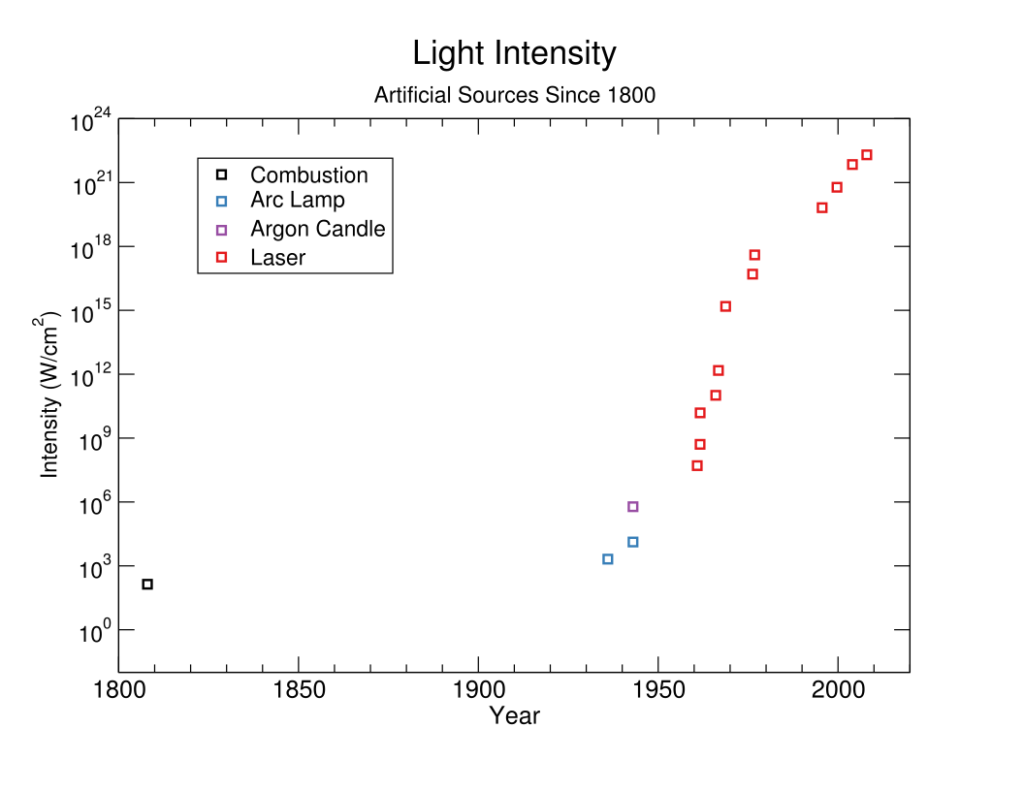Figure 3: Close up of Figure 2, since 1800\n##### Discontinuity measurement\n\n\nWe treat the rate of previous progress as an exponential between the burning glass in 424BC and the first argon candle in 1943. At that point progress has been far above that long term trend for two points in a row, so we assume a new faster trend and measure from the 1936 arc lamp. In 1961, after the trend again has been far surpassed for two points, we start again measuring from the first laser in 1960. See this project’s [methodology page](https://aiimpacts.org/methodology-for-discontinuity-investigation/) for more detail on what we treat as past progress.\n\n\nGiven these choices, we find one large discontinuity from the first argon candle in 1943 (~1000 years of progress in one step), and no other discontinuities of more than ten years since we begin searching in 1943.[14](https://aiimpacts.org/historic-trends-in-light-intensity/#easy-footnote-bottom-14-1330 \"See the methodology page for more detail on how we calculate discontinuities.\")\nIn addition to the size of these discontinuity in years, we have tabulated a number of other potentially relevant metrics [here](https://docs.google.com/spreadsheets/d/1iMIZ57Ka9-ZYednnGeonC-NqwGC7dKiHN9S-TAxfVdQ/edit?usp=sharing).[15](https://aiimpacts.org/historic-trends-in-light-intensity/#easy-footnote-bottom-15-1330 \"See our methodology page for more details.\")\n###### Note on mercury arc lamp\n\n\nThe 1936 mercury arc lamp would be a large discontinuity if there were no progress since 1808. Our impression from various sources is that progress in arc lamp technology was incremental between their first invention at the beginning of the 19th century and the bright mercury lamps that were available in 1936. We did not thoroughly investigate the history and development of arc lamps however, so do not address the question of the first year that such lamps were available or whether such lamps represented a discontinuity.\n\n\n###### Note on argon flash\n\n\nThe argon flash seems to have been the first light source available that is brighter than focused sunlight, after centuries of very slow progress, and represents a large discontinuity. As discussed above, because we are less certain about the earlier data, our methods imply a relatively high estimate on the prior rate of advancement, and thus a low estimate of the size of the discontinuity. So the real discontinuity is likely to be at least 996 years (unless for instance there was accelerating progress during that time that we did not find records of).\n\n\n###### Change in rate of progress\n\n\nLight intensity saw a large increase in the rate of progress, seemingly beginning somewhere between the arc lamps of the 30s and the lasers of the 60s. Between 424BC and 1943, light intensity improved by around 0.4% per year on average, optimistically. Between 1943 and 2008, light intensity grew by an average of around 190% per year.[16](https://aiimpacts.org/historic-trends-in-light-intensity/#easy-footnote-bottom-16-1330 \"See spreadsheet for calculations.\")\nThe first demonstrations of working lasers seems to have prompted a flurry of work. For the first fifteen years, maximum light intensity had an average doubling time of four months, and over roughly five decades following lasers, the average doubling time was a year.[17](https://aiimpacts.org/historic-trends-in-light-intensity/#easy-footnote-bottom-17-1330 \"See spreadsheet for calculations.\")\n##### Discussion\n\n\n###### Factors of potential relevance to causes of abrupt progress\n\n\n*Technological novelty*\n\n\nOne might expect discontinuous progress to arise from particularly paradigm-shifting insights, where a very novel way is found to achieve an old goal. This has theoretical plausibility, and several discontinuities that we know of seem to be associated with fundamentally new methods ([for instance](https://aiimpacts.org/cases-of-discontinuous-technological-progress/), nuclear weapons came from a shift to a new type of energy, high temperature superconductors with a shift to a new class of materials for superconducting). So we are interested in whether discontinuities in light intensity are evidence for or against such a pattern.\n\n\nThe argon flash was a relatively novel method rather than a subtle refinement of previous technology, however it did not leverage any fundamentally new physics. Like previous light sources, it works by adding a lot of energy into a material to make it emit light in a relatively disorganized and isotropic manner. Achieving this by way of a shockwave from a high explosive was new.\n\n\nIt is unclear whether using an explosive shockwave in this way had not been done previously because nobody had thought of it, or because nobody wanted a shorter and brighter flash of light so much that they were willing to use explosives to get it.[18](https://aiimpacts.org/historic-trends-in-light-intensity/#easy-footnote-bottom-18-1330 \"Both the film industry and the explosives industry were publishing papers suggesting a need for very short and bright flashes of light for high speed photography in the 1910’s and 1920’s, but most of the work focused on repeatability, convenience, and total quantity of light, rather than peak power output or intensity.\")\nThe advent of lasers did not produce a substantial discontinuity, but they did involve an entirely different mechanism for creating light to previous technologies. Older methods created more intense light by increasing the energy density of light generation (which mostly meant making the thing hotter), but lasers do it by creating light in a very organized way. Most high intensity lasers take in a huge amount of light, convert a small portion of it to laser light, and create a laser pulse that is many orders of magnitude more intense than the input light. This meant that lasers could scale to extremely high output power without becoming so hot that the output is that of a blackbody.\n\n\n*Effort directed at progress on the metric*\n\n\nThere is a hypothesis that metrics which see a lot of effort directed at them will tend to be more continuous than those which are improved as a side-effect of other efforts. So we are interested in whether these discontinuities fit that pattern.\n\n\nThough there was interest over the years in using intense light as a weapon[19](https://aiimpacts.org/historic-trends-in-light-intensity/#easy-footnote-bottom-19-1330 \"“Archimedes, the renowned mathematician, was said to have used a burning glass as a weapon in 212 BC, when Syracuse was besieged by Marcus Claudius Marcellus. The Roman fleet was supposedly incinerated, though eventually the city was taken and Archimedes was slain. The legend of Archimedes gave rise to a considerable amount of research on burning glasses and lenses until the late 17th century. ” “Burning Glass.” In Wikipedia, September 15, 2019. https://en.wikipedia.org/w/index.php?title=Burning_glass&oldid=915774651.\"), and for early photographers, who wanted safe, convenient, short flashes that could be fired in quick succession, there seems to have been relatively little interest in increasing the peak intensity of a light source. The US military sought bright sources of light for illuminating aircraft or bombing targets at night during World War II. But most of the literature seems to focus on the duration, total quantity of light, or practical considerations, with peak intensity as a minor issue at most.\n\n\nThe argon flash appears to have been developed more as a high peak power device than as a high peak intensity device.[20](https://aiimpacts.org/historic-trends-in-light-intensity/#easy-footnote-bottom-20-1330 \"The distinction here is between energy/time and energy/(time*area).\") It did not matter if the light could be focused to a small spot, so long as enough light was given off during the course of an experiment to take pictures. Still, you can only drive power output up so much before you start driving up intensity as well, and the argon flash was extremely high power.\n\n\nPossibly argon flashes were developed largely because an application appeared which could make use of very bright lights even with the concomitant downsides. \n\n\nThere seems to have been a somewhat confusing lack of interest in lasers, even after they looked feasible, in part due to a lack of foresight into their usefulness. Charles Townes, one of the scientists responsible for the invention of the laser, remarked that it could have been invented as early as 1930[21](https://aiimpacts.org/historic-trends-in-light-intensity/#easy-footnote-bottom-21-1330 \"“This raises the question: why weren’t lasers invented long ago, perhaps by 1930 when all the necessary physics was already understood, at least by some people?”
“The First Laser.” Accessed November 9, 2019. https://www.press.uchicago.edu/Misc/Chicago/284158_townes.html. \"), so it seems unlikely that it was held up by a lack of understanding of the fundamental physics (Einstein first proposed the basic mechanism in 1917[22](https://aiimpacts.org/historic-trends-in-light-intensity/#easy-footnote-bottom-22-1330 \"In 1917, Albert Einstein established the theoretical foundations for the laser and the maser in the paper Zur Quantentheorie der Strahlung (On the Quantum Theory of Radiation)
“Laser.” In Wikipedia, November 4, 2019. https://en.wikipedia.org/w/index.php?title=Laser&oldid=924565157. \")). Furthermore, the first paper reporting successful operation of a laser was rejected in 1960, because the reviewers/editors did not understand how it was importantly different from previous work.[23](https://aiimpacts.org/historic-trends-in-light-intensity/#easy-footnote-bottom-23-1330 \"“Theodore Maiman made the first laser operate on 16 May 1960 at the Hughes Research Laboratory in California, by shining a high-power flash lamp on a ruby rod with silver-coated surfaces. He promptly submitted a short report of the work to the journal Physical Review Letters, but the editors turned it down. Some have thought this was because the Physical Review had announced that it was receiving too many papers on masers—the longer-wavelength predecessors of the laser—and had announced that any further papers would be turned down. But Simon Pasternack, who was an editor of Physical Review Letters at the time, has said that he turned down this historic paper because Maiman had just published, in June 1960, an article on the excitation of ruby with light, with an examination of the relaxation times between quantum states, and that the new work seemed to be simply more of the same.”
\n\n\n\n“The First Laser.” Accessed November 9, 2019. https://www.press.uchicago.edu/Misc/Chicago/284158_townes.html.\") \n\n\nAlthough it seems clear that the scientific community was not eagerly awaiting the advent of the laser, there did seem to be some understanding, at least among those doing the work, that lasers would be powerful. Townes recalled that, before they finished building their laser, they did expect to “at least get a lot of power”[24](https://aiimpacts.org/historic-trends-in-light-intensity/#easy-footnote-bottom-24-1330 \"“Oral-History:Charles Townes (1991) – Engineering and Technology History Wiki.” Accessed November 9, 2019. https://ethw.org/Oral-History:Charles_Townes_(1991).\"), something which could be predicted with relatively straightforward calculations. Immediately after the first results were published, the general sentiment seems to have been that it was novel and interesting, but it was allegedly described as “a solution in search of a problem”.[25](https://aiimpacts.org/historic-trends-in-light-intensity/#easy-footnote-bottom-25-1330 \"Bertolotti, Mario. The History of the Laser. CRC Press, 2004. https://books.google.co.uk/books?id=JObDnEtzMJUC&pg=PA262&lpg=PA262&dq=laser+%22solution+in+search+of+a+problem%22&source=bl&ots=tzL8lw1cU5&sig=ACfU3U3uHXVfadjwktCm1SmPU7oYz66mlA&hl=en&sa=X&redir_esc=y#v=onepage&q=laser%20%22solution%20in%20search%20of%20a%20problem%22&f=false\") Similar to the argon flash, it would appear that intensity was not a priority in itself at the time the laser was invented, and neither were any of the other features of laser light that are now considered valuable, such as narrow spectrum, short pulse duration, and long coherence length.\n\n\nMost of the work leading to the first lasers was focused on the associated atomic physics, which may help explain why the value of lasers for creating macroscopic quantities of light wasn’t noticed until after they had been built. \n\n\nIn sum, it seems the argon flash and the laser both caused large jumps in a metric that is relevant today but that was not a goal at the time of their development. Both could probably have been invented sooner, had there been interest.\n\n\n###### Predictability\n\n\nOne reason to care about discontinuities is because they might be surprising, and so cause instability or problems that we are not prepared for. So we are interested in whether discontinuities were in fact surprising.\n\n\nIt is unclear how predictable the large jump from the argon flash was. Our impression is that without knowledge of the field, it would have been difficult to predict the huge progress from the argon flash ahead of time. High explosives, arc lamps, and flash tubes all produced temperatures of around 4,000K to 5,000K. Jumping straight from that to >25,000K would probably have seemed rather unlikely.\n\n\nHowever as discussed above, it seems plausible that the technology allowing argon flashes was relatively mature earlier on, and therefore that they might have been predictable to someone familiar with the area.\n\n\nNotes\n-----\n\n\n\n\n\n\n\n\n\n\n\n\n\n\n\n", "url": "https://aiimpacts.org/historic-trends-in-light-intensity/", "title": "Historic trends in light intensity", "source": "aiimpacts.org", "source_type": "wordpress", "date_published": "2020-02-08T02:38:35+00:00", "paged_url": "https://aiimpacts.org/feed?paged=9", "authors": ["Katja Grace"], "id": "e60a95815c9b7b4d4f32c169880eb322", "summary": []}
{"text": "Historic trends in book production\n\nThe number of books produced in the previous hundred years, sampled every hundred or fifty years between 600AD to 1800AD contains five greater than 10-year discontinuities, four of them greater than 100 years. The last two follow the invention of the printing press in 1492. \n\n\nThe real price of books dropped precipitously following the invention of the printing press, but the longer term trend is sufficiently ambiguous that this may not represent a substantial discontinuity.\n\n\nThe rate of progress of book production changed shortly after the invention of the printing press, from a doubling time of 104 years to 43 years.\n\n\nDetails\n-------\n\n\nThis case study is part of AI Impacts’ [discontinuous progress investigation](https://aiimpacts.org/discontinuous-progress-investigation/).\n\n\n### Background\n\n\nAround 1439, Johannes Gutenburg invented a machine for making books commonly referred to as “the printing press”. The printing press was used to quickly copy pre-created sheets of letters of ink onto a print medium.[1](https://aiimpacts.org/historic-trends-in-book-production/#easy-footnote-bottom-1-1414 \"“Johannes Gensfleisch zur Laden zum Gutenberg (/ˈɡuːtənbɜːrɡ/;[1] c. 1400 – February 3, 1468) was a German blacksmith, goldsmith, inventor, printer, and publisher who introduced printing to Europe with the printing press. […] Gutenberg in 1439 was the first European to use movable type. Among his many contributions to printing are: the invention of a process for mass-producing movable type; the use of oil-based ink for printing books; adjustable molds; mechanical movable type; and the use of a wooden printing press similar to the agricultural screw presses of the period. His truly epochal invention was the combination of these elements into a practical system that allowed the mass production of printed books and was economically viable for printers and readers alike.” – “Johannes Gutenberg”. 2018. En.Wikipedia.Org. Accessed May 28 2019. https://en.wikipedia.org/w/index.php?title=Johannes_Gutenberg&oldid=895246592\") Presses that stamped paper with carved blocks of wood covered in ink were already being used in Europe,[2](https://aiimpacts.org/historic-trends-in-book-production/#easy-footnote-bottom-2-1414 \"“Printing in East Asia had been prevalent since the Tang dynasty, and in Europe, woodblock printing based on existing screw presses was common by the 14th century.” – “Printing Press”. 2015. En.Wikipedia.Org. Accessed June 3 2019. https://en.wikipedia.org/w/index.php?title=Printing_press&oldid=899397867\") but Gutenburg made several major improvements on existing methods, notably creating the hand mould, a device which allowed for quickly creating sheets of inked letters rather than carving them out of wood. The printing press allowed for the quick and cheap production of printed books like never before.[3](https://aiimpacts.org/historic-trends-in-book-production/#easy-footnote-bottom-3-1414 \"“Gutenberg’s most important innovation was the development of hand-molded metal printing matrices, thus producing a movable type-based printing press system. His newly devised hand mould made possible the precise and rapid creation of metal movable type in large quantities. Movable type had been hitherto unknown in Europe. In Europe, the two inventions, the hand mould and the printing press, together drastically reduced the cost of printing books and other documents, particularly in short print runs.” – “Printing Press”. 2015. En.Wikipedia.Org. Accessed June 3 2019. https://en.wikipedia.org/w/index.php?title=Printing_press&oldid=899397867\")\nReplica of the Gutenberg Printing Press[4](https://aiimpacts.org/historic-trends-in-book-production/#easy-footnote-bottom-4-1414 \"From Wikimedia Commons:
vlasta2 [CC BY 2.0 (https://creativecommons.org/licenses/by/2.0)] \")\n### Trends\n\n\nWe looked primarily at two different metrics– the rate of book production in Western Europe and the real price of books in England. We chose these two because they were some of the only printing-related data sources which had data that went back several centuries before the invention of the printing press. \n\n\n\nHad the data been available, we would like to have looked at some metric correlated clearly with innovations in the writing / printing process — e.g. the number of pages produced per worker per hour. Then we could check whether the printing press represented a discontinuity relative to earlier innovations (e.g., the pecia system for hand-copying manuscripts).[5](https://aiimpacts.org/historic-trends-in-book-production/#easy-footnote-bottom-5-1414 \"“Moreover, thanks to other innovations in the high Middle Ages (in particular, the substitution of paper for parchment, but also the spread of more efficient ways of hand copying manuscripts, such as the pecia system) and the fifteenth century (the printing press), the price of books was greatly reduced, providing additional impulse to the growth process.” – Buringh, Eltjo, and Jan Luiten Van Zanden. “Charting the “Rise of the West”: Manuscripts and Printed Books in Europe, A Long-Term Perspective from the Sixth through Eighteenth Centuries.” The Journal of Economic History69, no. 02 (2009): 409. doi:10.1017/s0022050709000837, 425.\") \n\n\n\nUnfortunately, neither the rate of book production nor the price of book data we have correlate well with innovations in the writing / printing process. The authors of our rate of book production data claim that most of the variation in the pre-printing press numbers is explained by factors which are not innovation or close proxies to innovation.[6](https://aiimpacts.org/historic-trends-in-book-production/#easy-footnote-bottom-6-1414 \"“If we take the Middle Ages as a whole, the three factors we have data for– universities, monasteries, and urbanization– together explain almost 60 percent of the variation in per capita book production (first two columns).” – Buringh, Eltjo, and Jan Luiten Van Zanden. “Charting the “Rise of the West”: Manuscripts and Printed Books in Europe, A Long-Term Perspective from the Sixth through Eighteenth Centuries.” The Journal of Economic History 69, no. 02 (2009): 409. doi:10.1017/s0022050709000837, 431.\") Our data on the price of books is similarly unhelpful, as the early price data is too sparse to be meaningful.\n\n\nIn addition to the two metrics described above, we looked cursorily at a few metrics with no early data which changed drastically as a result of the printing press– the number of unique titles printed per year, the variation of genres in books, the price of books in the Netherlands, and the total consumption of books.\n\n\n#### Rate of book production in Western Europe\n\n\n##### Data collection\n\n\nOur data for the rate of book production come from estimates of Europe-only production generated in a [2009 paper by historians Eltjo Buringh and Jan Luiten Van Zanden](https://socialhistory.org/sites/default/files/docs/projects/books500-1800.pdf).[7](https://aiimpacts.org/historic-trends-in-book-production/#easy-footnote-bottom-7-1414 \"Buringh, Eltjo, and Jan Luiten Van Zanden. “Charting the “Rise of the West”: Manuscripts and Printed Books in Europe, A Long-Term Perspective from the Sixth through Eighteenth Centuries.” The Journal of Economic History 69, no. 02 (2009): 409. doi:10.1017/s0022050709000837\") Rate data is represented as the number of books produced in the previous 100 years at various points in time.\n\n\nWhen we use the term *book*, we mean it to refer to any copy of a written work, whether hand-copied manually or produced via some kind of printing technique. The paper separates book production into estimates of *manuscript* and *printed book* production, where the production of *printed books* starts only after the printing press is invented. We will also use the terms *manuscript* and *printed book* to talk about the data, but it’s unclear to us if the paper means *manuscript* to mean “any book not made using a Gutenburg-era printing press” or “any book transcribed by hand”. At one point the authors sum these two estimates into a single graph of production per capita,[8](https://aiimpacts.org/historic-trends-in-book-production/#easy-footnote-bottom-8-1414 \"See Figure 2 in this paper which sources data from manuscript and printed book estimates in Tables 3 and 4. – Buringh, Eltjo, and Jan Luiten Van Zanden. “Charting the “Rise of the West”: Manuscripts and Printed Books in Europe, A Long-Term Perspective from the Sixth through Eighteenth Centuries.” The Journal of Economic History 69, no. 02 (2009): 409. doi:10.1017/s0022050709000837\") suggesting that the combination of manuscript and printed book data should cover all books.\n\n\nThe paper’s estimates for manuscript production are constructed by taking an existing sample of manuscripts and then attempting to correct for its geographical and temporal biases.[9](https://aiimpacts.org/historic-trends-in-book-production/#easy-footnote-bottom-9-1414 \"“As a result of these four inclusion criteria we may expect temporal and spatial skewness to arise in the global database as a consequence of unavoidable publication and selection biases. Nevertheless, numerically such skewness can be overcome by specific correction and standardization steps, as we will demonstrate later.” Buringh, Eltjo, and Jan Luiten Van Zanden. Charting the “Rise of the West”: Manuscripts and Printed Books in Europe, A long-term perspective from the sixth through eighteenth centuries, Appendix I The Journal of Economic History69, no. 02 (2009): 409. doi:10.1017/s0022050709000837. \") Estimates for book production are constructed by counting new titles in library catalogues and multiplying by estimates for average prints per title at a given time.[10](https://aiimpacts.org/historic-trends-in-book-production/#easy-footnote-bottom-10-1414 \"“We estimate the number of titles or editions that appeared in Western Europe between 1454 and 1800, multiplied by rather crude (and probably relatively low) estimates of the average size of print runs … The most important sources for counting new titles are library catalogues and national and international datasets which are based on these catalogues and present inventories of editions published in different countries and/or languages (the ‘short title catalogues’), most of which are available on-line.”
From Buringh, Eltjo, and Jan Luiten Van Zanden. Charting the “Rise of the West”: Manuscripts and Printed Books in Europe, A long-term perspective from the sixth through eighteenth centuries, Appendix II The Journal of Economic History69, no. 02 (2009): 409. doi:10.1017/s0022050709000837. \") \n\n\n\nThe estimates of manuscript production seem extremely non-robust given that large number of correction factors applied.[11](https://aiimpacts.org/historic-trends-in-book-production/#easy-footnote-bottom-11-1414 \"See tables I-3 through I-6 of Buringh, Eltjo, and Jan Luiten Van Zanden. Charting the “Rise of the West”: Manuscripts and Printed Books in Europe, A long-term perspective from the sixth through eighteenth centuries, Appendix I The Journal of Economic History69, no. 02 (2009): 409. doi:10.1017/s0022050709000837. \") The estimates of book production seem somewhat more robust, but should be taken as a lower bound as the authors did not correct for lost books and have estimated the average number of prints per title conservatively.[12](https://aiimpacts.org/historic-trends-in-book-production/#easy-footnote-bottom-12-1414 \"“For a number of reasons our figures should be interpreted as lower-bound estimates: we do not correct for the (many?) books of which all traces have been lost, nor for the fact that at the book fairs only part of the production was presented. Series publications are not included either. The estimates of print runs are also conservative: we follow the literature that average sizes of editions between the 1450s and 1500 probably increased from 100 to 500 (the print run of the Gutenberg bible was 200); there is ample evidence that this increase continued after 500, but at a slower pace. We tentatively estimate that it went up to 1,000 in 1800, again a quite conservative estimate (print runs of mass produced books, such as bibles, prayer books and primary school books increased to more than hundred thousand in some cases).”
From Buringh, Eltjo, and Jan Luiten Van Zanden. Charting the “Rise of the West”: Manuscripts and Printed Books in Europe, A long-term perspective from the sixth through eighteenth centuries, Appendix II The Journal of Economic History69, no. 02 (2009): 409. doi:10.1017/s0022050709000837.\") \n\n\n\n##### Data\n\n\nFigure 1a displays the raw data for rate of book production on a log scale, taken from the data in the paper described above and compiled in [this spreadsheet](https://docs.google.com/spreadsheets/d/1pgo0QizEMonIo11RvE2ErbyocKHXhV08EyXBYrmWVgk/edit?usp=sharing). Each data point represents the total number of books produced in the previous 100 years. \n\n\n\n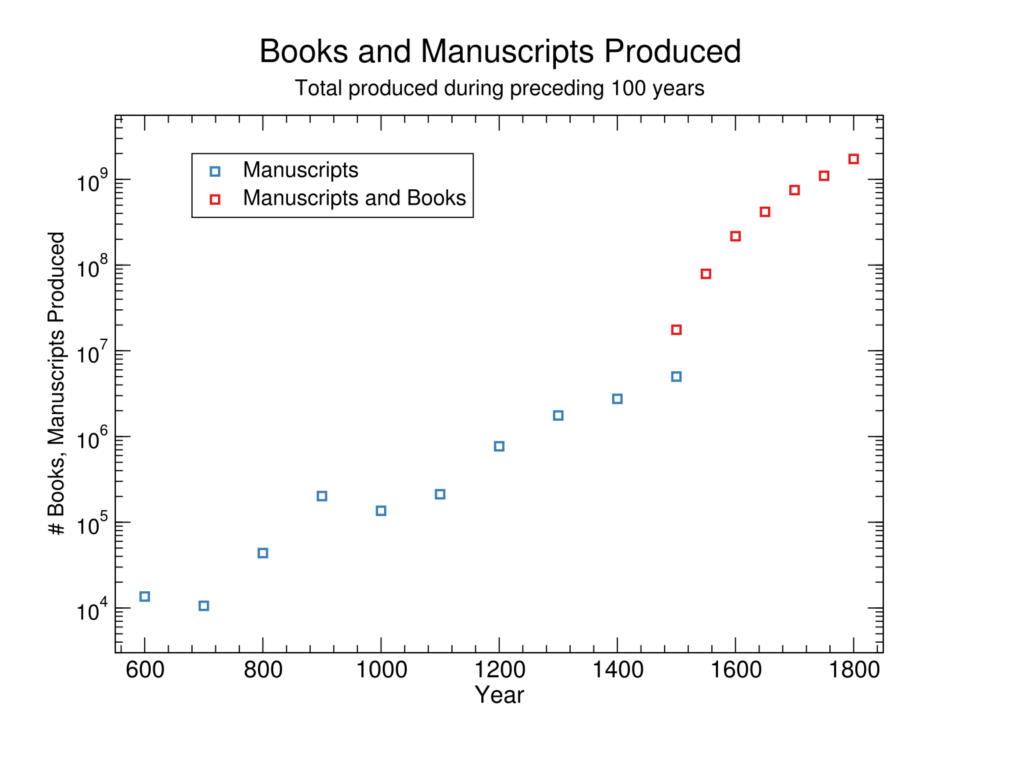Figure 1a: Book production in Western Europe\nFigure 1b displays the same data as Figure 1a along with our interpretation. \n\n\nLooking at the data, we assume an exponential trend up until 1500, and another one after that.[13](https://aiimpacts.org/historic-trends-in-book-production/#easy-footnote-bottom-13-1414 \"See our methodology page for more details.\") The blue line is the average log rate of the rate of book production before the invention of the printing press (just manuscripts); the red line is the average log rate of the rate of book production after the invention of the printing press (manuscripts + printed books).\n\n\nFigure 1b: Rate of book production in Western Europe. Blue and red lines are the average log rates of the rate of book production before and after the printing press. Grey points are projections of the average log rate before the printing press.\nGrey points shown after 1500 reflect projected manuscript and therefore book production had the printing press not been invented. In practice, the actual number of manuscripts produced after 1500 were very small and not presented in the data.\n\n\n##### Discontinuity measurement\n\n\nIf we just look at the trend of book production per past 100 years, measured once every 100 years before 1500, and then once every 50 years afterwards, we can calculate discontinuities of sizes 161 years in 900, 134 years in 1200, 23 years in 1300, 180 years in 1500, and 138 years in 1550.[14](https://aiimpacts.org/historic-trends-in-book-production/#easy-footnote-bottom-14-1414 \"See our methodology page for more details, and our spreadsheet for our calculation.
In addition to the sizes of these discontinuities in years, we have tabulated a number of other potentially relevant metrics here. See our methodology page for more details.\") This is obviously a strange kind of trend–a discontinuity of one hundred years in a metric with datapoints every hundred years might mean nothing perceptible at the one-year scale. So in particular, these discontinuities do not tell us much about whether there would be discontinuities in a more natural metric, such as annual book production.\n\n\n##### Changes in the speed of progress\n\n\nThere was a marked change in progress in the rate of book production with the invention of the printing press, corresponding to a change in the doubling time of the rate of book production from 104 years to 43 years.[15](https://aiimpacts.org/historic-trends-in-book-production/#easy-footnote-bottom-15-1414 \"See our methodology page for more details, and the relevant cells in this spreadsheet for the calculations.\")\nInterpreting this rate of change on the graph, before the invention of the printing press, the total rate of book production, which consists entirely of manuscripts, follows the exponential line shown in blue. The invention of the printing press in 1439 allows for mass production of printed books, causing the rate of book production to veer sharply off the existing exponential line, shown as the first point in red. Note that our underlying data sources are non-robust, particularly for manuscript data pre-printing press, so the magnitude of this change in rate of progress may be under or overstated. \n\n\n##### Discussion of causes\n\n\nThe change in the doubling time of the rate of book production caused by the printing press may reflect a large change in the factors that drove book production. \n\n\nIn their paper, Buringh and Van Zanden note that in the Middle Ages, 60% of the variation in book production is explained by the number of universities, the number of monasteries, and urbanization.[16](https://aiimpacts.org/historic-trends-in-book-production/#easy-footnote-bottom-16-1414 \"
Buringh, Eltjo, and Jan Luiten Van Zanden. “Charting the “Rise of the West”: Manuscripts and Printed Books in Europe, A Long-Term Perspective from the Sixth through Eighteenth Centuries.” The Journal of Economic History 69, no. 02 (2009): 409. doi:10.1017/s0022050709000837 “If we take the Middle Ages as a whole, the three factors we have data for– universities, monasteries, and urbanization– together explain almost 60 percent of the variation in per capita book production (first two columns).”\") They produce the following graph, correlating monastery numbers and early book production:\n\n\n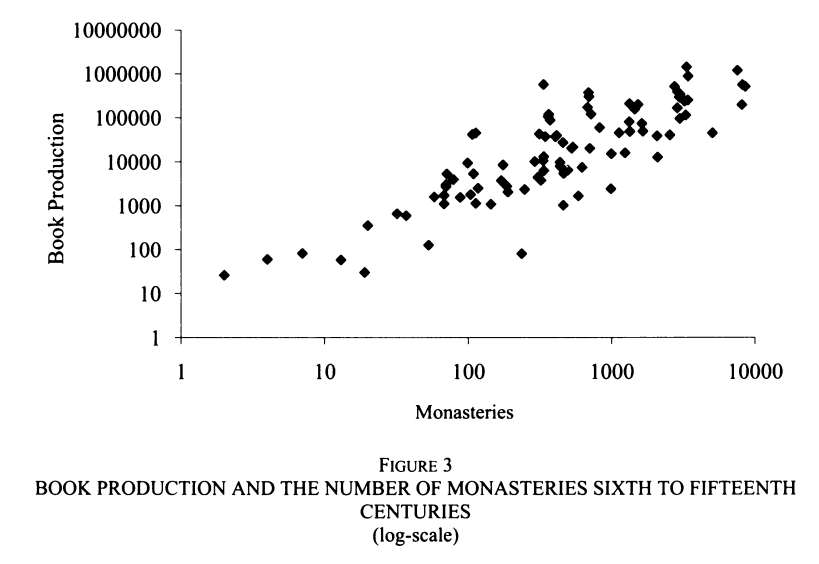Figure 2: Buringh and Van Zanden’s figure of the relationship between book production and monestaries\nBy contrast, after the printing press was invented, Buringh and Van Zanden attribute a much more important role to individual book consumption and the forces of the market:\n\n\n\n> How to explain the significant increase in book production and consumption in the centuries following the invention of moveable type printing in the 1450s? The effect of the new technology (and import technological changes in the production of paper) was that from the 1470s on, book prices declined very rapidly. This had number of effects: consumption per literate individual increased, but it also became more desirable and less costly to become literate. Moreover, economies of scale in the printing industry led to further price reductions stimulating even more growth in book consumption.\n> \n> \n\n\nIt seems plausible that the move between exponential curves caused by the printing press was a shift from an exponential curve that reflected the growth of monasteries, universities, and cities to an exponential curve that reflected the growth of a complicated set of market forces.\n\n\n#### Real price of books in England\n\n\n##### Data collection\n\n\nWe took data from [a 2004 paper written by economic historian Gregory Clark](http://www.iisg.nl/hpw/papers/clark.pdf), who took data from historic records of price quotes,[17](https://aiimpacts.org/historic-trends-in-book-production/#easy-footnote-bottom-17-1414 \"“The price history of pre-industrial England is uniquely well documented. England achieved substantial political stability by 1066. There was little of the internal strife that proved so destructive of documentary history in other countries. Also England’s island position and relative military success protected it from foreign invasion, except for the depredations of the Scots in the border counties. England further witnessed the early development of markets and monetary exchange. In particular when reports of private purchases begin in 1208-9 the markets for goods were clearly well established. A large number of documents with such prices survive in the records of churches, monasteries, colleges, charities, and government.” From
Clark, Gregory. “Lifestyles of the Rich and Famous: Living Costs of the Rich versus the Poor in England, 1209-1869.” 2004. MS, UC Davis, Davis. http://www.iisg.nl/hpw/papers/clark.pdf. \") though data before 1450 is based on just 32 total price quotes, and Clark notes that “the prices vary a lot by decade since it is hard to control for the quality and size of the manuscript.”[18](https://aiimpacts.org/historic-trends-in-book-production/#easy-footnote-bottom-18-1414 \"“Unfortunately observations on book prices before 1450 are limited: I found only 32 price quotes for these years. And the prices vary a lot by decade since it is hard to control for the quality and size of the manuscript. Even though the scale goes up to 4000%, many of the decadal averages of prices before 1450 cannot be shown.” From
Clark, Gregory. “Lifestyles of the Rich and Famous: Living Costs of the Rich versus the Poor in England, 1209-1869.” 2004. MS, UC Davis, Davis. http://www.iisg.nl/hpw/papers/clark.pdf. \") As such, we should not take much meaning out of the individual data points before 1450 or interpret the period between 1360 and 1500 as a rising trend. \n\n\n\nClark’s paper reports an index of the nominal price of books in Table 9 of his paper. To instead get an index of the *real* price of books,[19](https://aiimpacts.org/historic-trends-in-book-production/#easy-footnote-bottom-19-1414 \"We prefer real prices rather than nominal ones because we want to exclude the effects of inflation in our data. See here for a fuller explanation.\") we divided each nominal price by Clark’s reported “cost of living” for each year (x 100), which was the amount of money paid by a relatively prosperous consumer for the same bundle of goods every year.[20](https://aiimpacts.org/historic-trends-in-book-production/#easy-footnote-bottom-20-1414 \"See this spreadsheet for the adjustment calculation. This data with this adjustment was originally made and charted by Timothy C. Irwin: Irwin, Timothy. (2013). Shining a Light on the Mysteries of State: The Origins of Fiscal Transparency in Western Europe. IMF Working Papers. 13. 1. 10.5089/9781475570946.001. \")\n##### Data\n\n\nFigure 3 is a graph of (an index of) the real price of books in England, generated from the data described above and compiled in [this spreadsheet](https://docs.google.com/spreadsheets/d/1Ur7KC971u2hUhV-FEYFVhnKvFtyT72Ow5XLjA5ermr4/edit?usp=sharing). Each point represents the amount of money in each year needed to buy some bundle of books assuming you would pay 100 for that same bundle of books in 1860. \n\n\n\nEconomist Timothy Irwin, looking at this same dataset, claims that the drop in price around 1350 was due to knowledge about paper-making finally making its way to England: “As time passed, improvements in technology and the gradual spread of literacy reduced these obstacles to effective transparency. In particular, the diffusion of knowledge about paper-making (from around 1150) and then printing (from around 1450) dramatically reduced the price of books. (See Figure 1 for an estimate of the decline in England).”[21](https://aiimpacts.org/historic-trends-in-book-production/#easy-footnote-bottom-21-1414 \"Irwin, Timothy. (2013). Shining a Light on the Mysteries of State: The Origins of Fiscal Transparency in Western Europe. IMF Working Papers. 13. 1. 10.5089/9781475570946.001.\") \n\n\n\n‘Figure 1’ in the quote above refers to a graph of the real price of books that uses the same data source and is identical to the one we generated. His claim seems plausible, but we are not confident about it given how sparse and noisy the early data is and given our lack of precise date information on how paper-making spread in England.\n\n\n##### Discontinuity measurement\n\n\nThe graph contains two major drops– one as a result of the printing press, and one claimed to be the result of paper replacing parchment in England. Looking at just the set of blue data points between these two drops, we can see that they are clustered around some range of values. The data in this range is too noisy and sparse[22](https://aiimpacts.org/historic-trends-in-book-production/#easy-footnote-bottom-22-1414 \"See Data collection above.\") to generate a meaningful rate of progress, but it seems clear that for a wide variety of plausible rates, the printing press represented a discontinuity in the real price of books when compared to the trend in book prices after the spread of paper-making.\n\n\nHowever, if you take the past trend to include the price of books before paper-making, then there is no clear discontinuity– the price of printed books could be part of an existing trend of dropping prices that started with paper-making. We also believe the data here is too poor to draw firm conclusions.\n\n\n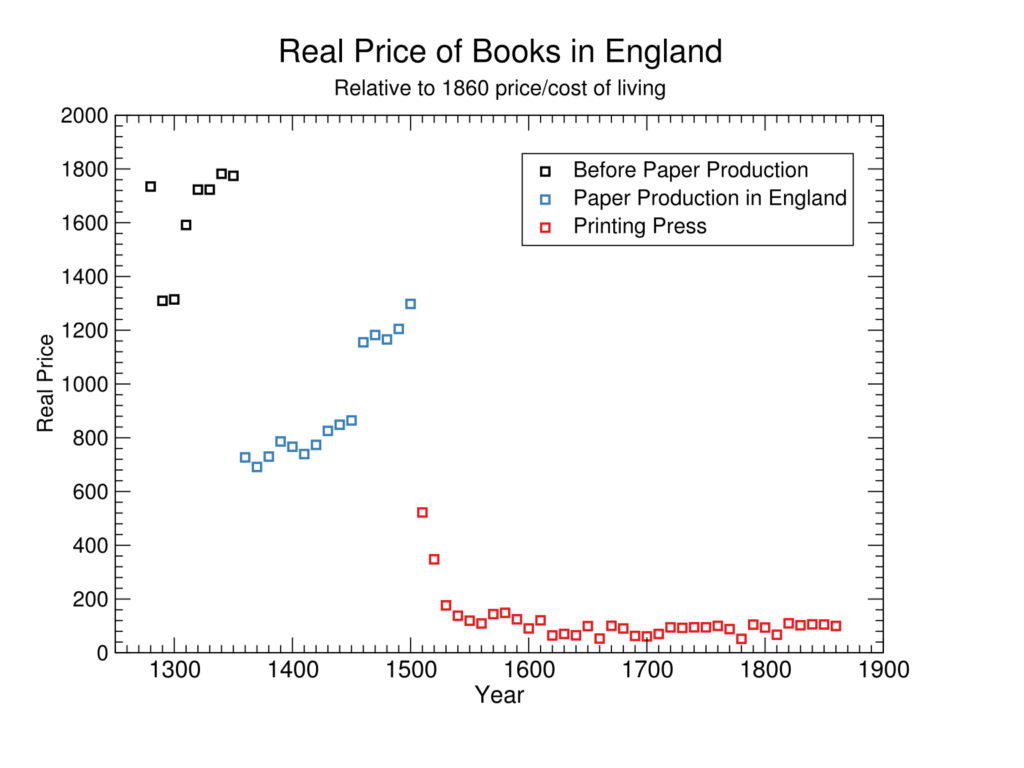Figure 3: Real price of books in England. All prices are relative to a book in 1860 costing 100, so a real price of 1800 would be 18x as expensive as a book in 1860.\n##### Discussion of causes\n\n\nWhether or not it counts as a substantial discontinuity relative to the longer term trend, the printing press produced a sharp drop in the real price of books. This was because their price was largely driven by labor costs, which went down sharply (one author estimates by a factor of 341) when a laborer could use a machine to print massive numbers of books rather than manually transcribing each copy.[23](https://aiimpacts.org/historic-trends-in-book-production/#easy-footnote-bottom-23-1414 \"“The increased demand of books was driven by a huge decrease in the price of books. The smaller price was possible by the increased efficiency in the production of books since the invention of the printing press around 1440. Clark (2008) measures the subsequent productivity increase as the ratio between the wage of building craftsmen and the price of a book and finds a 20-fold increase in productivity in the first 200 years after the invention, […] Productivity is measured as the ratio between the wage of building craftsmen and the price of a book of standard characteristics. Clark notes that ‘with both hand production and the printing press the main cost in book production was labor (paper and parchment production costs were mainly labor costs).’ Clark (2008) notes that copyists before the time of the printing press were able to copy 3,000 words of plain text per day. This implies that the production of one copy of the Bible meant 136 days of work. Eisenstein5 is able to compare the price of paying a scribe to duplicating a translation of Plato’s Dialogues with the price for duplicating the same work by the Ripoli printing press in Florence in 1483. For three florins the Ripoli Press produced 1,025 copies whereas the scribe would produce one copy for one florin. This implies that the cost per book decreased 341 times with the introduction of the printing press.”
Roser, Max. “Books.” Our World in Data. March 05, 2013. Accessed June 28, 2019. https://ourworldindata.org/books#the-publication-of-unique-booktitles-over-the-long-run. \")\n#### Other noteworthy metrics\n\n\nMany historians associate the invention of the printing press with other unsurprising book-related changes in the world, including:[24](https://aiimpacts.org/historic-trends-in-book-production/#easy-footnote-bottom-24-1414 \"The following points and summary all come from Our World in Data — Books, but they reference a variety of outside data sources. Roser, Max. “Books.” Our World in Data. March 05, 2013. Accessed June 28, 2019. https://ourworldindata.org/books#the-publication-of-unique-booktitles-over-the-long-run. \") \n\n\n\n* An increase in the productivity of book production, i.e. the ratio between the wage of a copy producer and the price of a standard book. In particular, one estimate measures a 20-fold increase in the productivity in the first 200 years after the invention.[25](https://aiimpacts.org/historic-trends-in-book-production/#easy-footnote-bottom-25-1414 \"See this graph, Productivity in book production in England, 1470s-1960s – Clark (2008) originally found in Clark, Gregory. A Farewell to Alms: A Brief Economic History of the World. Vancouver: Crane Library at the University of British Columbia, 2010. , republished in Roser, Max. “Books.” Our World in Data. March 05, 2013. Accessed June 28, 2019. https://ourworldindata.org/books#the-publication-of-unique-booktitles-over-the-long-run. \") Another estimate guesses that there was a 340-fold decrease in the cost per book as a direct result of the printing press.[26](https://aiimpacts.org/historic-trends-in-book-production/#easy-footnote-bottom-26-1414 \"“In 1483, the Ripoli Press charged three florins per quinterno for setting up and printing Ficino’s translation of Plato’s Dialogues. A scribe might have charged one florin per quinterno for duplicating the same work. The Ripoli Press produced 1,025 copies; the scribe would have turned out one.” Eisenstein, Elizabeth L. The Printing Press as an Agent of Change Communications and Cultural Transformations in Early-modern Europe ; Volumes I and II. Cambridge: Cambridge University Press, 2009. As Max Roser writes,“Eisenstein is able to compare the price of paying a scribe to duplicating a translation of Plato’s Dialogues with the price for duplicating the same work by the Ripoli printing press in Florence in 1483. For three florins the Ripoli Press produced 1,025 copies whereas the scribe would produce one copy for one florin. This implies that the cost per book decreased 341 times with the introduction of the printing press.” As Max Roser’s summary suggests, 1025 copies / 3 florins per quinterno vs. 1 copy / 1 copy per quinterno is a 341-fold reduction in the cost.
Roser, Max. “Books.” Our World in Data. March 05, 2013. Accessed June 28, 2019. https://ourworldindata.org/books#the-publication-of-unique-booktitles-over-the-long-run. \")\n\n\n* A sharp decrease in the real price of books. One estimate of the real price of books in the Netherlands suggests a ~5-fold decrease between 1460 and 1550.[27](https://aiimpacts.org/historic-trends-in-book-production/#easy-footnote-bottom-27-1414 \"See this graph, Estimates of the real price of Dutch books, 1460-1800 (1460/74 = 100) – van Zanden (2009) with data originally found in Van Zanden, J. L. The Long Road to the Industrial Revolution: The European Economy in a Global Perspective, 1000-1800. Leiden: Brill, 2012. and republished in Our World in Data — Books. The graph shows an average price of ~between 100 and 120 in the 1460s and 70s moving down to an average price of around 20 by 1485, an approximately ~5-fold decrease in price.
Roser, Max. “Books.” Our World in Data. March 05, 2013. Accessed June 28, 2019. https://ourworldindata.org/books#prices-of-books-productivity-in-book-production. \")\n\n\n* An increase in genre-variety of books, and in particular a shift away from theological texts and an increase in the amount of fiction.[28](https://aiimpacts.org/historic-trends-in-book-production/#easy-footnote-bottom-28-1414 \"“Another fundamental change in the book market after the invention of the book press was a very strong increase in the variety of printed books available to the readers. Dittmar (2012) measures the subject content by employing techniques from machine learning to identify the topics of books in his sample of English books between the late 1400s and 1700. He can thereby identify a specified number of topics in his sample and track the changes in variety over time. He depicts the increased consumer choice by calculating the Herfindahl index of topic concentration – this is reprinted in Panel A of the figure below. Panel B shows how the number of effective variety of consumer choices grew sharply after 1500. The increasing variety represents the end of the dominating role of theological texts – Dittmar (2012) notes that ‘almost all books were on religious topics in the late 1400s […] The following pie chart gives an overview of the variety of book topics in London’s book market in 1700. Looking at the variety of books at that time – the end of Dittmar’s sample – makes one realize how dominant theological texts were before. The data source for this figure is the English Short Title Catalog or ESTC which is also one of the two sources of Dittmar. […] A subsequent change in the variety of topics was the rise of fiction literature. This marked change between the 17th and the 18th century is depicted below. From the table above we know that the total number of books published during this time did not change – in the 50 years before 1700 89,306,000 books were published in Great Britain; in the 50 years after 1700 it was 89,259,000.” From the “Increasing variation of genres and the rise of fiction literature” section in Roser, Max. “Books.” Our World in Data. March 05, 2013. Accessed June 28, 2019. https://ourworldindata.org/books#the-publication-of-unique-booktitles-over-the-long-run, referencing Dittmar, Jeremiah. “The Welfare Impact of a New Good: The Printed Book.” Unpublished draft. May 27, 2011. Accessed June 28, 2019.Dittmar (2012) – “The Welfare Impact of a New Good: The Printed Book” (2012). \")\n\n\n* An increase in the total consumption of books, likely as a result of their declining price and increased literacy levels.[29](https://aiimpacts.org/historic-trends-in-book-production/#easy-footnote-bottom-29-1414 \"See graph from Our World in Data — Books, “Consumption of Books” to see the sudden increase.
Roser, Max. “Books.” Our World in Data. March 05, 2013. Accessed June 28, 2019. https://ourworldindata.org/books#the-publication-of-unique-booktitles-over-the-long-run Roser notes that “The declining price of books and the increasing literacy led to an increase in the consumption of books, as can be seen in the following table.” The data used to produce this graph comes from estimates from Buringh and Van Zanden, who also produced the original estimates for manuscript and book production per century. We would guess that they are not particularly robust, but are likely robust enough to support the marked increase in book consumption.
Buringh, Eltjo, and Jan Luiten Van Zanden. “Charting the “Rise of the West”: Manuscripts and Printed Books in Europe, A Long-Term Perspective from the Sixth through Eighteenth Centuries.” The Journal of Economic History 69, no. 02 (2009): 409. doi:10.1017/s0022050709000837 \")\n\n\nMost of these changes are gradual over at least a century, rather than involving a sharp change that might be a large discontinuity. Such gradual changes might suggest a sharper change in some underlying technology though, for instance. The fall in the price of Dutch books was relatively abrupt, but the data lacks a trend leading up to the printing press.\n\n\nThe increases in the number of genres and unique titles published suggest that there was a larger amount of information available in printed form. Decreased prices and increased consumption of books suggests that this information was easier to access than before. These things suggest there might have been an interesting change in availability of information in general, however we do not know enough about the past trend to say whether this was likely to be discontinuous. \n\n\nNotes\n-----\n\n\n\n\n\n\n\n\n\n", "url": "https://aiimpacts.org/historic-trends-in-book-production/", "title": "Historic trends in book production", "source": "aiimpacts.org", "source_type": "wordpress", "date_published": "2020-02-08T01:56:44+00:00", "paged_url": "https://aiimpacts.org/feed?paged=9", "authors": ["Katja Grace"], "id": "f0af84324d7903219ce6fbf177c0bcfd", "summary": []}
{"text": "Historic trends in telecommunications performance\n\n*Published February 2020*\n\n\n*January 2023 note: This page contains errors that have not yet been corrected. Our overall conclusion, that there were likely no discontinuities in our metrics for telecommunications performance are likely unaffected by these errors.*\n\n\nThere do not appear to have been any greater than 10-year discontinuities in telecommunications performance, measured as: \n\n\n* bandwidth-distance product for all technologies 1840-2015\n* bandwidth-distance product for optical fiber 1975-2000\n* total bandwidth across the Atlantic 1956-2018\n\n\nRadio does not seem likely to have represented a discontinuity in message speed.\n\n\nDetails\n-------\n\n\nThis case study is part of AI Impacts’ [discontinuous progress investigation](https://aiimpacts.org/discontinuous-progress-investigation/).\n\n\n### Background\n\n\nFiber optic cables were first used for telecommunications in the 1970s and 80s.[1](https://aiimpacts.org/historic-trends-in-telecommunications-performance/#easy-footnote-bottom-1-1368 \"“If the attenuation could be lowered sufficiently, they theorized fiber optics could be used as a practical means of communication. The attenuation barrier was broken in 1970 … Within two decades, innovative research pushed the attenuation rate low enough for fiber optics to become the dominant carrier of electronic information.”
“History.” Fiber Optic Cable History – Fiber Optic Cables for the Telecommunications, Defense and Broadcast TV Industries – Tevelec Limited. Accessed April 19, 2019. https://www.tevelec.com/history. \") While previous telecommunications technology sent information via electricity, fiber optic cables instead sent information via light. Though electric signals travel at around 80% of the speed of light, while optical signals within a fiber only travel at roughly 70% of the speed of light, fiber optics have other benefits which add up to a considerable advantage.[2](https://aiimpacts.org/historic-trends-in-telecommunications-performance/#easy-footnote-bottom-2-1368 \" “Good cables achieve 80% of the speed of light; excellent cables achieve 90%.” “Speed of Light vs Speed of Electricity.” Physics Stack Exchange. Accessed April 19, 2019. https://physics.stackexchange.com/questions/358894/speed-of-light-vs-speed-of-electricity. For a summary of the many advantages fiber optics have over electric cables for communication, see
https://en.wikipedia.org/wiki/Optical_fiber#Uses \")\nFiber optic cable: laser light shining on one end comes out of the other.[3](https://aiimpacts.org/historic-trends-in-telecommunications-performance/#easy-footnote-bottom-3-1368 \"From Wikimedia Commons:
Hustvedt [CC BY-SA 3.0 (https://creativecommons.org/licenses/by-sa/3.0)] \")\n### Trends\n\n\nBandwidth-distance product, usually given in bits\\*kilometers/seconds, is both the most apparently relevant metric of progress in telecommunications[4](https://aiimpacts.org/historic-trends-in-telecommunications-performance/#easy-footnote-bottom-4-1368 \"“Because the effect of dispersion increases with the length of the fiber, a fiber transmission system is often characterized by its bandwidth–distance product, usually expressed in units of MHz·km. This value is a product of bandwidth and distance because there is a trade-off between the bandwidth of the signal and the distance over which it can be carried. ”
“Fiber-optic Communication.” Wikipedia. June 23, 2019. Accessed July 03, 2019. https://en.wikipedia.org/wiki/Fiber-optic_communication#Bandwidth–distance_product.\") [5](https://aiimpacts.org/historic-trends-in-telecommunications-performance/#easy-footnote-bottom-5-1368 \"“The term bandwidth–distance product (or bandwidth–length product) is often used in the context of optical fiber communications. … The concept of the bandwidth–distance product is helpful e.g. for comparing the performance of different types of fiber-optic links.” Paschotta, Rüdiger. “Bandwidth–distance Product.” RP Photonics Encyclopedia – Bandwidth-distance Product, Bandwidth-length Product. May 29, 2019. Accessed July 03, 2019. https://www.rp-photonics.com/bandwidth_distance_product.html. \"), and the one that was suggested to us as discontinuous. We also considered data transfer rate (measured in Mbps) for transatlantic cables, as a metric which more closely tracks the performance of cables that were actually in use, with the Atlantic serving as a distance constraint. We found separate data for bandwidth-distance product across all technologies, in fiber optics alone, and crossing the Atlantic, so we consider each of these metrics.\n\n\n#### Bandwidth-distance product across all technologies 1840-2015\n\n\n##### Data\n\n\nWe used a tool for extracting data from figures[6](https://aiimpacts.org/historic-trends-in-telecommunications-performance/#easy-footnote-bottom-6-1368 \"https://apps.automeris.io/wpd/\") to extract data from Figure 8.2 from Agrawal, 2016,[7](https://aiimpacts.org/historic-trends-in-telecommunications-performance/#easy-footnote-bottom-7-1368 \"Agrawal, Govind P. 2016. “Optical Communication: Its History And Recent Progress”. Optics In Our Time, 177-199. Springer International Publishing. doi:10.1007/978-3-319-31903-2_8., https://link.springer.com/chapter/10.1007/978-3-319-31903-2_8\") shown in Figure 1. We put the data into [this spreadsheet](https://docs.google.com/spreadsheets/d/15GZ8ElZnOqrl5dSO1L4mS924GwV3r4g8oe0SAoP8F1c/edit?usp=sharing). Figures 2 and 3 show this data without a trendline, and the log of the data on a log axis with a straight trendline. \n\n\nFigure 1 below shows progress in bandwidth-distance product across all technologies on a log scale.\n\n\n**Figure 1:** Growth in bandwidth-distance product across all telecommunications during 1840-2015 from Agrawal, 2016\n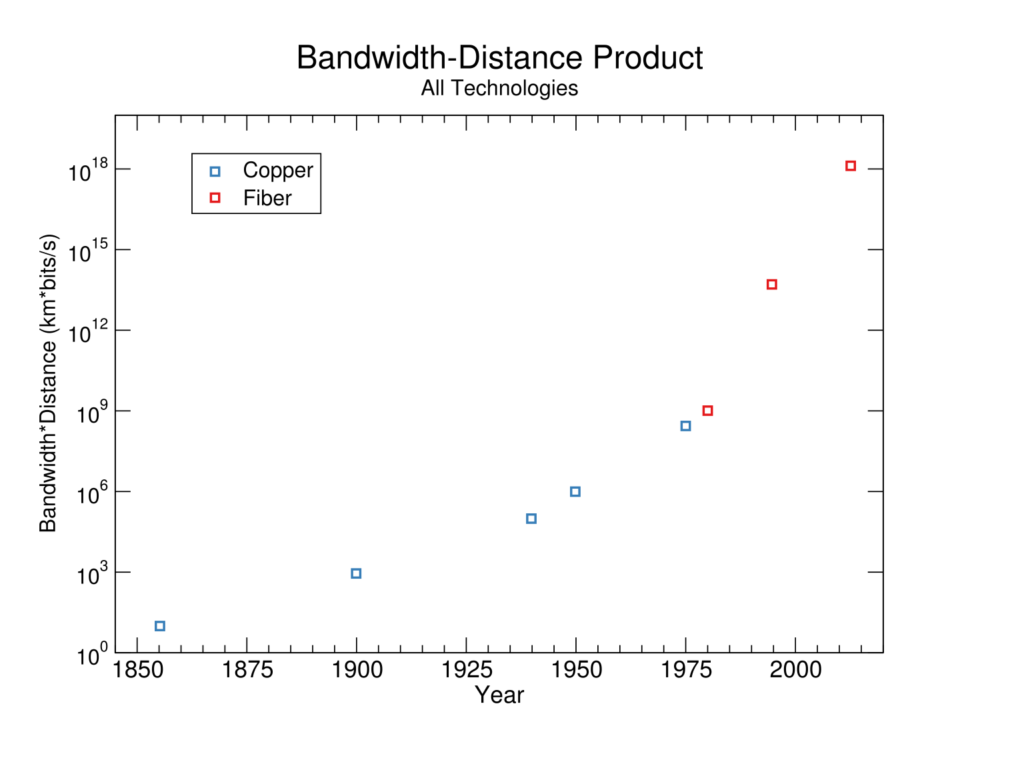Figure 2: Agrawal’s data, manually extracted, without trendline. \n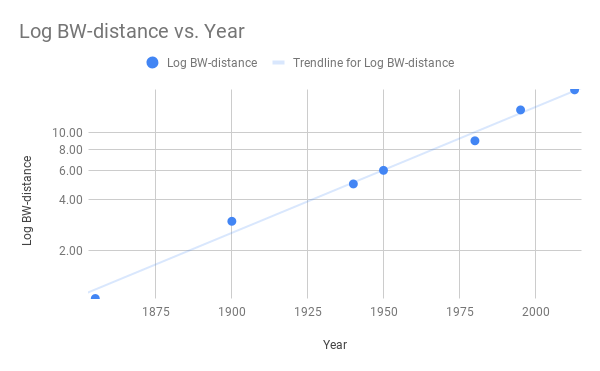Figure 3: Log of Agrawal’s data, shown on a log axis. The linear fit says that the data is well modeled as double exponential. \n##### Discontinuity measurement\n\n\nIf we treat the previous rate of progress at each point to be exponential (as Agrawal does, with two different regimes) then optical fibers appear to represent a 27 year discontinuity.[8](https://aiimpacts.org/historic-trends-in-telecommunications-performance/#easy-footnote-bottom-8-1368 \"See this spreadsheet for all calculations\") The following 2-3 developments are also substantial discontinuities, depending on whether one breaks the data into multiple trends. As shown in Figure 3 however, the log of the data fits an exponential trend well. If we extrapolate progress expecting the log to be exponential, there are no discontinuities of more than ten years in this data. This seems like the better fit, so we take it there are not discontinuities.\n\n\nArgawal’s data also does not include minor improvements on the broad types of systems mentioned, which presumably occurred. In particular, our impression is that there were better coaxial cables as well as worse optical fibers, such that the difference when fiber optics appeared was probably not more than a factor of two,[9](https://aiimpacts.org/historic-trends-in-telecommunications-performance/#easy-footnote-bottom-9-1368 \"From Wikipedia: “After a period of research starting from 1975, the first commercial fiber-optic communications system was developed which operated at a wavelength around 0.8 µm and used GaAs semiconductor lasers. This first-generation system operated at a bit rate of 45 Mbit/s with repeater spacing of up to 10 km.” “Fiber-optic Communication.” Wikipedia. June 23, 2019. Accessed July 03, 2019. https://en.wikipedia.org/wiki/Fiber-optic_communication#History. \") [10](https://aiimpacts.org/historic-trends-in-telecommunications-performance/#easy-footnote-bottom-10-1368 \"We think the most advanced coaxial system in place at the time operated at around 2.7×108 bits*km/s. From Optics In Our Time: “The most advanced coaxial system was put into service in 1975 and operated at a bit rate of 274 Mbit/s. A severe drawback of high-speed coaxial systems was their small repeater spacing (∼∼ 1 km)” Agrawal, Govind P. 2016. “Optical Communication: Its History And Recent Progress”. Optics In Our Time, 177-199. Springer International Publishing. doi:10.1007/978-3-319-31903-2_8. \") or about six years of exponential progress at the rate seemingly prevailing around the time of coaxial cables.[11](https://aiimpacts.org/historic-trends-in-telecommunications-performance/#easy-footnote-bottom-11-1368 \"According to Argawal’s figure, the metric improved by around a factor of 1.11 each year (see spreadsheet)\")\n#### Bandwidth-distance product in fiber optics alone 1975-2000\n\n\n##### Data\n\n\nWe used a [tool for extracting data from figures](https://apps.automeris.io/wpd/) to extract data from Figure 8.8 from [Agrawal, 2016](https://link.springer.com/chapter/10.1007/978-3-319-31903-2_8)[12](https://aiimpacts.org/historic-trends-in-telecommunications-performance/#easy-footnote-bottom-12-1368 \"Agrawal, Govind P. 2016. “Optical Communication: Its History And Recent Progress”. Optics In Our Time, 177-199. Springer International Publishing. doi:10.1007/978-3-319-31903-2_8.\") and put it into [this spreadsheet.](https://docs.google.com/spreadsheets/d/1llyg2RhmwDzn4jgkgWNDE2XSxOLq_17iF5dZj_H0ZIA/edit?usp=sharing)\n\n\nFigure 4 below shows bandwidth-distance product on a log scale in fiber optics alone, from Agrawal, 2016.\n\n\n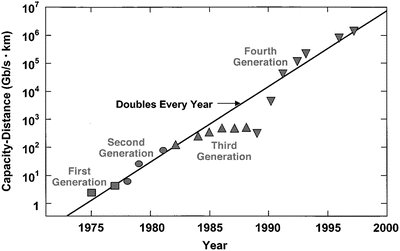Figure 4: \nProgress in bandwidth-distance product in fiber optics alone, from Agrawal, 2016 (Note: 1 Gb = 10^9 bits) \n##### Discontinuity measurement\n\n\nWe chose to model this data as a single exponential trend.[13](https://aiimpacts.org/historic-trends-in-telecommunications-performance/#easy-footnote-bottom-13-1368 \"See our methodology page for more details.\") Compared to previous rates in this trend, there are no greater than ten year discontinuities in bandwidth-distance product in fiber optics alone.[14](https://aiimpacts.org/historic-trends-in-telecommunications-performance/#easy-footnote-bottom-14-1368 \"See our methodology page page for more details, and our spreadsheet for our calculation.\")\n#### Bandwidth for Transatlantic Cables 1956-2018\n\n\n##### Data\n\n\nFigure 5 shows bandwidth of transatlantic cables according to [our own calculations](https://docs.google.com/spreadsheets/d/1r5ozE_8Y58ezZMGNzKZa81iwSvDkLXDs4vsA3wH-bR4/edit?usp=sharing), based on data we collected mainly from [Wikipedia](https://en.wikipedia.org/wiki/Transatlantic_communications_cable).[15](https://aiimpacts.org/historic-trends-in-telecommunications-performance/#easy-footnote-bottom-15-1368 \"Note that this is comparable to bandwidth-distance product, since the lengths of various cables across the Atlantic span a relatively small range.\")\n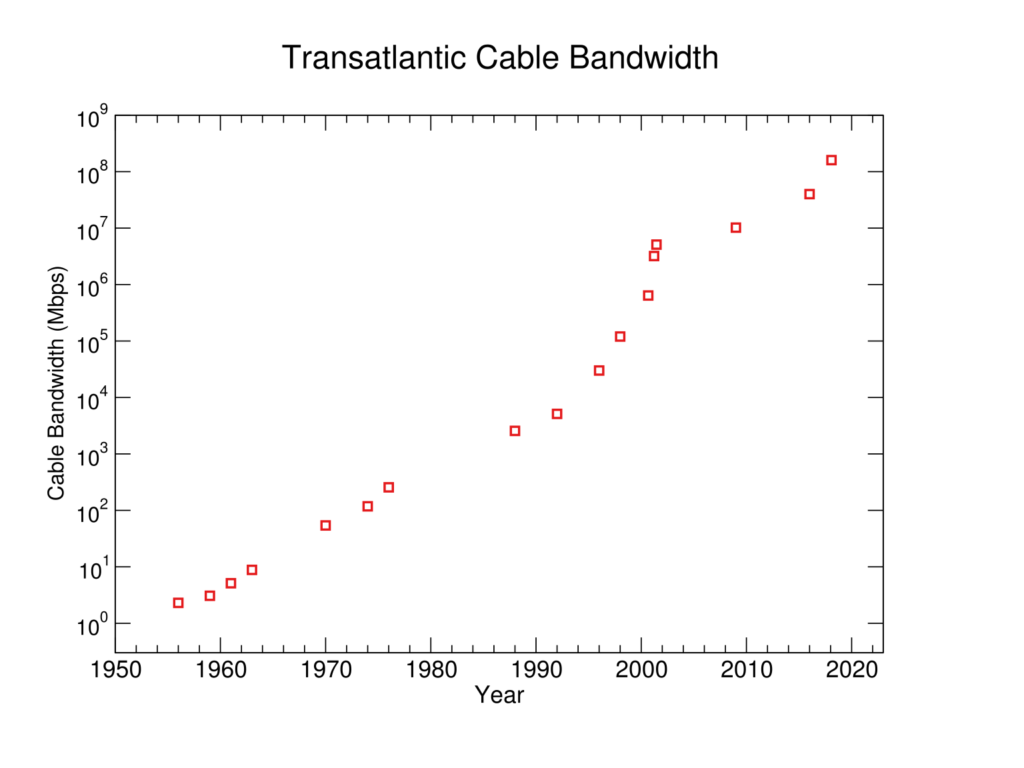Figure 5: Transatlantic cable bandwidth of all types. Pre-1980 cables were copper, post-1980 cables were optical fiber.\n##### Discontinuity measurement\n\n\nWe treat this data as a single exponential trend.[16](https://aiimpacts.org/historic-trends-in-telecommunications-performance/#easy-footnote-bottom-16-1368 \"See our methodology page for more details.\") The data did not contain any discontinuities of more than ten years.[18](https://aiimpacts.org/historic-trends-in-telecommunications-performance/#easy-footnote-bottom-18-1368 \"17See our methodology page for more details, and our spreadsheet for our calculation.\")\nThere was a notable temporary increase in the growth rate between 1996 and 2001. We speculate that this and the following 15 years of stagnation may be a result of heavy telecommunications investment during the [dot com bubble.](https://en.wikipedia.org/wiki/Dot-com_bubble)[19](https://aiimpacts.org/historic-trends-in-telecommunications-performance/#easy-footnote-bottom-19-1368 \"e.g. “During the late 1990s there was tremendous investment and entry of new firms in the North American long-haul telecommunications industry. These expansions were driven by very fast demand growth for Internet and other data-oriented telecom services and by exponential decreases in the cost per bit transmitted using fiber optic communications equipment. But by 2001, competition and slowing demand growth were squeezing the profits of these carriers, and an equally unprecedented slowdown in spending occurred. The problems in the telecommunications sector were blamed for slowing growth in the entire U.S. economy. As the expansion turned to bust, discussion of ‘‘excessive entry’’ and a ‘‘fiber glut’’ became increasingly common.” Hogendorn, Christiaan. “Excessive(?) Entry of National Telecom Networks, 1990-2001.” SSRN Electronic Journal, 2004. doi:10.2139/ssrn.584821. \")\nNotes\n-----\n\n\n\n\n\n\n\n\n\n\n\n\n\n", "url": "https://aiimpacts.org/historic-trends-in-telecommunications-performance/", "title": "Historic trends in telecommunications performance", "source": "aiimpacts.org", "source_type": "wordpress", "date_published": "2020-02-08T01:56:41+00:00", "paged_url": "https://aiimpacts.org/feed?paged=9", "authors": ["Katja Grace"], "id": "14db5906ae0ba62394d22414b633b822", "summary": []}
{"text": "Historic trends in slow light technology\n\n*Published Feb 7 2020*\n\n\nGroup index of light appears to have seen discontinuities of 22 years in 1995 from Coherent Population Trapping (CPT) and 37 years in 1999 from EIT (condensate). Pulse delay of light over a short distance may have had a large discontinuity in 1994 but our data is not good enough to judge. After 1994, pulse delay does not appear to have seen discontinuities of more than ten years. \n\n\nDetails\n-------\n\n\nThis case study is part of AI Impacts’ [discontinuous progress investigation](https://aiimpacts.org/discontinuous-progress-investigation/).\n\n\n### Background\n\n\nThat which is uncited on this page is our understanding, given familiarity with the topic.[1](https://aiimpacts.org/historic-trends-in-slow-light-technology/#easy-footnote-bottom-1-1315 \"Our primary researcher for this page, Rick Korzekwa, has a PhD in physics, with experience in experimental optical physics. In addition, Rick discussed the main ideas in this page with Professor Steve Harris, a researcher responsible for substantial progress on slow light. Prof. Harris has not looked over our conclusions, and any mistakes are Rick’s.\") \n\n\n“[Slow Light](https://en.wikipedia.org/wiki/Slow_light)” is a phenomenon where the speed at which a pulse of light propagates through a medium is greatly reduced. This has potential applications for lasers, communication, and cameras.[2](https://aiimpacts.org/historic-trends-in-slow-light-technology/#easy-footnote-bottom-2-1315 \"“In the future, slowing light could have a number of practical consequences, including the potential to send data, sound, and pictures in less space and with less power. Also, the results obtained by Hau’s experiment might be used to create new types of laser projection systems and night vision cameras with power requirements a million times less than what is presently possible.”
Cromie, William J., and William J. Cromie. “Physicists Slow Speed of Light.” Harvard Gazette. February 23, 2018. Accessed July 03, 2019. https://news.harvard.edu/gazette/story/1999/02/physicists-slow-speed-of-light/. \")\nThe speed of propagation of the light through the medium referred to as the ‘[group velocity](https://en.wikipedia.org/wiki/Group_velocity)‘ of the light, and it is a function of the medium’s [refractive index](https://en.wikipedia.org/wiki/Refractive_index) and [dispersion](https://en.wikipedia.org/wiki/Dispersion_(optics)) (the rate at which the refractive index changes with the frequency of the light).\n\n\nIn most materials—for instance glass, air, or water—the dispersion is low enough that the group velocity is simply the speed of light divided by the index of refraction. In order to slow down light by more than roughly a factor of 3, physicists needed to create optical media with a greater dispersion in the frequency range of interest. The challenge in this was doing so without the medium absorbing most of the light, since most materials exhibit maximum dispersion under conditions of high absorption. This was resolved using exotic phases of matter and sophisticated methods for inducing transparency in them.\n\n\n#### Summary of historic developments\n\n\nDiamonds have a very high index of refraction, and the ability to cut and polish them to achieve good optical quality has existed for hundreds of years[3](https://aiimpacts.org/historic-trends-in-slow-light-technology/#easy-footnote-bottom-3-1315 \"“The first “improvements” on nature’s design involved a simple polishing of the octahedral crystal faces to create even and unblemished facets, or to fashion the desired octahedral shape out of an otherwise unappealing piece of rough. This was called the point cut and dates from the mid 14th century; by 1375 there was a guild of diamond polishers at Nürnberg.” “Diamond Cut – Wikipedia.” Accessed October 25, 2019. https://en.wikipedia.org/wiki/Diamond_cut.\"). However there were no light sources available for studying low group velocities until the 1960s, so recorded progress begins then. The first pulsed sources of light that could reasonably be used for the investigation of slow light came about in 1962 with the invention of Q-switching, which is a method for generating series of short light pulses from a laser. We do not know whether early Q-switched lasers could be used for this work, but doubt that any earlier light sources were suitable.\n\n\nFollowing Q-switching, progress for slowing light proceeded roughly in four stages:\n\n\n1. **High index materials:** For instance, diamonds. There may have been marginally better materials, but we did not investigate because our understanding is that they should at most represent a few tens of a percent of difference, and later gains represent factors of millions to trillions.\n2. **High absorption media:** Materials with very low group velocity at a particular wavelength range, at the cost of very high absorption (losing >99% of the light over <100 microns).\n3. **Induced transparency:** Materials with a narrow window of transparency in spectral regions of low group velocity. This led to rapid increases in total delay of a pulse, both through longer propagation distance and lower speeds.\n4. **Stopped light:** Eventually, group velocity had been lowered to the point that it was possible to destroy the pulse, but store enough information in the medium about it to reconstruct it after some delay. There is room for debate about whether this is really the same pulse of light, however there are applications in which treating is as such is reasonable. We view this as progress in pulse delay, but not group index. After the invention of stopped light, slow light was no longer a major target for progress.\n\n\n### Trends\n\n\nThere are several metrics that one might plausibly be interested in in this area. Group velocity is a natural choice because it is simple, but it trades off against absorption. So it is relatively easy to make a medium that has a very low group velocity, but it will absorb too much light to be useful. Because of this, research was more plausibly aimed at some combination of low group velocity and low absorption.\n\n\nOne simple way to combine absorption and group velocity into a single metric is group velocity with an absorption criterion (say, lowest group velocity in a medium that transmits at least 1% of the light). Another is total time delay of the pulse by the medium, since longer delays can be achieved either by slowing down the pulse more, or slowing it down over a longer distance (requiring lower absorption). Pulse delay seems to have been a goal for researchers, suggesting it tracks something important, making it more interesting from our perspective.\n\n\nWe chose to investigate pulse delay and group index (the speed of light divided by the group velocity).[4](https://aiimpacts.org/historic-trends-in-slow-light-technology/#easy-footnote-bottom-4-1315 \"For more on our methodology, see our methodology page.\")\n#### Pulse delay and group index\n\n\n##### Data\n\n\nWe collected data from a variety of online sources into [this spreadsheet](https://docs.google.com/spreadsheets/d/1rtAbkBsR5Jo-f7zvloi4fepxErZKpMOVoVe495F1TfM/edit?usp=sharing). The sheet shows progress in pulse delay and group index over time as well as our source for each data point, and calculates unexpected progress at each step. Figures 1-3 illustrates these trends.\n\n\n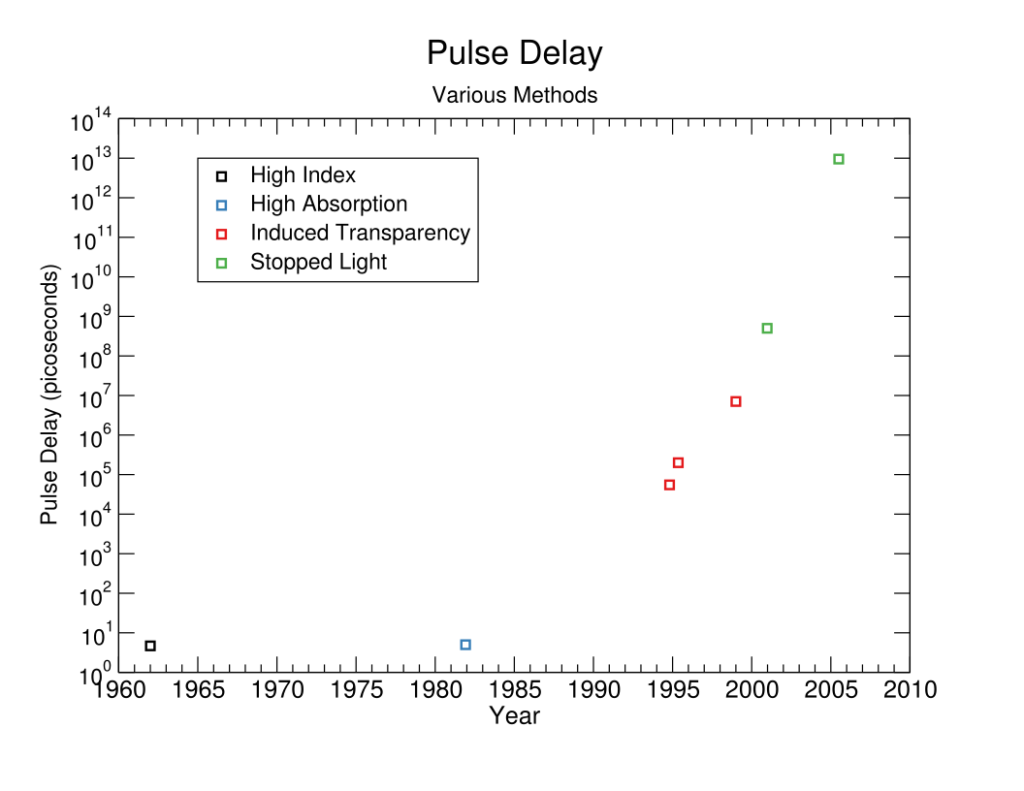**Figure 1:** Progress in delay of a pulse of light over a short distance\n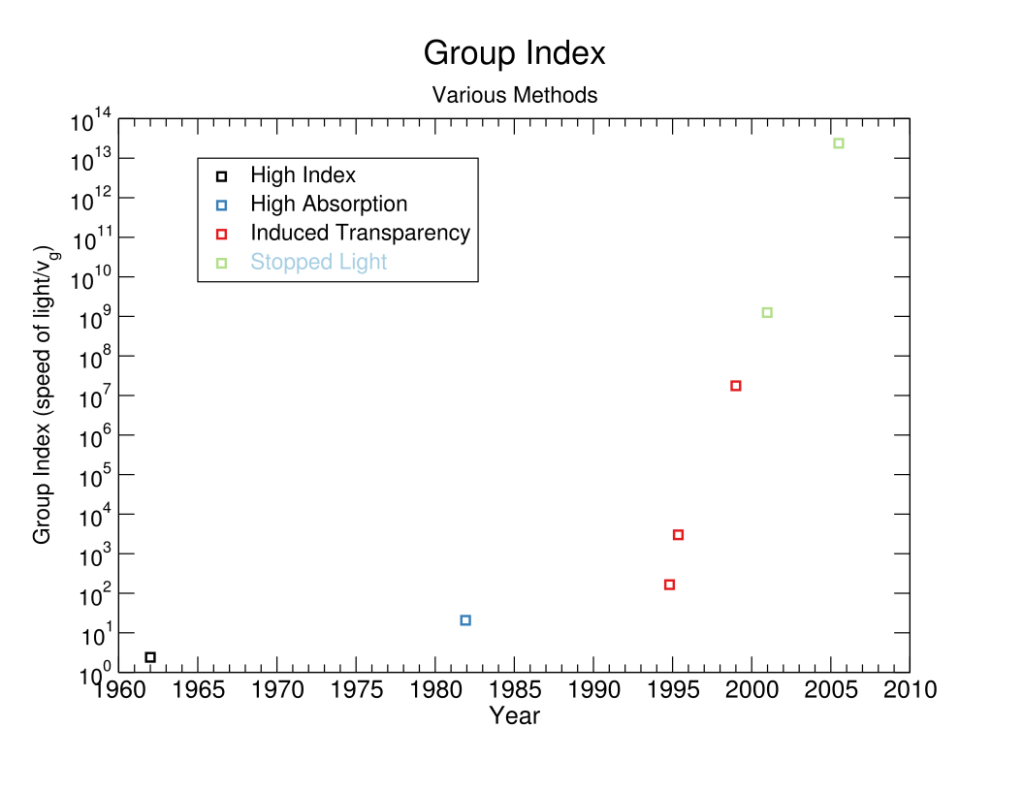 **Figure 2:** Progress in group index of a material (speed of light divided by speed of light in that material) \n[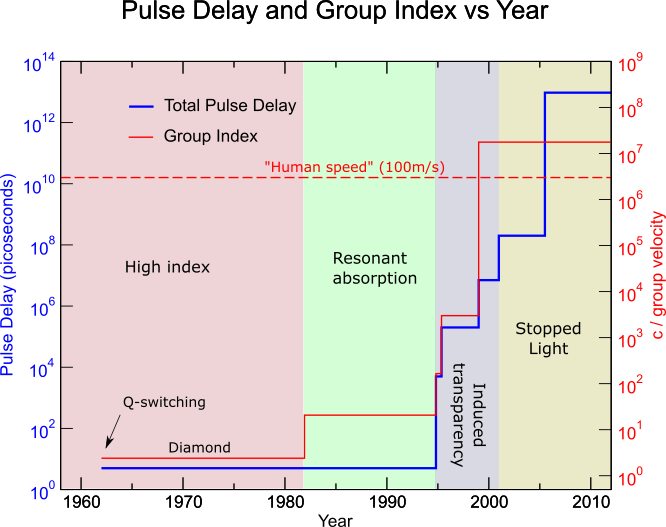](http://aiimpacts.org/wp-content/uploads/2019/03/DelayngData4.png)**Figure 3:** Progress in pulse delay and group index. “Human speed” shows the rough scale of motion familiar to humans.\n##### Discontinuity measurement\n\n\nFor comparing points to ‘past rates of progress’ we treat past progress for both pulse delay and group index as exponential, changing to a new exponential regime near 1995 in both cases.[5](https://aiimpacts.org/historic-trends-in-slow-light-technology/#easy-footnote-bottom-5-1315 \"See our methodology page for further explanation of how we measure discontinuities. See our spreadsheet for calculations.\") \n\n\nCompared to these rates of past progress, the 1994 point—EIT (hot gas)—could be a very large discontinuity in pulse delay, if there was a small amount of progress prior to it. There probably was, however our estimates of the points leading up to it are so uncertain that it isn’t clear that there was any well-defined progress, and if there was we have not measured it. So we do not attempt to judge whether there is a discontinuity there. Aside from that, pulse delay saw no discontinuities of more than ten years.\n\n\nGroup index has discontinuities of 22 years in 1995 from CPT and 37 years in 1999 from EIT (condensate). \n\n\nIn addition to the size of these discontinuities in years, we have tabulated a number of other potentially relevant metrics [here](https://docs.google.com/spreadsheets/d/1iMIZ57Ka9-ZYednnGeonC-NqwGC7dKiHN9S-TAxfVdQ/edit?usp=sharing).[6](https://aiimpacts.org/historic-trends-in-slow-light-technology/#easy-footnote-bottom-6-1315 \"See our methodology page for more details.\")\n##### Discussion of causes\n\n\nThese trends are short and not characterized by a clearly established rate prior to any potential change of rate, making changes in apparent rate relatively unsurprising. This means they are both less in need of explanation, and less informative about what to expect in cases where a technology does have a better-established progress trend.\n\n\nIncreasing group index of light does not appear to have been a major research goal prior to the discovery of induced transparency in the mid 1990s. Most of the work up to that point (and, to a lesser, extent after) was directed toward controlling the properties of optical media in general, with group index as one particularly salient parameter that could be controlled, but perhaps at the expense of others. Thus the moderate discontinuities in group index might relate to the hypothesized pattern of metrics that receive ongoing concerted effort tending to be more continuous than those receiving weak or sporadic attention.\n\n\n*Primary author: Rick Korzekwa*\n\n\n*Thanks to Stephen Jordan for suggesting slow light as a potential area of discontinuity.*\n\n\nNotes\n-----\n\n\n\n\n\n\n\n", "url": "https://aiimpacts.org/historic-trends-in-slow-light-technology/", "title": "Historic trends in slow light technology", "source": "aiimpacts.org", "source_type": "wordpress", "date_published": "2020-02-08T01:56:25+00:00", "paged_url": "https://aiimpacts.org/feed?paged=9", "authors": ["Katja Grace"], "id": "d2ecf222603a6d9fe54fa0e7dcb56aa6", "summary": []}
{"text": "Penicillin and historic syphilis trends\n\nPenicillin did not precipitate a discontinuity of more than ten years in deaths from syphilis in the US. Nor were there other discontinuities in that trend between 1916 and 2015.\n\n\nThe number of syphilis cases in the US also saw steep decline but no substantial discontinuity between 1941 and 2008.\n\n\nOn brief investigation, the effectiveness of syphilis treatment and inclusive costs of syphilis treatment do not appear to have seen large discontinuities with penicillin, but we have not investigated either thoroughly enough to be confident.\n\n\nDetails\n-------\n\n\nThis case study is part of AI Impacts’ [discontinuous progress investigation](https://aiimpacts.org/discontinuous-progress-investigation/).\n\n\n### Background\n\n\nPenicillin was first used to treat a patient in 1941[1](https://aiimpacts.org/penicillin-and-historic-syphilis-trends/#easy-footnote-bottom-1-1603 \"“In 1940, Florey carried out vital experiments, showing that penicillin could protect mice against infection from deadly Streptococci. Then, on February 12, 1941, a 43-year old policeman, Albert Alexander, became the first recipient of the Oxford penicillin.”
American Chemical Society. “Alexander Fleming Discovery and Development of Penicillin – Landmark.” Accessed January 15, 2020. https://www.acs.org/content/acs/en/education/whatischemistry/landmarks/flemingpenicillin.html.\") and became mass-produced in the US between 1942 and 1944.[2](https://aiimpacts.org/penicillin-and-historic-syphilis-trends/#easy-footnote-bottom-2-1603 \"“On March 14, 1942, the first patient was treated for streptococcal sepsis with US-made penicillin produced by Merck & Co.[38] Half of the total supply produced at the time was used on that one patient, Anne Miller.[39] By June 1942, just enough US penicillin was available to treat ten patients.[40] In July 1943, the War Production Board drew up a plan for the mass distribution of penicillin stocks to Allied troops fighting in Europe.[41] The results of fermentation research on corn steep liquor at the Northern Regional Research Laboratory at Peoria, Illinois, allowed the United States to produce 2.3 million doses in time for the invasion of Normandy in the spring of 1944…As a direct result of the war and the War Production Board, by June 1945, over 646 billion units per year were being produced.” “Penicillin,” in Wikipedia, May 23, 2019, https://en.wikipedia.org/w/index.php?title=Penicillin&oldid=898359231.\") It quickly became the preferred treatment for syphilis, and appears to be generally credited with producing a steep decline in the prevalence of syphilis which was seen at around that time.[3](https://aiimpacts.org/penicillin-and-historic-syphilis-trends/#easy-footnote-bottom-3-1603 \"e.g. “Within years, widespread use of penicillin for treatment of all stages of syphilis (primary, secondary, tertiary, latent) resulted in dramatic decreases in the incidence of syphilis and associated mortality.”
John M. Douglas, “Penicillin Treatment of Syphilis,” JAMA 301, no. 7 (February 18, 2009): 769–71, https://doi.org/10.1001/jama.2009.143.\") [4](https://aiimpacts.org/penicillin-and-historic-syphilis-trends/#easy-footnote-bottom-4-1603 \"“Today, with the dawn of the space-age, there are few who would disagree with the remark of Professor Smelov (1956) at the First International Symposium on Venereal Diseases and Treponematoses in Washington, D.C., U.S.A., that “hardly any one doubts the curative power of penicillin against
syphilis”, or the opinion of Kinaqigil (1956) of Turkey expressed at the same meeting that penicillin is preferable to all other drugs in this condition. Since Mahoney and his colleagues first used this new antibiotic in the treatment of syphilis (Mahoney, Arnold, and Harris, 1943a, b, 1949), 18 years have passed and little has occurred to shake the faith of
many thousands of doctors and of millions of patients in the potency of penicillin in this serious disease (see Doliken, 1954; Danbolt, 1954; Perdrup, Heilesen, and Sylvest, 1954; Shafer, Usilton, and Price, 1954) (Table I). Indeed, no other testimonial is required than the striking fall in the incidence of early syphilis which has occurred throughout the world.”
R. R. Willcox, “Treatment of Early Venereal Syphilis with Antibiotics*,” British Journal of Venereal Diseases 38, no. 3 (September 1962): 109–25.
\")\nFigure 1: US World War II Poster[5](https://aiimpacts.org/penicillin-and-historic-syphilis-trends/#easy-footnote-bottom-5-1603 \"From Wikimedia Commons: Science History Institute [Public domain]\")\n### Trends\n\n\nWe consider four metrics of success in treating syphilis: the number of syphilis cases, the number of syphilis deaths, effectiveness of syphilis treatment, and the inclusive cost of treatment.\n\n\nIn addition to the size of any discontinuities in years, we tabulated a number of other potentially relevant statistics for each metric [here](https://docs.google.com/spreadsheets/d/1iMIZ57Ka9-ZYednnGeonC-NqwGC7dKiHN9S-TAxfVdQ/edit?usp=sharing).\n\n\n\n\n#### US Syphilis cases\n\n\n##### Data\n\n\nFigure 1 shows historic reported syphilis cases after 1941, according to the CDC.[6](https://aiimpacts.org/penicillin-and-historic-syphilis-trends/#easy-footnote-bottom-6-1603 \"Figure 1 is Figure 33 from Division of STD Prevention, “Sexually Transmitted Disease Surveillance 2009,” November 2010, https://web.archive.org/web/20170120091355/https://www.cdc.gov/std/stats09/surv2009-Complete.pdf.\") We converted the data in the figure into [this spreadsheet](https://docs.google.com/spreadsheets/d/1Kw068YXCXAajeuoOpPq81YR_jLVYAf9jM5---ubl48Y/edit?usp=sharing).[7](https://aiimpacts.org/penicillin-and-historic-syphilis-trends/#easy-footnote-bottom-7-1603 \"We used an automatic figure data extraction tool to extract the data from the figure. Here is a link to a .tar file that can be loaded into this tool to reproduce our extraction.\")\n[](http://aiimpacts.wpengine.com/wp-content/uploads/2015/01/SyphilisUS2009.gif)\nFigure 1: Syphilis—Reported Cases by Stage of Infection, United States, 1941–2009, according to the CDC[8](https://aiimpacts.org/penicillin-and-historic-syphilis-trends/#easy-footnote-bottom-8-1603 \"From Figure 33 in Division of STD Prevention, “Sexually Transmitted Disease Surveillance 2009,” November 2010, https://web.archive.org/web/20170120091355/https://www.cdc.gov/std/stats09/surv2009-Complete.pdf.\")\n##### Discontinuity Measurement\n\n\nAccording to this data, total cases of syphilis declined by around 80% over fifteen years (see Figure 1). We do not see any substantial discontinuities, with 1944 seeing the largest change, equal to only 4 years of progress at the previous rate. Unfortunately, we were unable to find quantitative data prior to 1941, so we were only able to track progress for the three years leading up to the mass production of penicillin.\n\n\nFrom our perspective, progress by 1943 may already have been affected by availability of penicillin that we do not know about, in which case we have no earlier trend to go by. However we note that the scale of annual reductions following penicillin is not larger than the increase seen in 1943, and not vastly larger than later annual variations, so the largest abrupt decrease from penicillin seems unlikely to have been large compared to the usual scale of variation.\n\n\n#### US Deaths from syphilis\n\n\n##### Data\n\n\nWe collected data from two graphs of historical US syphilis deaths and put it in [this spreadsheet](https://docs.google.com/spreadsheets/d/10ASOiR65QzaOnaX44CB-i8bGfEn5EiRkD5NLP2IjvGQ/edit?usp=sharing). The first is shown in Figure 2, and comes from Armstrong et al.’s 1999 report on infectious disease mortality in the United States.[9](https://aiimpacts.org/penicillin-and-historic-syphilis-trends/#easy-footnote-bottom-9-1603 \"Table 4D in Gregory L. Armstrong, Laura A. Conn, and Robert W. Pinner, “Trends in Infectious Disease Mortality in the United States During the 20th Century,” JAMA 281, no. 1 (January 6, 1999): 61–66, https://doi.org/10.1001/jama.281.1.61.\") The authors collected it from historical mortality and population data from the CDC and public use mortality data tapes.[10](https://aiimpacts.org/penicillin-and-historic-syphilis-trends/#easy-footnote-bottom-10-1603 \"“Data were obtained from yearly tabulations of causes of death on file at the Division of Vital Statistics of the Centers for Disease Control and Prevention’s National Center for Health Statistics and from public use mortality data tapes from 1962 through 1996. … Population data used in the calculation of mortality rates were also obtained from the National Center for Health Statistics. The data for years prior to 1933 included only the population of the death-registration states or death-registration area, corresponding to the scope of the mortality data being used.” – Armstrong, Gregory L. 1999. “Trends In Infectious Disease Mortality In The United States During The 20Th Century”. JAMA 281 (1): 61. American Medical Association (AMA). doi:10.1001/jama.281.1.61.\") We used an automatic figure data extraction tool to extract data from the figure.[11](https://aiimpacts.org/penicillin-and-historic-syphilis-trends/#easy-footnote-bottom-11-1603 \"The tool was at https://apps.automeris.io/wpd/. We also extracted data between 1917 and 1967 manually using the same tool. Here is a link to a .tar file that can be loaded into the tool here to reproduce our extraction.\") Mortality rates after the mid-60s are indistinguishable from zero in this figure, so we do not include them. Instead we include records of total US deaths from Peterman & Kidd, 2019[12](https://aiimpacts.org/penicillin-and-historic-syphilis-trends/#easy-footnote-bottom-12-1603 \"Peterman, Thomas A., and Sarah E. Kidd. “Trends in Deaths Due to Syphilis, United States, 1968-2015.” Sexually Transmitted Diseases 46, no. 1 (2019): 37–40. https://doi.org/10.1097/OLQ.0000000000000899.\"), which we combine with US population data to get mortality rates between 1957 and 2015.\n\n\n[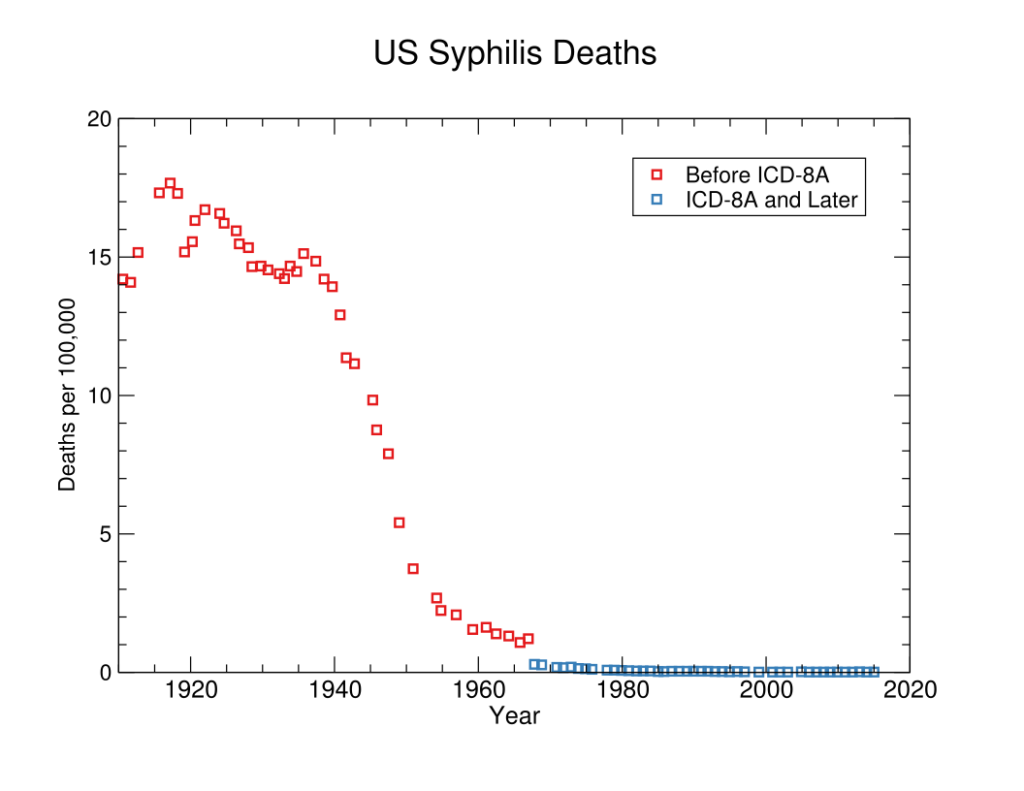](http://aiimpacts.wpengine.com/wp-content/uploads/2015/01/syphilis.png)\nFigure 2: Syphilis mortality rate in the US during the 20th century.[13](https://aiimpacts.org/penicillin-and-historic-syphilis-trends/#easy-footnote-bottom-13-1603 \"See Figure 4D in Gregory L. Armstrong, Laura A. Conn, and Robert W. Pinner, “Trends in Infectious Disease Mortality in the United States During the 20th Century,” JAMA 281, no. 1 (January 6, 1999): 61–66, https://doi.org/10.1001/jama.281.1.61.\")\n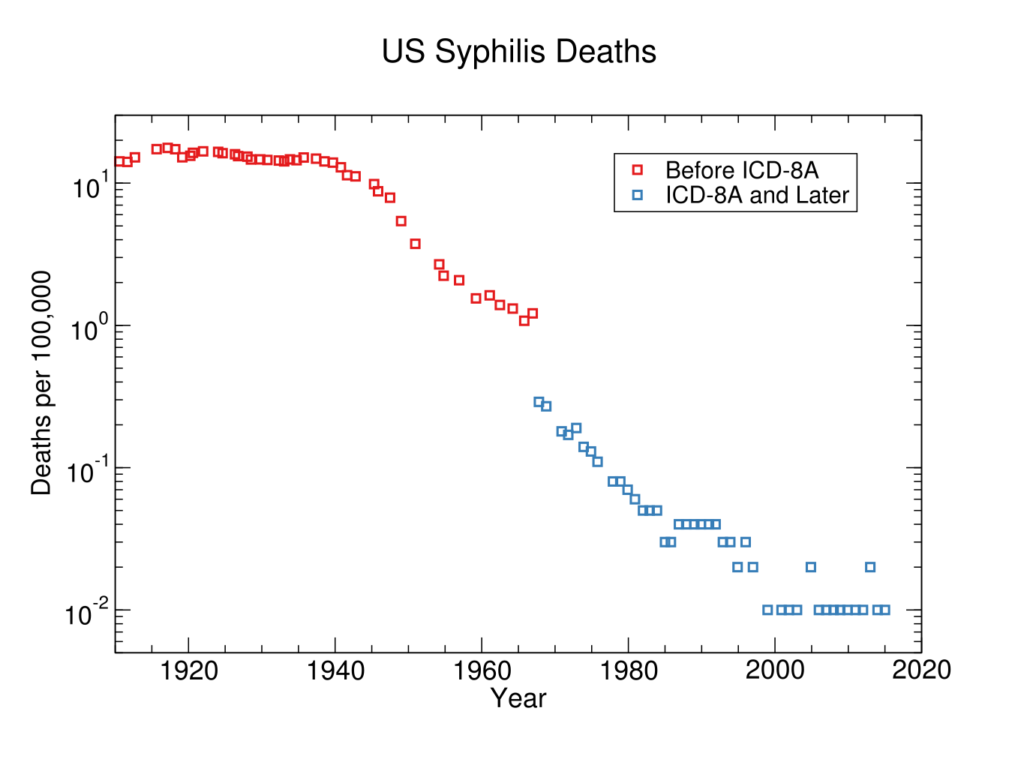Figure 3: Syphilis mortality rate in the US during the 20th century, plotted on a log scale\n##### Discontinuity Measurement\n\n\nWe calculate discontinuities in [our spreadsheet](https://docs.google.com/spreadsheets/d/10ASOiR65QzaOnaX44CB-i8bGfEn5EiRkD5NLP2IjvGQ/edit?usp=sharing), according to [this methodology](https://aiimpacts.org/methodology-for-discontinuity-investigation/#changes-in-the-rate-of-progress). There were no substantial discontinuities in progress for reducing syphilis deaths in the US during the time for which we have data. The largest positive deviation from a previous trend was a drop representing five years of progress in around 1940, two years before even enough ‘US penicillin’ was available to treat ten people.[14](https://aiimpacts.org/penicillin-and-historic-syphilis-trends/#easy-footnote-bottom-14-1603 \"“On March 14, 1942, the first patient was treated for streptococcal sepsis with US-made penicillin produced by Merck & Co.[38] Half of the total supply produced at the time was used on that one patient, Anne Miller.[39] By June 1942, just enough US penicillin was available to treat ten patients.[40]” “Penicillin,” in Wikipedia, May 23, 2019, https://en.wikipedia.org/w/index.php?title=Penicillin&oldid=898359231.\")\nIn sum, while deaths from syphilis rapidly declined around the 1940s, this progress was not discontinuous at the scale of years. And while penicillin seems likely to have helped in this decline, it did not yet exist to contribute to the most discontinuously fast progress in that trend (and that progress was still not rapid enough to count as a substantial discontinuity for this project).\n\n\n##### Discussion of causes\n\n\nThe decline of syphilis mortality does not appear to be entirely from penicillin, since it is underway by 1940, just prior to the mass-production of penicillin. This is strange, so it is plausible that we misunderstand some aspect of the situation.\n\n\nThe only other factor we know about is US Surgeon General Thomas Parran’s launch of a national syphilis control campaign in 1938.[15](https://aiimpacts.org/penicillin-and-historic-syphilis-trends/#easy-footnote-bottom-15-1603 \"“The serious consequences of syphilis for the population led to its designation as the “shadow on the land” and prompted US Surgeon General Thomas Parran to launch a national syphilis control campaign in 1938 based on public education, serologic testing, treatment, and a national network of sexually transmitted disease (STD) clinics.”
Douglas, John M. “Penicillin Treatment of Syphilis.” JAMA 301, no. 7 (February 18, 2009): 769–71. https://doi.org/10.1001/jama.2009.143.\") Wikipedia also attributes some of the syphilis decline over the 19th and 20th centuries to decreasing virulence of the spirochete, but we don’t know of any reason for that to especially coincide with the 1940s decline.[16](https://aiimpacts.org/penicillin-and-historic-syphilis-trends/#easy-footnote-bottom-16-1603 \"“The symptoms of syphilis have become less severe over the 19th and 20th century in part due to widespread availability of effective treatment and partly due to decreasing virulence of the spirochete.[7]“
“Epidemiology of Syphilis.” In Wikipedia, February 9, 2019. https://en.wikipedia.org/w/index.php?title=Epidemiology_of_syphilis&oldid=882541706. \")\n#### Effectiveness at treating syphilis\n\n\nEven if penicillin’s effect on the US death rate from syphilis was gradual, we might expect this to be due to frictions like institutional inertia, rather than from gradual progress in the underlying technology. It might still be that penicillin was a radically better drug than its predecessors, when applied.\n\n\nWe briefly investigated whether penicillin might have represented discontinuous progress in effectiveness at curing syphilis, and conclude that it probably did not, because it does not appear to have been clearly better than its predecessor in terms of cure rates. In a 1962 review of treatment of ‘early’ syphilis[17](https://aiimpacts.org/penicillin-and-historic-syphilis-trends/#easy-footnote-bottom-17-1603 \"‘Early syphilis’ is defined as follows in Willcox: “seri-negative primary syphilis, zero-positive primary syphilis, secondary syphilis, and early latent syphilis in the first year of infection (although in the U.S.A. the first four years are taken).”\"), Willcox writes that ‘a seronegativity-rate of 85 per cent. at 11 months had been achieved’ in 1944 after penicillin became the primary treatment for syphilis, but also says that the previously common treatment—arsenic and bismuth—was successful in more than 90% of cases in which it was carried out.[18](https://aiimpacts.org/penicillin-and-historic-syphilis-trends/#easy-footnote-bottom-18-1603 \"“Before the discovery of penicillin, reliance had had to be placed on arsenic and bismuth therapy given over periods of approximately one year. The reported results for those patients who completed their treatment (see, for example, Burckhardt, 1949; Degos, Vissian, and Basset, 1950; Thompson and Smith, 1950; Arutyunov and Gurvich, 1958) in large series of cases were good and cure rates exceeding 90 per cent. were reported…
…As soon as it became available, penicillin was soon in use for the treatment of syphilis throughout the world…
…As early as 1946 it became apparent in the U.S.A. that the results were deteriorating. Before May, 1944, a seronegativity-rate of 85 per cent. at 11 months had been achieved, but after that time the figure had fallen to only 60 per cent.”
Willcox, R. R. “Treatment of Early Venereal Syphilis with Antibiotics*.” British Journal of Venereal Diseases 38, no. 3 (September 1962): 109–25. \")\nWillcox explains that the major downsides of the earlier treatment were very high defection rates (with perhaps as few as a quarter of patients completing the treatment), and ‘serious toxic effects’.[19](https://aiimpacts.org/penicillin-and-historic-syphilis-trends/#easy-footnote-bottom-19-1603 \"One of the two great disadvantages of metal-therapy was that, because of the relatively weak treponemicidal powers of the drugs employed, prolonged treatment involving many injections was required, and default from treatment, and therefore absence of cure in those who defaulted, was very common. Indeed, a minimum curative dose might be received by only one quarter of the patients (Chope and Malcolm, 1948). The other disadvantage was the risk of serious toxic effects, which not only curtailed treatment in affected patients but, by reputation, encouraged other patients to default.”
Willcox, R. R. “Treatment of Early Venereal Syphilis with Antibiotics*.” British Journal of Venereal Diseases 38, no. 3 (September 1962): 109–25. \") We have not checked that exactly the same notion of success is being used in these figures, have not assessed the reliability of this source, and do not know how important treatment for ‘early’ syphilis is relative to treatment for all syphilis, so it could still be that penicillin was a more effective treatment overall. However we did not investigate this further.\n\n\n#### Inclusive costs of treatment\n\n\nPenicillin apparently allowed most patients to receive a curative dose of medicine, whereas ‘arsenic and bismuth therapy’ achieved this for perhaps as few as a quarter of patients.[20](https://aiimpacts.org/penicillin-and-historic-syphilis-trends/#easy-footnote-bottom-20-1603 \"“The out-patient therapy of early syphilis became feasible only with the introduction by Romansky and Rittman (1945) of penicillin in oil-beeswax…by such means, nearly all patients could now achieve a curative dose (Hayman, 1947, Aitken, 1947) instead of only about one-quarter as with arsenic and bismuth (Chope and Malcolm, 1948).”
Willcox, R. R. “Treatment of Early Venereal Syphilis with Antibiotics*.” British Journal of Venereal Diseases 38, no. 3 (September 1962): 109–25.\") If penicillin made an abrupt difference to syphilis treatment then, it seems likely to have been in terms of inclusive costs (which were partly reflected in willingness to be treated).\n\n\nQualitatively, the costs of treatment do seem to have been much lower. The time for treatment dropped from a year to around eight days.[21](https://aiimpacts.org/penicillin-and-historic-syphilis-trends/#easy-footnote-bottom-21-1603 \"“Before the discovery of penicillin, reliance had had to be placed on arsenic and bismuth therapy given over periods of approximately one year…
…The use of sixty or more injections of crystalline penicillin G in aqueous solution within a period of 7 1/2 days, if not more than the patients could reasonably tolerate, required their admission to hospital…Good results were reported with eight daily injections of 600,000 units…and success rates of 80 to 85 per cent. were achieved…”
R. R. Willcox, “Treatment of Early Venereal Syphilis with Antibiotics*,” British Journal of Venereal Diseases 38, no. 3 (September 1962): 109–25.
“In 1943 penicillin was introduced as a treatment for syphilis by John Mahoney, Richard Arnold and AD Harris. [22] Mahoney and his colleagues at the US Marine Hospital, Staten Island, treated four patients with primary syphilis chancres with intramuscular injections of penicillin four-hourly for eight days for a total of 1,200,000 units by which time the syphilis had been cured. “
John Frith, “Syphilis – Its Early History and Treatment until Penicillin and the Debate on Its Origins,” Journal of Military and Veterans’ Health 20 (November 1, 2012): 49–58.\") Our impression is that the side effects qualitatively reduced from horrible and sometimes deadly to apparently bearable.\n\n\nHowever even if penicillin was a large improvement over its predecessors in absolute terms (which seems likely), it would be hard to make a clear case that it was large relative to previous progress in syphilis treatments, because recent progress was also incredible.\n\n\nThe ‘arsenic and bismuth therapy’ mentioned above, that preceded penicillin, seems to have been a combination of the arsenic-based drug salvarsan (arsphenamine) and similar drugs developed subsequently, with bismuth. [22](https://aiimpacts.org/penicillin-and-historic-syphilis-trends/#easy-footnote-bottom-22-1603 \"“Arsenicals, mainly arsphenamine, neoarsphenamine, acetarsone and mapharside, in combination with bismuth or mercury then became the mainstay of treatment for syphilis until the advent of penicillin in 1943.”
\n\n\n\nFrith, John. “Syphilis – Its Early History and Treatment until Penicillin and the Debate on Its Origins.” Journal of Military and Veterans’ Health 20 (November 1, 2012): 49–58.\") Salvarsan (arsphenamine) was considered such radical improvement over its own predecessors that it was known as the ‘magic bullet’, and won its discoverer Paul Erhlich a Nobel prize.[23](https://aiimpacts.org/penicillin-and-historic-syphilis-trends/#easy-footnote-bottom-23-1603 \"This led in 1910 to the manufacture of arsphenamine, which subsequently became known as Salvarsan, or the “magic bullet”, and later in 1912, neoarsphenamine, Neo-salvarsan, or drug “914”. In 1908 Ehrlich was awarded the Nobel Prize for his discovery. [7, 11, 12]”
John Frith, “Syphilis – Its Early History and Treatment until Penicillin and the Debate on Its Origins,” Journal of Military and Veterans’ Health 20 (November 1, 2012): 49–58.\") A physician at the time describes[24](https://aiimpacts.org/penicillin-and-historic-syphilis-trends/#easy-footnote-bottom-24-1603 \"John Frith, “Syphilis – Its Early History and Treatment until Penicillin and the Debate on Its Origins,” Journal of Military and Veterans’ Health 20 (November 1, 2012): 49–58.\"):\n\n\n\n> \n> “Arsenobenzol, designated “606,” whatever the future may bring to justify the present enthusiasm, is now actually a more or less incredible advance in the treatment of syphilis and in many ways is superior to the old mercury – as valuable as this will continue to be – because of its eminently powerful and eminently rapid spirochaeticidal property.”\n> \n> \n> \n\n\nIt is easy to see how salvarsan could be hugely costly to take, yet still represent large progress over earlier options, when we note that the common treatment prior to salvarsan was mercury,[25](https://aiimpacts.org/penicillin-and-historic-syphilis-trends/#easy-footnote-bottom-25-1603 \"“Mercury stayed in favour as treatment for syphilis until 1910 when Ehrlich discovered the anti-syphilitic effects of arsenic and developed Salvarsan, popularly called the “magic bullet”.”
Frith, John. “Syphilis – Its Early History and Treatment until Penicillin and the Debate on Its Origins.” Journal of Military and Veterans’ Health 20 (November 1, 2012): 49–58.\") which had ‘terrible side effects’ including the death of many patients, characteristically took years, and was not obviously helpful.[26](https://aiimpacts.org/penicillin-and-historic-syphilis-trends/#easy-footnote-bottom-26-1603 \"“Many physicians doubted the efficacy of mercury, especially as it had terrible side effects and many patients died of mercury poisoning. Beck (1997) describes a typical mercury treatment :
“A patient undergoing the treatment was secluded in a hot, stuffy room, and rubbed vigorously with the mercury ointment several times a day. The massaging was done near a hot fire, which the sufferer was then left next to in order to sweat. This process went on for a week to a month or more, and would later be repeated if the disease persisted. Other toxic substances, such as vitriol and arsenic, were also employed, but their curative effects were equally in doubt.” [9]\n\n\n\n
Mercury had terrible side effects causing neuropathies, kidney failure, and severe mouth ulcers and loss of teeth, and many patients died of mercurial poisoning rather than from the disease itself. Treatment would typically go on for years and gave rise to the saying,
\n\n\n\n“A night with Venus, and a lifetime with mercury” [8]”
Frith, John. “Syphilis – Its Early History and Treatment until Penicillin and the Debate on Its Origins.” Journal of Military and Veterans’ Health 20 (November 1, 2012): 49–58.\")\nSo at a glance penicillin doesn’t look to have been clearly discontinuous relative to the impressive recent trend, and measuring inclusive costs is hard to do finely enough to see less clear discontinuities. Thus evaluating these costs quantitatively will remain beyond the scope of this investigation at present. We tentatively guess that penicillin did not represent a large discontinuity in inclusive costs of syphilis treatment, though it did represent huge progress.\n\n\n### Conclusions\n\n\nPenicillin probably made quick but not abrupt progress in reducing syphilis and syphilis mortality. Penicillin doesn’t appear to have been much more likely to cure a patient than earlier treatments, conditional on the treatment being carried out, but it penicillin treatment appears to have been around four times more likely to be carried out, due to lower costs. Qualitatively penicillin represented an important reduction in costs, but it is hard to evaluate this precisely or compare it with the longer term progress. It appears that as recently as 1910 another drug for syphilis also represented qualitatively huge progress in treatment, so it is unlikely that penicillin was a large discontinuity relative to past progress.\n\n\nNotes\n-----\n\n\n\n\n\n\n\n\n\n\n\n\n\n\n\n\n\n", "url": "https://aiimpacts.org/penicillin-and-historic-syphilis-trends/", "title": "Penicillin and historic syphilis trends", "source": "aiimpacts.org", "source_type": "wordpress", "date_published": "2020-02-08T01:36:10+00:00", "paged_url": "https://aiimpacts.org/feed?paged=9", "authors": ["Asya Bergal"], "id": "7e893b1f1f0ea0a958a065f139e839f4", "summary": []}
{"text": "Historic trends in the maximum superconducting temperature\n\nThe maximum superconducting temperature of any material up to 1993 contained four greater than 10-year discontinuities: A 14-year discontinuity with NbN in 1941, a 26-year discontinuity with LaBaCuO4 in 1986, a 140-year discontinuity with YBa2Cu3O7 in 1987, and a 10-year discontinuity with BiCaSrCu2O9 in 1987. \n\n\nYBa2Cu3O7 superconductors seem to correspond to a marked change in the rate of progress of maximum superconducting temperature, from a rate of progress of .41 Kelvin per year to a rate of 5.7 Kelvin per year.\n\n\nDetails\n-------\n\n\nThis case study is part of AI Impacts’ [discontinuous progress investigation](https://aiimpacts.org/discontinuous-progress-investigation/).\n\n\n### Background\n\n\nSuperconductors were discovered in 1911.[1](https://aiimpacts.org/historic-trends-in-the-maximum-superconducting-temperature/#easy-footnote-bottom-1-1618 \"“Superconductivity is a phenomenon of exactly zero electrical resistance and expulsion of magnetic flux fields occurring in certain materials, called superconductors, when cooled below a characteristic critical temperature. It was discovered by Dutch physicist Heike Kamerlingh Onnes on April 8, 1911, in Leiden.” – “Superconductivity”. 2018. En.Wikipedia.Org. Accessed June 29 2019. https://en.wikipedia.org/w/index.php?title=Superconductivity&oldid=903681858.\") Until 1986 the maximum temperature for superconducting behavior had gradually risen from around 4K to less than 30K (see figure 2 below). Theory at the time apparently predicted that 30K was an upper limit.[2](https://aiimpacts.org/historic-trends-in-the-maximum-superconducting-temperature/#easy-footnote-bottom-2-1618 \"“Until 1986 it was thought that superconducting behaviour was confined to certain materials at temperatures below ~30 K. A theory called “BCS theory” after its creators John Bardeen, Leon Cooper and Robert Schrieffer had been formulated to describe superconductivity. This theory, for which its creators received the Nobel Prize in Physics in 1972, appeared to back this up but put a limit on the critical temperature of around 30 K.” –I“Doitpoms – TLP Library Superconductivity – Discovery And Properties”. 2019. Doitpoms.Ac.Uk. Accessed June 29 2019. https://www.doitpoms.ac.uk/tlplib/superconductivity/discovery.php.\") In 1986 a new class of ceramics known as YBCO superconductors was discovered to allow superconducting behavior at higher temperatures: above 80K,[3](https://aiimpacts.org/historic-trends-in-the-maximum-superconducting-temperature/#easy-footnote-bottom-3-1618 \"“Yttrium barium copper oxide (YBCO) is a family of crystalline chemical compounds, famous for displaying high-temperature superconductivity. It includes the first material ever discovered to become superconducting above the boiling point of liquid nitrogen (77 K) at about 92 K.” – “Yttrium Barium Copper Oxide”. 2019. En.Wikipedia.Org. Accessed June 29 2019. https://en.wikipedia.org/w/index.php?title=Yttrium_barium_copper_oxide&oldid=903757351.\") and within seven years, above 130K.[4](https://aiimpacts.org/historic-trends-in-the-maximum-superconducting-temperature/#easy-footnote-bottom-4-1618 \"“Here we provide support for this conjecture, with the discovery of superconductivity above 130 K in a material containing HgBa2Ca2Cu3O1+x (with three CuO2 layers per unit cell), HgBa2CaCu2O6+x (with two CuO2 layers) and an ordered superstructure comprising a defined sequence of the unit cells of these phases”
Schilling, A., M. Cantoni, J. D. Guo, and H. R. Ott. 1993. “Superconductivity Above 130 K In The Hg–Ba–Ca–Cu–O System”. Nature 363 (6424): 56-58. Springer Nature. doi:10.1038/363056a0.\")\n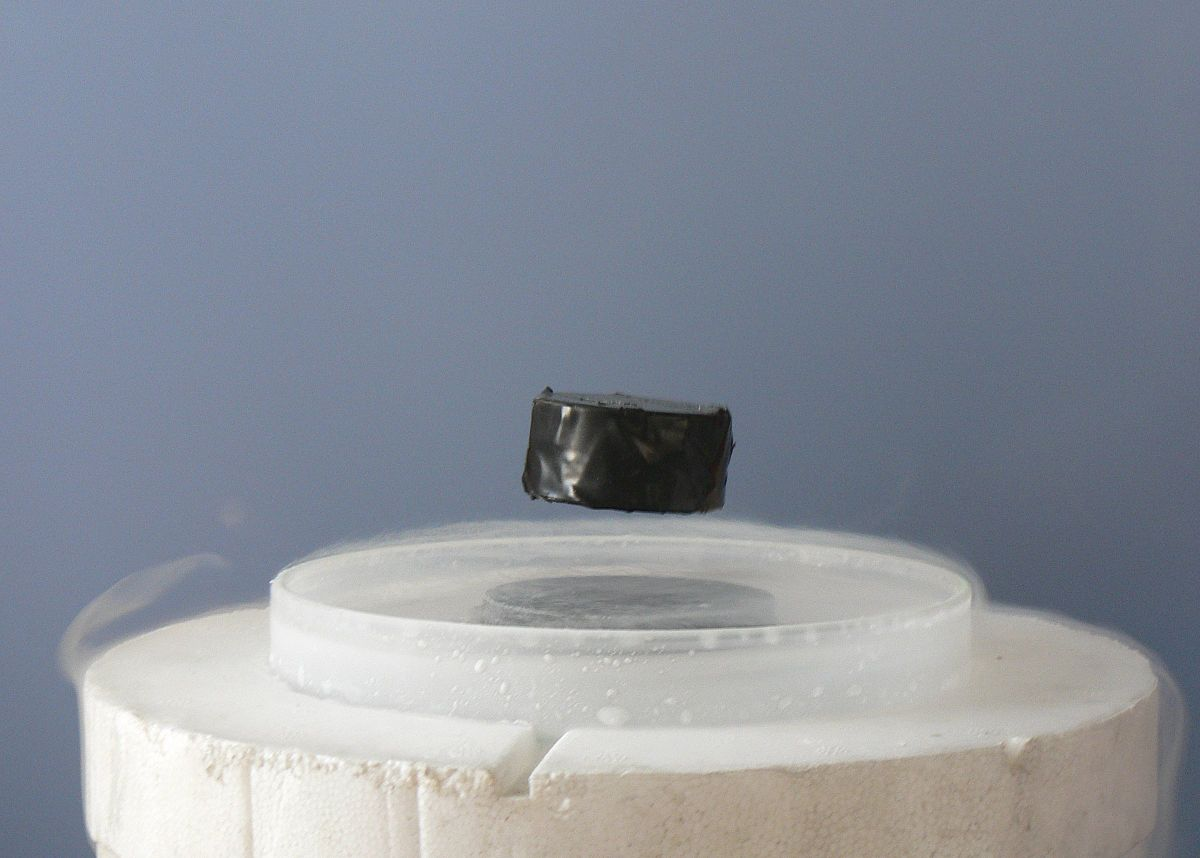**Figure 1:** Levitation of a magnet above a superconductor[5](https://aiimpacts.org/historic-trends-in-the-maximum-superconducting-temperature/#easy-footnote-bottom-5-1618 \"From Wikimedia Commons: Mai-Linh Doan [CC BY-SA 3.0 (http://creativecommons.org/licenses/by-sa/3.0/)]\")\n### Trends\n\n\n#### Maximum temperature for superconducting behavior\n\n\nWe looked at data for the maximum temperature at which any material is known to have superconducting behavior. \n\n\n##### Data\n\n\nWe found the following data in a figure from the University of Cambridge’s online learning materials course, DoITPoMS,[6](https://aiimpacts.org/historic-trends-in-the-maximum-superconducting-temperature/#easy-footnote-bottom-6-1618 \"“Doitpoms – TLP Library Superconductivity – Discovery And Properties”. 2019. Doitpoms.Ac.Uk. Accessed June 29 2019. https://www.doitpoms.ac.uk/tlplib/superconductivity/discovery.php.\") and have verified most of it against other data sources (see [our spreadsheet](https://docs.google.com/spreadsheets/d/1JZh0wfCW-DrJjYLNgGW_TML-gmq1xZ44PfsfSCP5nlo/edit?usp=sharing), where we also collected ‘Extended data’ to verify that these were indeed the record temperatures).\n\n\nWe display the original figure from DoITPoMS in Figure 2 below, followed by our figure, Figure 3, which includes the a more recent superconducting material, H2S.\n\n\n**Figure 2:** Maximum superconducting temperature by material over time through 2000, from the University of Cambridge’s online learning materials course, DoITPoMS,[7](https://aiimpacts.org/historic-trends-in-the-maximum-superconducting-temperature/#easy-footnote-bottom-7-1618 \"“Doitpoms – TLP Library Superconductivity – Discovery And Properties”. 2019. Doitpoms.Ac.Uk. Accessed June 29 2019. https://www.doitpoms.ac.uk/tlplib/superconductivity/discovery.php.\") \n \n\n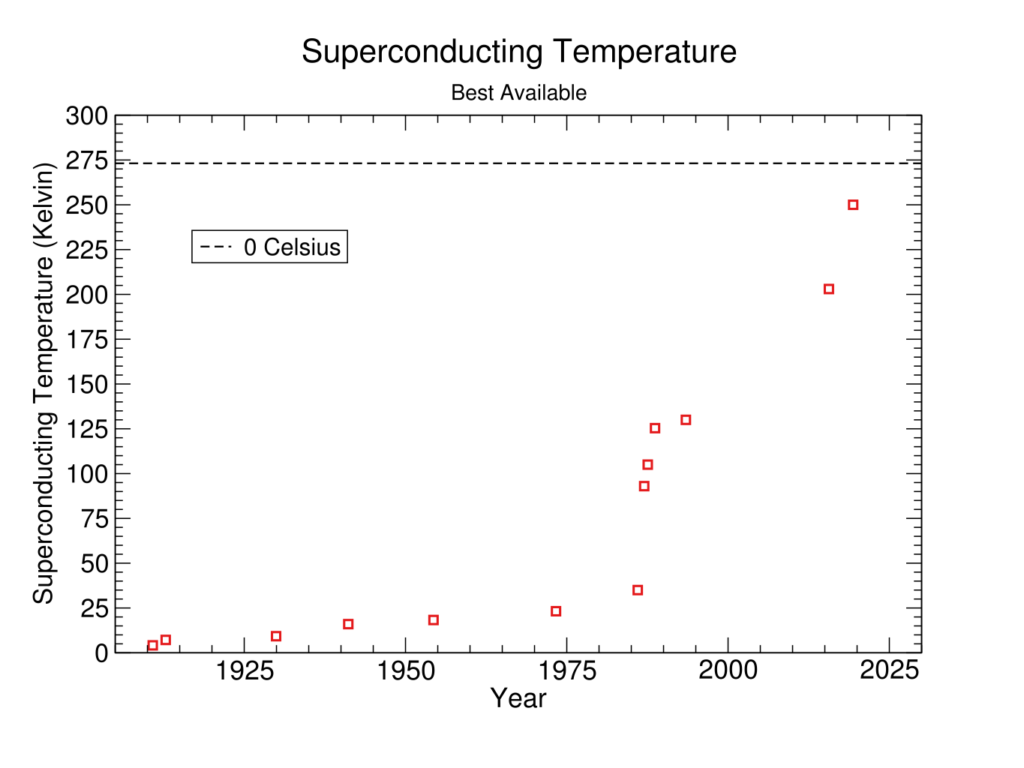**Figure 3:** Maximum superconducting temperate by material over time through 2015 \n\n##### Discontinuity measurement\n\n\nWe modeled this data as linear within two different regimes, one up to LaBaCu04 in 1986, and another starting with 1986 until our last data point.[8](https://aiimpacts.org/historic-trends-in-the-maximum-superconducting-temperature/#easy-footnote-bottom-8-1618 \"See our spreadsheet to see the trends, and our methodology page for details on how we divide the data into trends and how to interpret the spreadsheet.\") Using previous rates from those trends, we calculated four greater than 10-year discontinuities (rounded), shown in the table below:[9](https://aiimpacts.org/historic-trends-in-the-maximum-superconducting-temperature/#easy-footnote-bottom-9-1618 \"See our methodology page for more details, and our spreadsheet for our calculation.\")\n\n\n| | | | |\n| --- | --- | --- | --- |\n| **Year** | **Temperature** | **Discontinuity** | **Material** |\n| 1941 | 16 K | 14 years | [NbN](https://en.wikipedia.org/wiki/Niobium_nitride) |\n| 1986 | 35 K | 26 years | [LaBaCuO4](https://en.wikipedia.org/wiki/Yttrium_barium_copper_oxide) |\n| 1987 | 93 K | 140 years | [YBa2Cu3O7](https://en.wikipedia.org/wiki/Yttrium_barium_copper_oxide) |\n| 1987 | 105 K | 10 years | [BiCaSrCu2O9](https://iopscience.iop.org/article/10.1143/JJAP.27.L209/meta) |\n\n\nIn addition to the size of this discontinuity in years, we have tabulated a number of other potentially relevant metrics **[here](https://docs.google.com/spreadsheets/d/1iMIZ57Ka9-ZYednnGeonC-NqwGC7dKiHN9S-TAxfVdQ/edit?usp=sharing)**.[10](https://aiimpacts.org/historic-trends-in-the-maximum-superconducting-temperature/#easy-footnote-bottom-10-1618 \"See our methodology page for more details.\")\n##### Changes in the rate of progress\n\n\nWe note that there was a marked change in the rate of progress of maximum superconducting temperature with YBa2Cu3O7. The maximum superconducting temperature changed from a rate of progress of .41 Kelvin per year to a rate of 5.7 Kelvin per year.[11](https://aiimpacts.org/historic-trends-in-the-maximum-superconducting-temperature/#easy-footnote-bottom-11-1618 \"See our methodology page for more details, and our spreadsheet for our calculation.\")\nNotes\n-----\n\n\n\n\n\n\n\n\n\n", "url": "https://aiimpacts.org/historic-trends-in-the-maximum-superconducting-temperature/", "title": "Historic trends in the maximum superconducting temperature", "source": "aiimpacts.org", "source_type": "wordpress", "date_published": "2020-02-08T00:22:32+00:00", "paged_url": "https://aiimpacts.org/feed?paged=9", "authors": ["Asya Bergal"], "id": "aa26f745ced312aabe450bd2a20a0622", "summary": []}
{"text": "Historic trends in chess AI\n\nThe Elo rating of the best chess program measured by the Swedish Chess Computer Association did not contain any greater than 10-year discontinuities between 1984 and 2018. A four year discontinuity in 2008 was notable in the context of otherwise regular progress. \n\n\nDetails\n-------\n\n\nThis case study is part of AI Impacts’ [discontinuous progress investigation](https://aiimpacts.org/discontinuous-progress-investigation/).\n\n\n### Background\n\n\nThe history of chess-playing computers is long and rich, partly because chess-playing ability has long been thought (by some) to be a sign of general intelligence.[1](https://aiimpacts.org/historic-trends-in-chess-ai/#easy-footnote-bottom-1-1638 \"For a good history of chess-playing computers, see this article. It says: “It was in this context that Turing, Von Neumann, and Shannon posed an ancient question in a now modern guise, in what came to be called “Artificial Intelligence” in the coming decade: can a machine be made to think like a person? And the answer to the question—the question of machine intelligence—was from the start tied to the question of whether a machine could be made to play chess. Turing began the investigation of chess playing computers with a system written out with paper and pencil, where he played the role of the machine. Later Shannon extended Turing’s work in a 1949 paper, explaining about his interest in chess that: “Although of no practical importance, the question is of theoretical interest, and it is hoped that…this problem will act as a wedge in attacking other problems—of greater significance.” As became clear in later writing by the two computer pioneers, “greater significance” was no less than the quest to “build a brain,” as Turing had put it. The quest for Artificial Intelligence, then, began with the question of whether a computer could play chess. Could it?”
Best_Schools. “A Brief History of Computer Chess.” TheBestSchools.org. September 18, 2018. Accessed July 18, 2019. https://thebestschools.org/magazine/brief-history-of-computer-chess/.
Another example: The tenth Turing Lecture, available here, mentions chess 20 times and uses it as a central example of how the field of artificial intelligence has progressed over the years. Newell, Allen, and Herbert A. Simon. “Computer Science as Empirical Inquiry: Symbols and Search.” ACM Turing Award Lectures: 1975. doi:10.1145/1283920.1283930. \") The first two ‘chess-playing machines’ were in fact fakes, with small human chess-players crouching inside.[2](https://aiimpacts.org/historic-trends-in-chess-ai/#easy-footnote-bottom-2-1638 \"1769 – Wolfgang von Kempelen builds the Automaton Chess-Player, containing a human chess player hidden inside, in what becomes one of the greatest hoaxes of its period.
1868 – Charles Hooper presented the Ajeeb automaton — which also had a human chess player hidden inside.
“Computer Chess.” Wikipedia. July 10, 2019. Accessed July 18, 2019. https://en.wikipedia.org/wiki/Computer_chess. \") It was not until 1951 that a program was published (by Alan Turing) that could actually play the full game.[3](https://aiimpacts.org/historic-trends-in-chess-ai/#easy-footnote-bottom-3-1638 \" “1951 – Alan Turing is first to publish a program, developed on paper, that was capable of playing a full game of chess (dubbed Turochamp).[1][2]”
“Computer Chess.” Wikipedia. July 10, 2019. Accessed July 18, 2019. https://en.wikipedia.org/wiki/Computer_chess. \") There has been fairly regular progress since then.[4](https://aiimpacts.org/historic-trends-in-chess-ai/#easy-footnote-bottom-4-1638 \"See Wikipedia’s page on the history of computer chess.
“Computer Chess.” Wikipedia. July 10, 2019. Accessed July 18, 2019. https://en.wikipedia.org/wiki/Computer_chess. \") \n\n\nIn 1997 IBM’s chess machine Deep Blue beat Gary Kasparov, world chess champion at the time, under standard tournament time controls.[5](https://aiimpacts.org/historic-trends-in-chess-ai/#easy-footnote-bottom-5-1638 \"“Deep Blue was then heavily upgraded, and played Kasparov again in May 1997.[1] Deep Blue won game six, therefore winning the six-game rematch 3½–2½ and becoming the first computer system to defeat a reigning world champion in a match under standard chess tournament time controls.[2]”
“Deep Blue (Chess Computer).” In Wikipedia, June 26, 2019. https://en.wikipedia.org/w/index.php?title=Deep_Blue_(chess_computer)&oldid=903491291.\") This was seen as particularly significant in light of the continued popular association between chess AI and general AI.[6](https://aiimpacts.org/historic-trends-in-chess-ai/#easy-footnote-bottom-6-1638 \" “Computer scientists believed that playing chess was a good measurement for the effectiveness of artificial intelligence, and by beating a world champion chess player, IBM showed that they had made significant progress. After the loss, Kasparov said that he sometimes saw deep intelligence and creativity in the machine’s moves, suggesting that during the second game, human chess players had intervened on behalf of the machine…” “Computer Chess.” Wikipedia. July 10, 2019. Accessed July 18, 2019. https://en.wikipedia.org/wiki/Computer_chess. \") The event marked the point at which chess AI became superhuman, and received substantial press coverage.[7](https://aiimpacts.org/historic-trends-in-chess-ai/#easy-footnote-bottom-7-1638 \"“The studio seated about five hundred people, and was sold-out for each of the six games. It seemed that the entire world was watching ”
Best_Schools. “A Brief History of Computer Chess.” TheBestSchools.org. September 18, 2018. Accessed July 18, 2019. https://thebestschools.org/magazine/brief-history-of-computer-chess/. \") \n\n\nThe Swedish Chess Computer Association (SSDF) measures computer chess software performance by playing chess programs against one another on standard hardware.[8](https://aiimpacts.org/historic-trends-in-chess-ai/#easy-footnote-bottom-8-1638 \"“The Swedish Chess Computer Association (Swedish: Svenska schackdatorföreningen, SSDF) is an organization that tests computer chess software by playing chess programs against one another and producing a rating list. […] The SSDF list is one of the only statistically significant measures of chess engine strength, especially compared to tournaments, because it incorporates the results of thousands of games played on standard hardware at tournament time controls. The list reports not only absolute rating, but also error bars, winning percentages, and recorded moves of played games.”
“Swedish Chess Computer Association”. 2009. En.Wikipedia.Org. Accessed June 19 2019. https://en.wikipedia.org/w/index.php?title=Swedish_Chess_Computer_Association&oldid=891692663.\")\n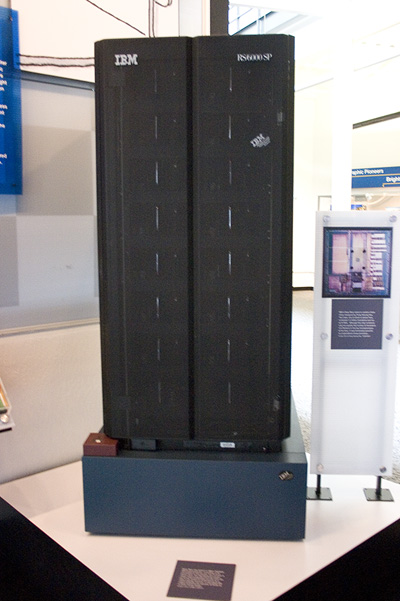Figure 1: Deep Blue[9](https://aiimpacts.org/historic-trends-in-chess-ai/#easy-footnote-bottom-9-1638 \"From Wikimedia Commons: James the photographer [CC BY 2.0 (https://creativecommons.org/licenses/by/2.0)]\")\n### Trends\n\n\n#### SSDF Elo Ratings\n\n\nAccording to Wikipedia[10](https://aiimpacts.org/historic-trends-in-chess-ai/#easy-footnote-bottom-10-1638 \"“Swedish Chess Computer Association.” In Wikipedia, April 9, 2019. https://en.wikipedia.org/w/index.php?title=Swedish_Chess_Computer_Association&oldid=891692663.\"):\n\n\n\n> The **Swedish Chess Computer Association** (Swedish: *Svenska schackdatorföreningen*, SSDF) is an organization that tests computer chess software by playing chess programs against one another and producing a rating list…The SSDF list is one of the only statistically significant measures of chess engine strength, especially compared to tournaments, because it incorporates the results of thousands of games played on standard hardware at tournament time controls. The list reports not only absolute rating, but also error bars, winning percentages, and recorded moves of played games.\n> \n> \n\n\n##### Data\n\n\nWe took data from Wikipedia’s list of SSDF Ratings[11](https://aiimpacts.org/historic-trends-in-chess-ai/#easy-footnote-bottom-11-1638 \"“Swedish Chess Computer Association”. 2009. En.Wikipedia.Org. Accessed June 19 2019. https://en.wikipedia.org/w/index.php?title=Swedish_Chess_Computer_Association&oldid=891692663.\") (which we have not verified) and added it to [this spreadsheet](https://docs.google.com/spreadsheets/d/1gJU4lfAiQXLPp15xYHu1umZewc2HIHFsJzHTefS147o/edit?usp=sharing). See Figure 2 below.\n\n\n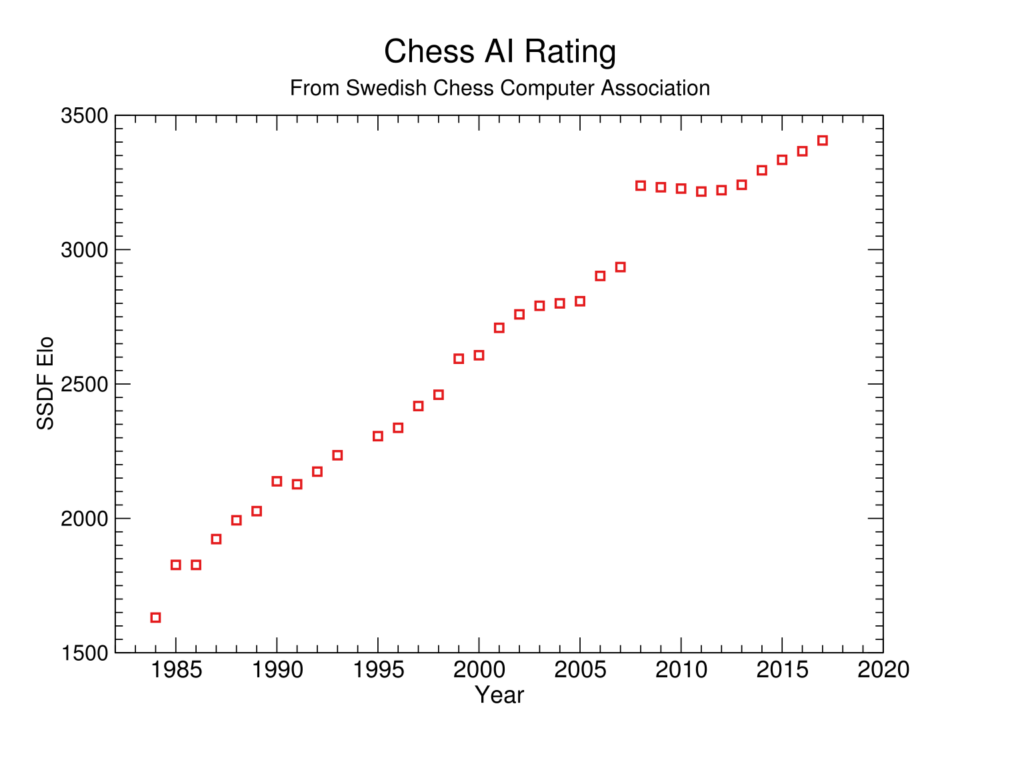 Figure 2: Elo ratings of the best program on SSDF at the end of each year. \n##### Discontinuity measurement\n\n\nLooking at the data, we assume a linear trend in Elo.[12](https://aiimpacts.org/historic-trends-in-chess-ai/#easy-footnote-bottom-12-1638 \"See our methodology page for more details.\") There are no discontinuities of 10 or more years. \n\n\n###### Minor discontinuity\n\n\nThere is a four year discontinuity in 2008. While this is below the scale of interest for our [discontinuous progress investigation](https://aiimpacts.org/discontinuous-progress-investigation/), it strikes us as notable in the context of otherwise very regular progress.[13](https://aiimpacts.org/historic-trends-in-chess-ai/#easy-footnote-bottom-13-1638 \"See our methodology page for more details, and our spreadsheet for our calculation.\") We’ve tabulated a number of other potentially relevant metrics for this discontinuity in the ‘Notable discontinuities less than 10 years’ tab **[here](https://docs.google.com/spreadsheets/d/1iMIZ57Ka9-ZYednnGeonC-NqwGC7dKiHN9S-TAxfVdQ/edit?usp=sharing)**.[14](https://aiimpacts.org/historic-trends-in-chess-ai/#easy-footnote-bottom-14-1638 \"See our methodology page for more details.\") \n\n\nThis jump appears to have been partially caused by the introduction of new hardware in the contest, as well as software progress.[15](https://aiimpacts.org/historic-trends-in-chess-ai/#easy-footnote-bottom-15-1638 \"‘The jump perfectly corresponds to moving from all programs running on an Arena 256 MB Athlon 1200 MHz to some programs running on a 2 GB Q6600 2.4 GHz computer, suggesting the change in hardware accounts for the observed improvement. However, it also corresponds perfectly to Deep Rybka 3 overtaking Rybka 2.3.1. This latter event corresponds to huge jumps in the CCRL and CEGT records at around that time, and they did not change hardware then. The average program in the SSDF list gained 120 points at that time (Karlsson 2008), which is roughly the difference between the size of the jump in the SSDF records and the jump in records from other rating systems. So it appears that the SSDF introduced Rybka and new hardware at the same time, and both produced large jumps.’ – Grace, Katja. Algorithmic Progress in Six Domains. Report. December 9, 2013. Accessed June 19, 2019. https://intelligence.org/files/AlgorithmicProgress.pdf, p19\")\nNotes\n-----\n\n\n\n\n\n", "url": "https://aiimpacts.org/historic-trends-in-chess-ai/", "title": "Historic trends in chess AI", "source": "aiimpacts.org", "source_type": "wordpress", "date_published": "2020-02-08T00:00:27+00:00", "paged_url": "https://aiimpacts.org/feed?paged=9", "authors": ["Asya Bergal"], "id": "065df348a54f158b441d58df7fcf0034", "summary": []}
{"text": "Effect of Eli Whitney’s cotton gin on historic trends in cotton ginning\n\nWe estimate that Eli Whitney’s cotton gin represented a 10 to 25 year discontinuity in pounds of cotton ginned per person per day, in 1793. Two innovations in 1747 and 1788 look like discontinuities of over a thousand years each on this metric, but these could easily stem from our ignorance of such early developments. We tentatively doubt that Whitney’s gin represented a large discontinuity in the cost per value of cotton ginned, though it may have represented a moderate one.\n\n\nDetails\n-------\n\n\nThis case study is part of AI Impacts’ [discontinuous progress investigation](https://aiimpacts.org/discontinuous-progress-investigation/).\n\n\n### Background\n\n\nCotton fibers grow around cotton seeds, which they need to be separated from before use. This can be done by hand, but since 500 C.E.,[1](https://aiimpacts.org/effect-of-eli-whitneys-cotton-gin-on-historic-trends-in-cotton-ginning/#easy-footnote-bottom-1-1359 \"“A fifth-century Buddhist painting… constitutes the earliest evidence of a single-roller gin.” Lakwete, Angela. Inventing the Cotton Gin: Machine and Myth in Antebellum America. Baltimore, MD: Johns Hopkins University Press, 2003., 4.\") and plausibly prehistory, a variety of tools have aided in speeding up the process. [2](https://aiimpacts.org/effect-of-eli-whitneys-cotton-gin-on-historic-trends-in-cotton-ginning/#easy-footnote-bottom-2-1359 \" “Archaeologists’ oversight may explain the absence of evidence that would locate the single-roller gin in prehistory. That the rollers of extant gins are made of iron does not preclude the possibility that the machine predates the Iron Age. The roller could have been made out of stone…”
Lakwete, Angela. Inventing the Cotton Gin: Machine and Myth in Antebellum America. Baltimore, MD: Johns Hopkins University Press, 2003, 4.\")\nThese tools are called ‘cotton gins’. Eli Whitney’s 1793 cotton gin was a particularly famous innovation, commonly credited with having vastly increased cotton’s profitability, fueling an otherwise diminishing demand for slave labor, and so substantially contributing to the American Civil War.[3](https://aiimpacts.org/effect-of-eli-whitneys-cotton-gin-on-historic-trends-in-cotton-ginning/#easy-footnote-bottom-3-1359 \"Wikipedia says: “A modern mechanical cotton gin was created by American inventor Eli Whitney in 1793 and patented in 1794…It revolutionized the cotton industry in the United States, but also led to the growth of slavery in the American South as the demand for cotton workers rapidly increased. The invention has thus been identified as an inadvertent contributing factor to the outbreak of the American Civil War.[4] ”
“Cotton Gin.” In Wikipedia, June 4, 2019. https://en.wikipedia.org/w/index.php?title=Cotton_gin&oldid=900249024. \") Variants on Whitney’s gin are known as ‘saw gins’.[4](https://aiimpacts.org/effect-of-eli-whitneys-cotton-gin-on-historic-trends-in-cotton-ginning/#easy-footnote-bottom-4-1359 \"“In 1794 Eli Whitney patented a new ginning principle and built a new kind of gin. Instead of rollers that pinched off the fiber, he used course wire teeth that rotated through a tightly spaced metal grate to pull it from the seed…Industry ambivalence spurred others to adopt the gin but change it. Gin makers substituted an axle loaded with fine-toothed circular saws for Whitney’s wire-studded wooden cylinder. In 1796 Hogden Holmes of Augusta, Georgia, patented the adaptation, naming it the saw gin. The suit that followed capped a contentious and socially and legally mediated process from which Eli Whitney emerged as the inventor of the cotton gin.”
Angela Lakwete, Inventing the Cotton Gin: Machine and Myth in Antebellum America (JHU Press, 2003), 47.\") (See Figure 1.) Cotton became more valuable than all other US exports combined during the antebellum era.[5](https://aiimpacts.org/effect-of-eli-whitneys-cotton-gin-on-historic-trends-in-cotton-ginning/#easy-footnote-bottom-5-1359 \"First table of p567,
\n\n\n\nFederal Reserve Bulletin (U.S. Government Printing Office, 1923), https://books.google.com/books?id=oNnL2qUnv1AC&printsec=frontcover#v=onepage&q&f=false\") Thus Whitney’s gin is a good contender for representing a discontinuity in innovation. \n\n\nOur investigation draws heavily from Lakwete’s *Inventing the Cotton Gin.* Lakwete summarizes the situation surrounding Whitney’s invention as follows[6](https://aiimpacts.org/effect-of-eli-whitneys-cotton-gin-on-historic-trends-in-cotton-ginning/#easy-footnote-bottom-6-1359 \"Lakwete, Angela. Inventing the Cotton Gin: Machine and Myth in Antebellum America. Baltimore, MD: Johns Hopkins University Press, 2003, 48\"):\n\n\n\n> The introduction of a new gin in 1794 was as unexpected as it was unprecedented. It was unexpected because the British textile industry had expanded from the sixteenth through the eighteenth centuries without a change in the ginning principle. Cotton producers had increased the acres they planted in cotton and planted new varieties to suit textile makers. The market attracted new producers who, like established planters, used roller gins to process their crops. Roller gins, whether hand-cranked in the Levant and India, or foot-, animal-, and inanimately powered in the Americas, provided adequate amounts of fiber with the qualities that textile makers wanted, namely length and cleanliness. All roller gins removed the fiber by pinching it off in bundles, preserving its length and orientation as grown. Random fragments of fractured seeds were picked out of the fiber before it was bagged and shipped. \n> \n> In 1788 Joseph Eve gave planters and merchants a machine that bridged the medieval and modern. It preserved the ancient roller principle but completed the appropriation of the ginner’s skill, as Arkwright’s frame had that of the spinner. Appropriation had proceeded in stages beginning with the single-roller gin that mechanized the thumb and finger pinching motion. The roller gin in turn appropriated the agility and strength needed to manipulate the single roller, while the foot gin freed both hands to supply seed cotton. The barrel gin used animal and water power, removing humans as a power source but retaining them as seed cotton suppliers. The self-feeding animal-, wind-, or water-powered Eve gin replaced each of the skilled tasks of the ginner with mechanical components. \n> \n> Nevertheless, Eli Whitney’s unprecedented gin filled a vacuum. While large merchants invested in barrel gins and large planter in the Eve gin, the majority continued to use the skill- and labor-intensive foot gin to gin fuzzy-seed short-staple cotton as well as the smooth-seed, Sea Island cotton. Barrel gins had not decreased the number of ginners and only marginally improved ginner productivity, and Eve’s complicated gin was notoriously finicky. Whitney ignored these modernizing gins and offered a replacement for the ubiquitous foot gin.\n> \n> \n\n\n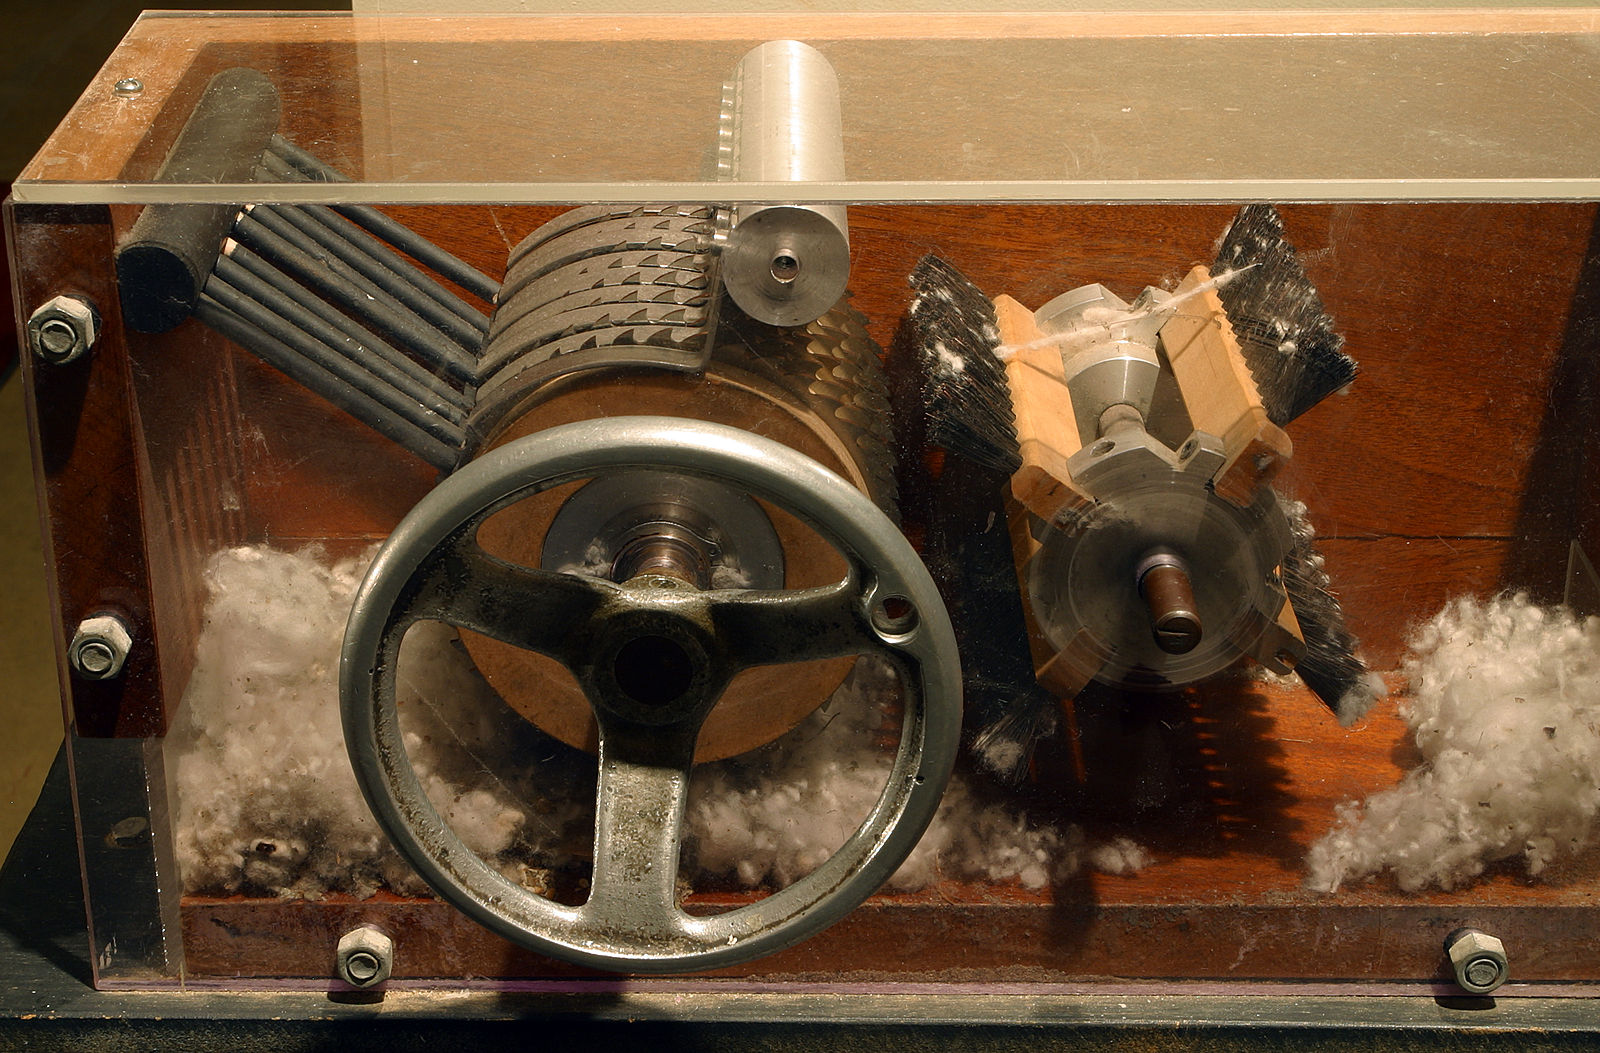Figure 1: What appears to be a saw gin of some kind on display at the Eli Whitney Museum[7](https://aiimpacts.org/effect-of-eli-whitneys-cotton-gin-on-historic-trends-in-cotton-ginning/#easy-footnote-bottom-7-1359 \"From Wikimedia Commons:
Tom Murphy VII (Public domain)\")\n### Trends\n\n\n#### Pounds of cotton ginned per person-day\n\n\nWe are most interested in metrics that people were working to improve—in this case, perhaps ‘cost of producing a dollar’s worth of cotton’. Inclusive metrics are hard to measure however. Instead we have collected data on ‘pounds of cotton ginned per person per day’, which is simpler, often reported on, and probably a reasonable proxy. However, it departs from tracking the usefulness of a gin by ignoring several major factors:\n\n\n1. Upfront costs: these presumably varied a lot, because a gin can for instance resemble a rolling pin and a board, or involve horses or steam power.[8](https://aiimpacts.org/effect-of-eli-whitneys-cotton-gin-on-historic-trends-in-cotton-ginning/#easy-footnote-bottom-8-1359 \"See a variety of gin descriptions at:
“Cotton Gin,” in Wikipedia, June 4, 2019, https://en.wikipedia.org/w/index.php?title=Cotton_gin&oldid=900249024.\") Thus the gins with higher upfront costs are less useful than their cotton-per-person-day statistic would make them seem. In the mid-1860’s many farms still used foot gins, seemingly because Eve gins—while more efficiently producing high quality output—were expensive.[9](https://aiimpacts.org/effect-of-eli-whitneys-cotton-gin-on-historic-trends-in-cotton-ginning/#easy-footnote-bottom-9-1359 \"“Instead of being replaced, the foot gin outlasted the barrel gin and remained in use to the mid-1860s. … The [Eve gin] was labor-saving but capital-intensive. It was more expensive than the foot gin and required water or windmill as well as a reinforced building that could withstand the vibrations of the feeder. Yet it increased outturn without changing the quality of the fiber…” Lakwete, Angela. Inventing the Cotton Gin: Machine and Myth in Antebellum America. Baltimore, MD: Johns Hopkins University Press, 2003., 40.\") Even if everything had the same upfront costs, the existence of upfront costs means that a gin which processes 200lb of cotton with two people per day would be better than one that processes 100lb of cotton with one person, so cotton/person-day still fails to match what we are interested in.\n2. Variation in labor requirements: Some gins required especially skilled labor.[10](https://aiimpacts.org/effect-of-eli-whitneys-cotton-gin-on-historic-trends-in-cotton-ginning/#easy-footnote-bottom-10-1359 \"“Foot ginners could be productive… but they were the most valuable men a planter owned or hired. With Eve’s gin, planters used that labor to produce cotton and “only the most ordinary” workers to gin it.” Lakwete, Angela. Inventing the Cotton Gin: Machine and Myth in Antebellum America. Baltimore, MD: Johns Hopkins University Press, 2003., 45.\")\n3. Substitutes for people: some gins used people to power them and others used animals or water-power, along with a smaller number of people.[11](https://aiimpacts.org/effect-of-eli-whitneys-cotton-gin-on-historic-trends-in-cotton-ginning/#easy-footnote-bottom-11-1359 \"“The [Eve gin] was labor-saving but capital-intensive. It was more expensive than the foot gin and required water or windmill …” Lakwete, Angela. Inventing the Cotton Gin: Machine and Myth in Antebellum America. Baltimore, MD: Johns Hopkins University Press, 2003., 40.\n
“McCarthy’s gin was adopted for cleaning the Sea Island variety of extra-long staple cotton grown in Florida, Georgia and South Carolina. It cleaned cotton several times faster than the older gins, and, when powered by one horse, produced 150 to 200 pounds of lint a day.”
\n“Cotton Gin,” in Wikipedia, June 4, 2019, https://en.wikipedia.org/w/index.php?title=Cotton_gin&oldid=900249024.
\n\") This again makes for higher output per person, but at the cost of additional animals, that we are not accounting for.\n\n\n\n\n- Risks of injury: Some gins, particularly foot and barrel gins, were dangerous to operate.[12](https://aiimpacts.org/effect-of-eli-whitneys-cotton-gin-on-historic-trends-in-cotton-ginning/#easy-footnote-bottom-12-1359 \"“The oxen and water-driven barrel gins that Drayton described could not be stopped quickly, so ginners risked serious injury.”…”Foot gins were not without their own risks and limitations.” Lakwete, Angela. Inventing the Cotton Gin: Machine and Myth in Antebellum America. Baltimore, MD: Johns Hopkins University Press, 2003., 39.\")\n\n- Types and quality of cotton ginned: Whitney’s gin produced degraded cotton fiber, relative to other gins available at the time.[13](https://aiimpacts.org/effect-of-eli-whitneys-cotton-gin-on-historic-trends-in-cotton-ginning/#easy-footnote-bottom-13-1359 \"“In 1794 Eli Whitney patented a new ginning principle and built a new kind gin…It turned out large quantities of fiber but destroyed the very qualities that textile makers had valued.”\n
Lakwete, Angela. Inventing the Cotton Gin: Machine and Myth in Antebellum America. Baltimore, MD: Johns Hopkins University Press, 2003, 47
\n“But textile makers continued to complain about the quality of the fiber the toothed gin turned out.” Lakwete, Angela. Inventing the Cotton Gin: Machine and Myth in Antebellum America. Baltimore, MD: Johns Hopkins University Press, 2003., 63\") However, Whitney’s gin could process short staple cotton, an easier to grow strain which was previously hard to process.[14](https://aiimpacts.org/effect-of-eli-whitneys-cotton-gin-on-historic-trends-in-cotton-ginning/#easy-footnote-bottom-14-1359 \"“In the colonial era, small amounts high quality long-staple cotton were produced in the Sea Islands off the coast of South Carolina. Inland, only short-staple cotton could be grown but it was full of seeds and very hard to process into fiber. The invention of the cotton gin in the late 1790s for the first time made short-staple cotton usable.”
\n“History of Agriculture in the United States.” Wikipedia. April 11, 2019. Accessed April 25, 2019. https://en.wikipedia.org/wiki/History_of_agriculture_in_the_United_States#Cotton.
\n“The Indian roller cotton gin, known as the churka or charkha, was introduced to the United States in the mid-18th century, when it was adopted in the southern United States. The device was adopted for cleaning long-staple cotton, but was not suitable for the short-staple cotton that was more common in certain states such as Georgia. Several modifications were made to the Indian roller gin by Mr. Krebs in 1772 and Joseph Eve in 1788, but their uses remained limited to the long-staple variety, up until Eli Whitney’s development of a short-staple cotton gin in 1793″
\n“Cotton Gin.” Wikipedia. April 03, 2019. https://en.wikipedia.org/wiki/Cotton_gin.\") The cotton industry might adjust to different cotton over time, so that long-run differences in quality of outputs of different gins are smaller than initial differences. If so, we expect value produced by a new gin producing lower quality cotton to grow continuously over an extended period.\n\n\nWe do also investigate overall cost per value of cotton ginned later, but do not have such clear data for it (see section, ‘cost per value of cotton ginned’).\n\n\n##### Data\n\n\nWe collected claims about cotton gin productivity in the time leading up to Whitney’s gin, and some after. Many but not all are from Angela Lakwete’s book, *Inventing the Cotton Gin: Machine and Myth in Antebellum America*.[15](https://aiimpacts.org/effect-of-eli-whitneys-cotton-gin-on-historic-trends-in-cotton-ginning/#easy-footnote-bottom-15-1359 \"Angela Lakwete, Inventing the Cotton Gin: Machine and Myth in Antebellum America (JHU Press, 2003).\") Our sources are mostly secondhand or thirdhand claims about nonspecific observations in the 1700s. We have the impression that claims in this space are not very reliable.[16](https://aiimpacts.org/effect-of-eli-whitneys-cotton-gin-on-historic-trends-in-cotton-ginning/#easy-footnote-bottom-16-1359 \"For instance, some claim Barclay was a slave, another elaborates his story as a plantation owner. Data from here suggests a large drop in cotton bale production between 1860 and 1880, yet this says, “By 1870, sharecroppers, small farmers, and plantation owners in the American south had produced more cotton than they had in 1860, and by 1880, they exported more cotton than they had in 1860.” Most of all, Whitney’s own claim about the productivity of his original gin is arguably too outlandish to be believed—while estimates of gin productivity slightly later don’t reach 400lbs/person-day (see our data below), Whitney apparently claimed his gin could produce 1250lb/person-day:
\n“Two ginners on the new gin could turn out as much fiber in a day as one hundred foot ginners each averaging twenty-five pounds, in all twenty-five hundred pounds, Whitney estimated.” (Whitney quote from Angela Lakwete, Inventing the Cotton Gin: Machine and Myth in Antebellum America (JHU Press, 2003), p49)
\") We classified claims as ‘credible’ or not, but this is fairly ambiguous, and we would be unsurprised if some of the ‘credible’ claims turned out to be inaccurate, or the ‘non-credible’ ones were correct.\n\n\nOur dataset of claims is [here](https://docs.google.com/spreadsheets/d/1oXOy2cyaSv_9svTXiInlDbOWn1vv6BG19dEQiZk40C8/edit#gid=91839643), and illustrated in Figures 2 – 5. Note that dates are those when a claim was made, not necessarily dates of the invention of the type of cotton gin in question. This is because invention dates are hard to find, and also because it seems likely that much improvement happened incrementally between distinct ‘inventions’ of new types. Nonetheless, this means that a report dated to a time could be from a gin that was built earlier. \n\n\n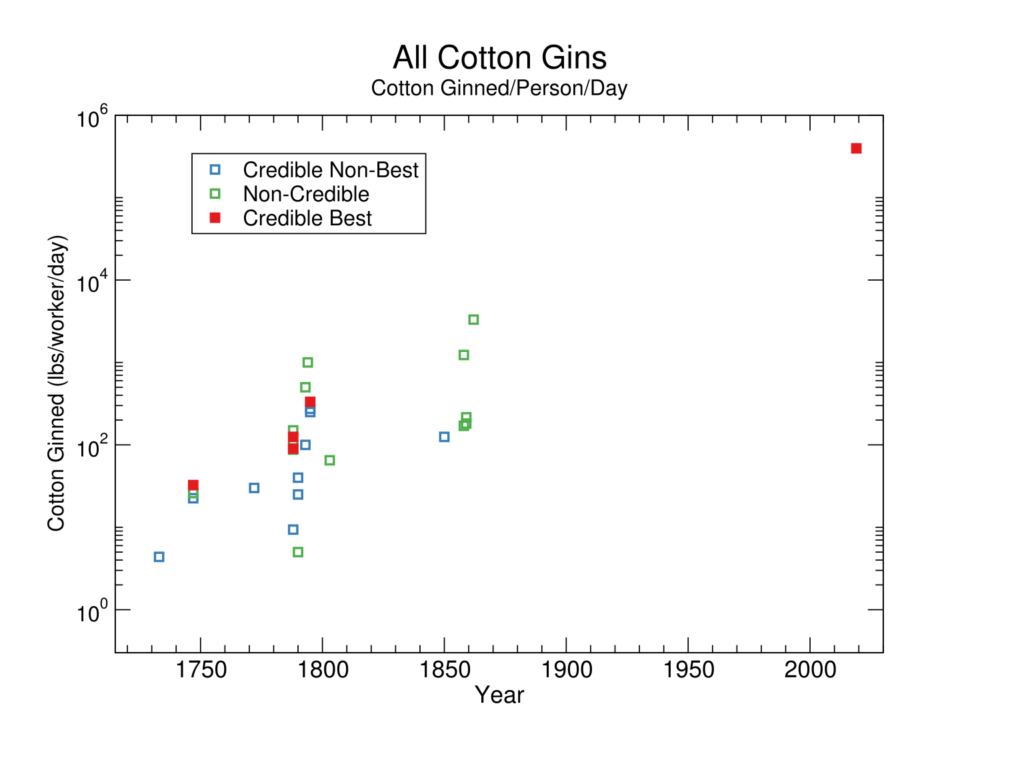Figure 2: Claimed cotton gin productivity, 1720 to modern day, coded by credibility and being records, and dated by when the claim was made (not necessarily when the gin was made). Claims that are both relatively credible and higher than previous relatively credible claims are few. The last credible best point before the modern day is an improved version of Whitney’s gin, two years after the original (the original features in the two high non-credible claims slightly earlier).\n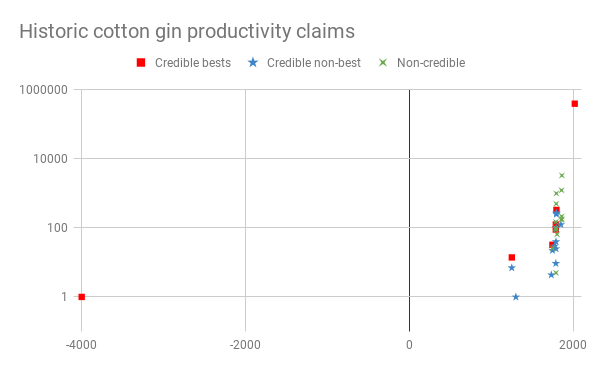Figure 3: Historic claimed cotton gin productivity, all time (zoomed out version of Figure 2)\n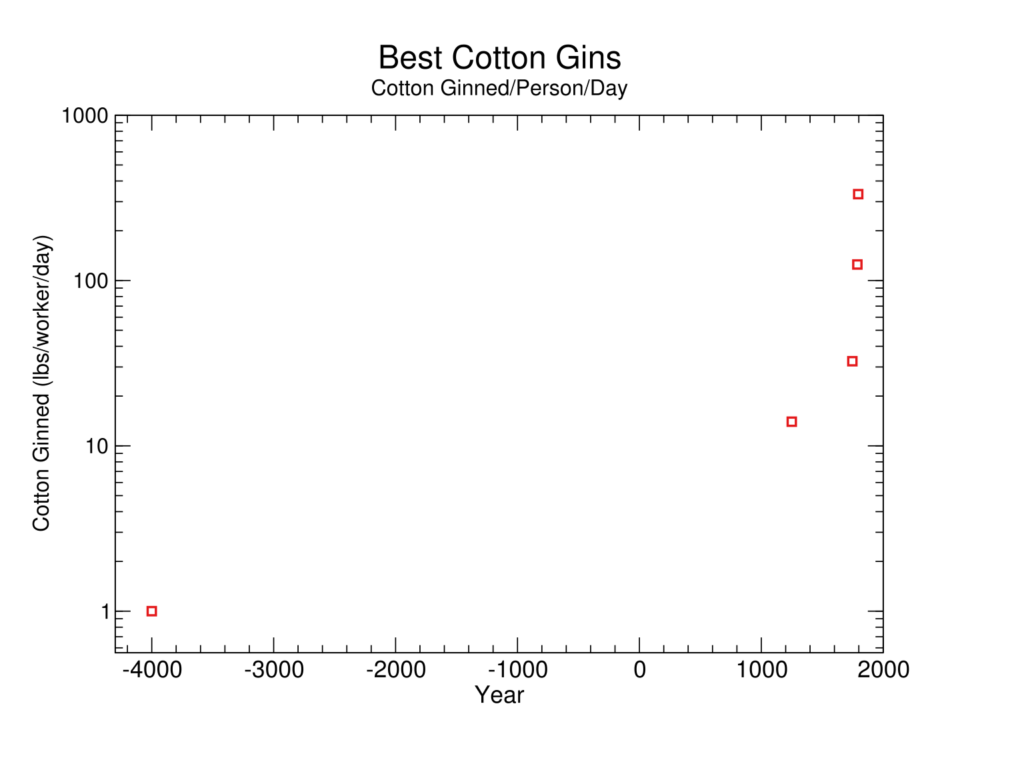Figure 4: Zoom-in on credible best cotton gins (excluding modern era)\n##### **Discontinuity measurement**\n\n\nFor measuring discontinuities, we treat past progress as exponential at each point, but entering a new exponential regime at the fourth point. We confine our investigation to credible records. Given these things, we find the improved Whitney gin to be a 23-year discontinuity over the previous record in this dataset. However the foot gin and Eve’s mill gin appear to be at least one-thousand year discontinuities each.[17](https://aiimpacts.org/effect-of-eli-whitneys-cotton-gin-on-historic-trends-in-cotton-ginning/#easy-footnote-bottom-17-1359 \"See our methodology page page for more details, and our spreadsheet, tab ‘credible record gin calculations’ for our calculations.\"). \n\n\nHowever our data has at least one key gap. Whitney’s original 1793 gin design was almost immediately copied and improved by many people, most notably Hodgen Holmes and Daniel Clark.[18](https://aiimpacts.org/effect-of-eli-whitneys-cotton-gin-on-historic-trends-in-cotton-ginning/#easy-footnote-bottom-18-1359 \"“Mississippi’s first saw gin was constructed in violation of Whitney’s patent rights during the summer of 1795 and put into operation in September. Daniel Clark, Sr., a wealthy planter of Wilkinson County, designed this famous machine after examining drawings made by a traveler who had seen one of Whitney’s gins while on a trip to Georgia.”
Moore, John Hebron. Agriculture in Ante-Bellum Mississippi. Columbia, SC: University of South Carolina Press, 2010, page 21.
In 1796 Hogden Holmes of Augusta, Georgia, patented the adaptation, naming it the saw gin. The suit that followed capped a contentious and socially and legally mediated process from which Eli Whitney emerged as the inventor of the cotton gin.
Lakwete, Angela. Inventing the Cotton Gin: Machine and Myth in Antebellum America. Baltimore, MD: Johns Hopkins University Press, 2003, p47\") The plausible productivity data we have appears to all be for these later variants, which we understand were non-negligibly better than Whitney’s original gin in some way.[19](https://aiimpacts.org/effect-of-eli-whitneys-cotton-gin-on-historic-trends-in-cotton-ginning/#easy-footnote-bottom-19-1359 \"We do have Whitney’s own estimate of his gin’s productivity, but since it is very much larger than estimates of later related gins (see our data), we assume it is an exaggeration:
“Two ginners on the new gin could turn out as much fiber in a day as one hundred foot ginners each averaging twenty-five pounds, in all twenty-five hundred pounds, Whitney estimated.”
Angela Lakwete, Inventing the Cotton Gin: Machine and Myth in Antebellum America (JHU Press, 2003), p49\") So we know that Whitney’s gin should be somewhat lower and two years earlier than our first data for Whitney-style gins. This means at most, Whitney’s original gin would be a 25 year discontinuity. If it accounted for even half of the progress since Eve’s mill gin, and we are not missing further innovations between the two, Whitney’s gin would still represent a 13 year discontinuity, and the later improved version would no longer account for a discontinuity of more than ten years.[20](https://aiimpacts.org/effect-of-eli-whitneys-cotton-gin-on-historic-trends-in-cotton-ginning/#easy-footnote-bottom-20-1359 \"See spreadsheet, ‘Estimate of first Whitney gin discontinuity’.\") It seems likely to us that Whitney’s gin was at least this revolutionary so we think the Whitney gin probably represented a moderate (10-25 year) discontinuity in pounds of cotton ginned per day.\n\n\nWe are fairly uncertain about whether the two larger discontinuities earlier are real, or due to gaps in our data. We did attempt to collect data for these earlier times (rather than just prior to the Whitney gin), but seem very likely to be missing a lot.\n\n\nIn addition to the size of these discontinuities in years, we have tabulated a number of other potentially relevant metrics [here](https://docs.google.com/spreadsheets/d/1iMIZ57Ka9-ZYednnGeonC-NqwGC7dKiHN9S-TAxfVdQ/edit?usp=sharing).[21](https://aiimpacts.org/effect-of-eli-whitneys-cotton-gin-on-historic-trends-in-cotton-ginning/#easy-footnote-bottom-21-1359 \"See our methodology page for more details.\")\n##### **Changes in the rate of progress**\n\n\nOver the history of gin productivity, the average rate of progress became higher. It is unclear whether this happened at a particular point. In our data, it looks as though it happened with the foot gin, in 1747, and that progress went from around .05% per year to around 4% per year (see **[our spreadsheet, tab ‘credible record gin calculations’](https://docs.google.com/spreadsheets/d/1oXOy2cyaSv_9svTXiInlDbOWn1vv6BG19dEQiZk40C8/edit#gid=91839643)**). However our data is too sparse and uncertain to draw firm conclusions from.\n\n\n#### Cost per value of cotton ginned\n\n\nAs discussed above, pounds of cotton ginned per person-day is not a perfect proxy of the value of a cotton gin, and therefore presumably not exactly what cotton-gin users were aiming for. ‘Cost per value of cotton ginned’ seems closer, if we measure costs inclusively and average across various cotton ginning situations. We did not collect data on this, but can make some inferences about the shape of this trend—and in particular whether Whitney’s gin represented a discontinuity—from what we know about the pounds/person-day figures and other aspects of the situation.\n\n\n##### Evidence from the trend in pounds of cotton ginned per person-day\n\n\nWe expect that the pounds of cotton ginned per person-day roughly approximates cost per value of cotton ginned, with the following adjustments that we know of:\n\n\n* Eve’s gin is worse on cost/value than on cotton/person-day because the latter metric doesn’t reflect its large upfront costs.\n* Whitney’s gin may be worse on cost per value than it appears, because of its lower-quality cotton output.\n* Whitney’s gin may be better than it appears, because it could handle short-staple cotton. However this value seems unlikely to have manifest immediately, since it presumably takes time for cotton users to adjust to a new material.\n* Foot gins and barrel gins (e.g. Eve’s) were dangerous to operate, so are worse on cost/value than they appear.\n* Foot gins apparently required especially skilled labor, so are worse on cost/value than they appear.\n* Barrel gins and Eve gins often ran on non-human power-sources, so are worse on cost/value than they appear.[22](https://aiimpacts.org/effect-of-eli-whitneys-cotton-gin-on-historic-trends-in-cotton-ginning/#easy-footnote-bottom-22-1359 \"“The barrel gin used animal and water power, removing humans as a power source but retaining them as seed cotton suppliers. The self-feeding animal-, wind-, or water-powered Eve gin replaced each of the skilled tasks of the inner with mechanical components.” Lakwete, Angela. Inventing the Cotton Gin: Machine and Myth in Antebellum America. Baltimore, MD: Johns Hopkins University Press, 2003, p48\")\n\n\nThese are several considerations in favor of Whitney’s gin representing more progress on cost/value than on cotton/person-day, and one against. However it is unclear to us whether the downside of lower quality cotton was larger than the other considerations combined, so the overall effect on the expected size of discontinuity from Whitney’s gin seems ambiguous, but probably in favor of larger.\n\n\n##### Evidence from takeup of gins\n\n\nThe foot gin persisted for at least sixty years after Whitney’s invention.[23](https://aiimpacts.org/effect-of-eli-whitneys-cotton-gin-on-historic-trends-in-cotton-ginning/#easy-footnote-bottom-23-1359 \"“Instead of being replaced, the foot gin outlasted the barrel gin and remained in use to the mid-1860s.”
Lakwete, Angela. Inventing the Cotton Gin: Machine and Myth in Antebellum America. Baltimore, MD: Johns Hopkins University Press, 2003., 40.\") This suggests that Whitney’s gin wasn’t radically better on cost per value of cotton ginned than its predecessors, at least for some cotton producers.\n\n\nOn the other hand, apparently there was a rush to manufacture copies of Whitney’s gin, so much so that many mechanics became professional gin-makers, and most plantations had one of the new gins within five years. [24](https://aiimpacts.org/effect-of-eli-whitneys-cotton-gin-on-historic-trends-in-cotton-ginning/#easy-footnote-bottom-24-1359 \"“Because the demand for saw gins became very great during the next few years a number of local mechanics embarked upon careers as professional ginwrights. … By [1800] one [of the new gins] could be found on almost every plantation.” Moore, John Hebron. Agriculture in Ante-Bellum Mississippi. Columbia, SC: University of South Carolina Press, 2010 \")\nThis suggests that there were situations for which Whitney’s gin was substantially better than alternatives, and situations for which it was worse. This seems like weak evidence that on average across cotton ginning needs it was not radically better than precursors, though there might be narrower metrics we could define on which it was radically better.\n\n\n##### Evidence from cotton production trends\n\n\nIf the Whitney gin made cotton much cheaper to process, we might expect cotton production at the time to sharply increase. Our impression is that this is a common story about what happened.[25](https://aiimpacts.org/effect-of-eli-whitneys-cotton-gin-on-historic-trends-in-cotton-ginning/#easy-footnote-bottom-25-1359 \"For instance, History.com:
“In 1794, U.S.-born inventor Eli Whitney (1765-1825) patented the cotton gin, a machine that revolutionized the production of cotton by greatly speeding up the process of removing seeds from cotton fiber. By the mid-19th century, cotton had become America’s leading export. Despite its success, the gin made little money for Whitney due to patent-infringement issues. Also, his invention offered Southern planters a justification to maintain and expand slavery even as a growing number of Americans supported its abolition. “
History com Editors, “Cotton Gin and Eli Whitney,” HISTORY, accessed June 18, 2019, https://www.history.com/topics/inventions/cotton-gin-and-eli-whitney.\") However the data we could find on this, seemingly from a 1958 history of early US agriculture, suggests that cotton production was already growing rapidly, and continued on a similar trajectory after Whitney’s invention.[26](https://aiimpacts.org/effect-of-eli-whitneys-cotton-gin-on-historic-trends-in-cotton-ginning/#easy-footnote-bottom-26-1359 \"This spreadsheet of ours contains data from this image, which appears to be taken from History of Agriculture in the Southern United States to 1860, Volume 2, given that the author is the same and it is from the same page in the book. The full citation is:
Gray, Lewis Cecil, and Esther Katherine Thompson. History of Agriculture in the Southern United States to 1860. Peter Smith, 1958.\") See Figure 5.\n\n\nThis dataset begins in 1790, only a few years before Whitney’s invention. This is enough to see that the trend just before 1793 is much like the trend just after, however we can further verify this by looking at earlier cotton export figures (Figure 7).[27](https://aiimpacts.org/effect-of-eli-whitneys-cotton-gin-on-historic-trends-in-cotton-ginning/#easy-footnote-bottom-27-1359 \"We made a rough collection of export and production data from numerous sources. See here. We have not vetted these, and the collection process was not thorough or reliable. However since the figures are fairly consistent, we expect that they are roughly correct.\") Cotton exports appear to closely match overall productivity where the trends overlap, and the pre-1790 export trend appears to be roughly continuous with the rest of the curve, at least if we ignore the aberrantly low 1790 figure. \n\n\n\n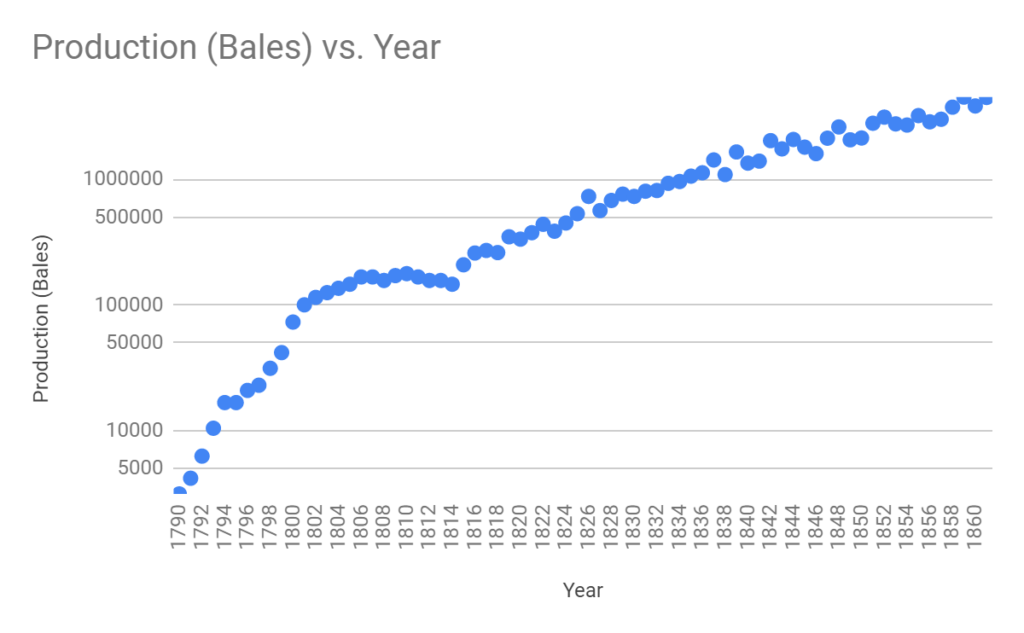Figure 5: historic cotton production (bales), probably from Gray et al 1958[28](https://aiimpacts.org/effect-of-eli-whitneys-cotton-gin-on-historic-trends-in-cotton-ginning/#easy-footnote-bottom-28-1359 \"Gray, Lewis Cecil, and Esther Katherine Thompson. History of Agriculture in the Southern United States to 1860. Peter Smith, 1958.\"), see above for elaboration on source, [data here](https://docs.google.com/spreadsheets/d/1YN2r40TkukftMjzlZWJCz34cOC2KdkHxZVa8CuMQa3M/edit?usp=sharing).\n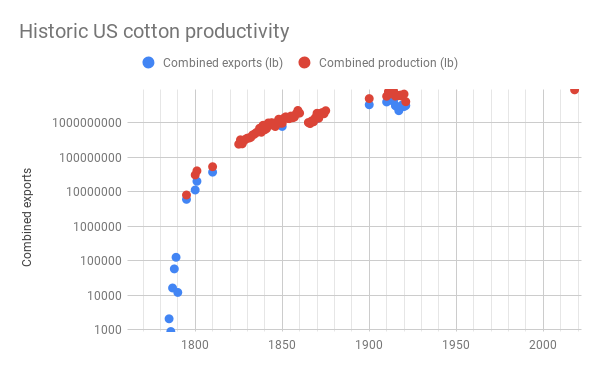Figure 6: Rough collected figures for US cotton exports and production over period from 1780 – 1830, [data and sources here](https://docs.google.com/spreadsheets/d/193D_4nRLvcqX0Z_hso5g3u3z0Ah-BGEWFCjjkjMbwAo/edit?usp=sharing).\n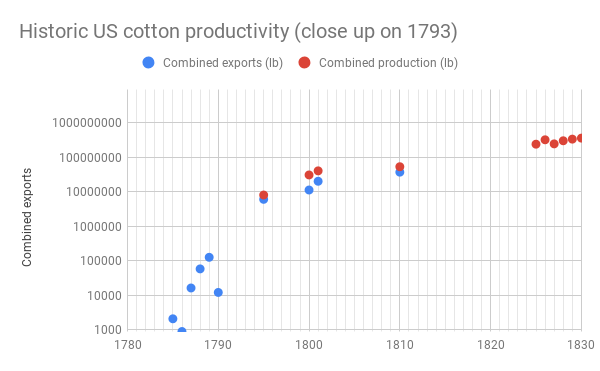Figure 7: close up on relevant years from Figure 6\nThis does not preclude a large change in gin efficacy—perhaps there were other bottlenecks to cotton productivity, or it took time for the gains from Whitney’s gin to manifest in national productivity data. However it does cause us to doubt the story of Whitney’s gin being evidently responsible for massive growth in the cotton industry, which was a reason for suspecting the gin may have represented discontinuous progress. So this is some evidence against Whitney’s gin representing a large discontinuity in cost per value of cotton ginned. \n\n\n##### Evidence from the 1879 evaluation of ginning technology\n\n\nThis [1879 evaluation of ginning technology](https://books.google.com/books?id=lSxAAQAAMAAJ&pg=PA410&lpg=PA410&dq=forbes+watson+cotton+gin&source=bl&ots=UwUDOiYSbu&sig=ACfU3U3qQXoA_RpNsoj9QASWVJ42Zb0ZPg&hl=en&sa=X&ved=2ahUKEwiArO2PyqjhAhWFAXwKHdTjDHYQ6AEwDnoECAgQAQ#v=onepage&q=forbes%20watson%20cotton%20gin&f=false) reports on extensive measurement trials of different cotton gins. It was seemingly conducted to understand why Indian cotton production lagged behind American. The author says all methods for ginning cotton in India were primitive until recently; he hears that in some places it was done by hand as late as 1859.[29](https://aiimpacts.org/effect-of-eli-whitneys-cotton-gin-on-historic-trends-in-cotton-ginning/#easy-footnote-bottom-29-1359 \"“How primitive, till comparatively a few years since, were the means of cleaning the ‘kuppas’ or seed cotton is best shown by the fact that in the accounts of even 20 years ago repeated mention is made in some districts of picking the wool off the seed by hand…” Watson, Forbes. Report on cotton gins and on the cleaning and quality of Indian cotton. London, Allen, 1879.\") This is confusing because if Whitney’s gin really was much better in terms of cost-per-value than the alternatives, it would be surprising if sixty years later the alternatives were still in use. However many alternatives seem clearly more cost-effective than ginning by hand, so this seems like little evidence about Whitney’s gin in particular.\n\n\nThe outputs of the gins in the experiment seem different from (and usually higher than) the outputs for similarly named gins in our dataset. Which might be confusing, but we expect is because there are modest improvements to gin technology over time within particular classes of gin. \n\n\nIn sum, this evidence looks as though it might be informative, but we do not see it as such on consideration.\n\n\n##### Evidence from historians\n\n\nWe have not thoroughly reviewed popular or academic opinions on the discontinuousness of the cotton gin, but our impression is that a common popular view is that Eli Whitney’s cotton gin was a discontinuous improvement over the state-of-the-art. On the other hand Dr Lakwete, author of *Inventing the Cotton Gin*—a book we found most helpful in this project, and that also won an award for being the best scholarly book published about the history of technology[30](https://aiimpacts.org/effect-of-eli-whitneys-cotton-gin-on-historic-trends-in-cotton-ginning/#easy-footnote-bottom-30-1359 \"“Inventing the Cotton Gin won the 2004 Edelstein Prize given by the Society for the History of Technology for the best scholarly book published about the history of technology in the past three years.”
“Angela Lakwete – Department of History – College of Liberal Arts – Auburn University.” Accessed October 27, 2019. https://cla.auburn.edu/history/people/emeritus/angela-lakwete/. \")—disagrees, actually explicitly saying it was continuous (though she may mean something different by this than we do): \n\n\n\n> Collapsing two hundred years of cotton production and roller gin use in North America in to the moment when Eli Whitney invented the toothed gin, Phineas Miller and Judge Johnson marked 1794 as a turning point in southern development. Before, southeners languished without an effective gin for short-staple cotton; afterwards, the cotton economy blossomed. Arguing for discontinuity, the idea allowed the visualization of a moment and a machine that separated the colonial past from the new republic. Continuity, however, marked the history of cotton and the gin in America. Continuity would characterize the first two decades of the nineteenth century, as saw-gin and roller gin makers competed for dominance in the expanding short-staple cotton market.\n> \n> Lakwete, Angela. *Inventing the Cotton Gin: Machine and Myth in Antebellum America*. Baltimore, MD: Johns Hopkins University Press, 2003. , 71.\n\n\n##### Conclusions on cost per value of cotton ginned\n\n\nOn the earlier ‘pounds of cotton ginned per person per day’ metric, we estimated that Whitney’s gin was worth around 10-25 years of past progress. Various considerations suggested Whitney’s gin might have been a bigger deal for overall cost-effectiveness of ginning cotton than that calculation suggested, but the quality of cotton was lower. We took this in total as neutral to weakly favoring Whitney’s gin being better than it seemed. We then saw that the Whitney gin was taken up with enthusiasm by a subset of people needing to gin cotton, that it didn’t seem to recognizably affect the growth of US cotton production, and that at least one historian with particular expertise in this topic thinks that progress was relatively continuous. This does not particularly suggest to us that Whitney’s gin represented a large discontinuity in cost per value of cotton ginned, and seems like some evidence against. \n\n\nNotes\n-----\n\n\n\n\n\n", "url": "https://aiimpacts.org/effect-of-eli-whitneys-cotton-gin-on-historic-trends-in-cotton-ginning/", "title": "Effect of Eli Whitney’s cotton gin on historic trends in cotton ginning", "source": "aiimpacts.org", "source_type": "wordpress", "date_published": "2020-02-07T22:58:55+00:00", "paged_url": "https://aiimpacts.org/feed?paged=9", "authors": ["Katja Grace"], "id": "3c960fe24da58cdf48af7f539e58e89d", "summary": []}
{"text": "Historic trends in flight airspeed records\n\nFlight airspeed records between 1903 and 1976 contained one greater than 10-year discontinuity: a 19-year discontinuity corresponding to the Fairey Delta 2 flight in 1956.\n\n\nThe average annual growth in flight airspeed markedly increased with the Fairey Delta 2, from 16mph/year to 129mph/year. \n\n\nDetails\n-------\n\n\nThis case study is part of AI Impacts’ [discontinuous progress investigation](https://aiimpacts.org/discontinuous-progress-investigation/).\n\n\n### Background\n\n\nFlight airspeed records are measured relative to particular classes of aircraft, with official rules defined by the Fédération Aéronautique Internationale (FAI). is “the highest airspeed attained by any aircraft of a particular class”.[1](https://aiimpacts.org/historic-trends-in-flight-airspeed-records/#easy-footnote-bottom-1-1624 \"“An air speed record is the highest airspeed attained by an aircraft of a particular class. The rules for all official aviation records are defined by Fédération Aéronautique Internationale (FAI),[1] which also ratifies any claims. Speed records are divided into multiple classes with sub-divisions. There are three classes of aircraft: landplanes, seaplanes, and amphibians; then within these classes, there are records for aircraft in a number of weight categories. There are still further subdivisions for piston-engined, turbojet, turboprop, and rocket-engined aircraft. Within each of these groups, records are defined for speed over a straight course and for closed circuits of various sizes carrying various payloads.” “Flight Airspeed Record”. 2019. En.Wikipedia.Org. Accessed May 25 2019. https://en.wikipedia.org/wiki/Flight_airspeed_record.\") \n\n\n### Trends\n\n\n#### Flight airspeed records\n\n\n##### Data\n\n\nWe took data from Wikipedia’s list of flight airspeed records[2](https://aiimpacts.org/historic-trends-in-flight-airspeed-records/#easy-footnote-bottom-2-1624 \"“Flight Airspeed Record”. 2019. En.Wikipedia.Org. Accessed May 25 2019. https://en.wikipedia.org/wiki/Flight_airspeed_record.\") (which we have not verified) and added it to [this spreadsheet](https://docs.google.com/spreadsheets/d/1m7xLC684oPjwnjLGOskV0LyO_JOeQh7G23f55ihPva4/edit?usp=sharing). We understand it to be fastest records across all classes of manned aircraft that are able to take off under their own power, but it is not well explained on the page. We included only official airspeed records. See Figure 1 below. \n\n\n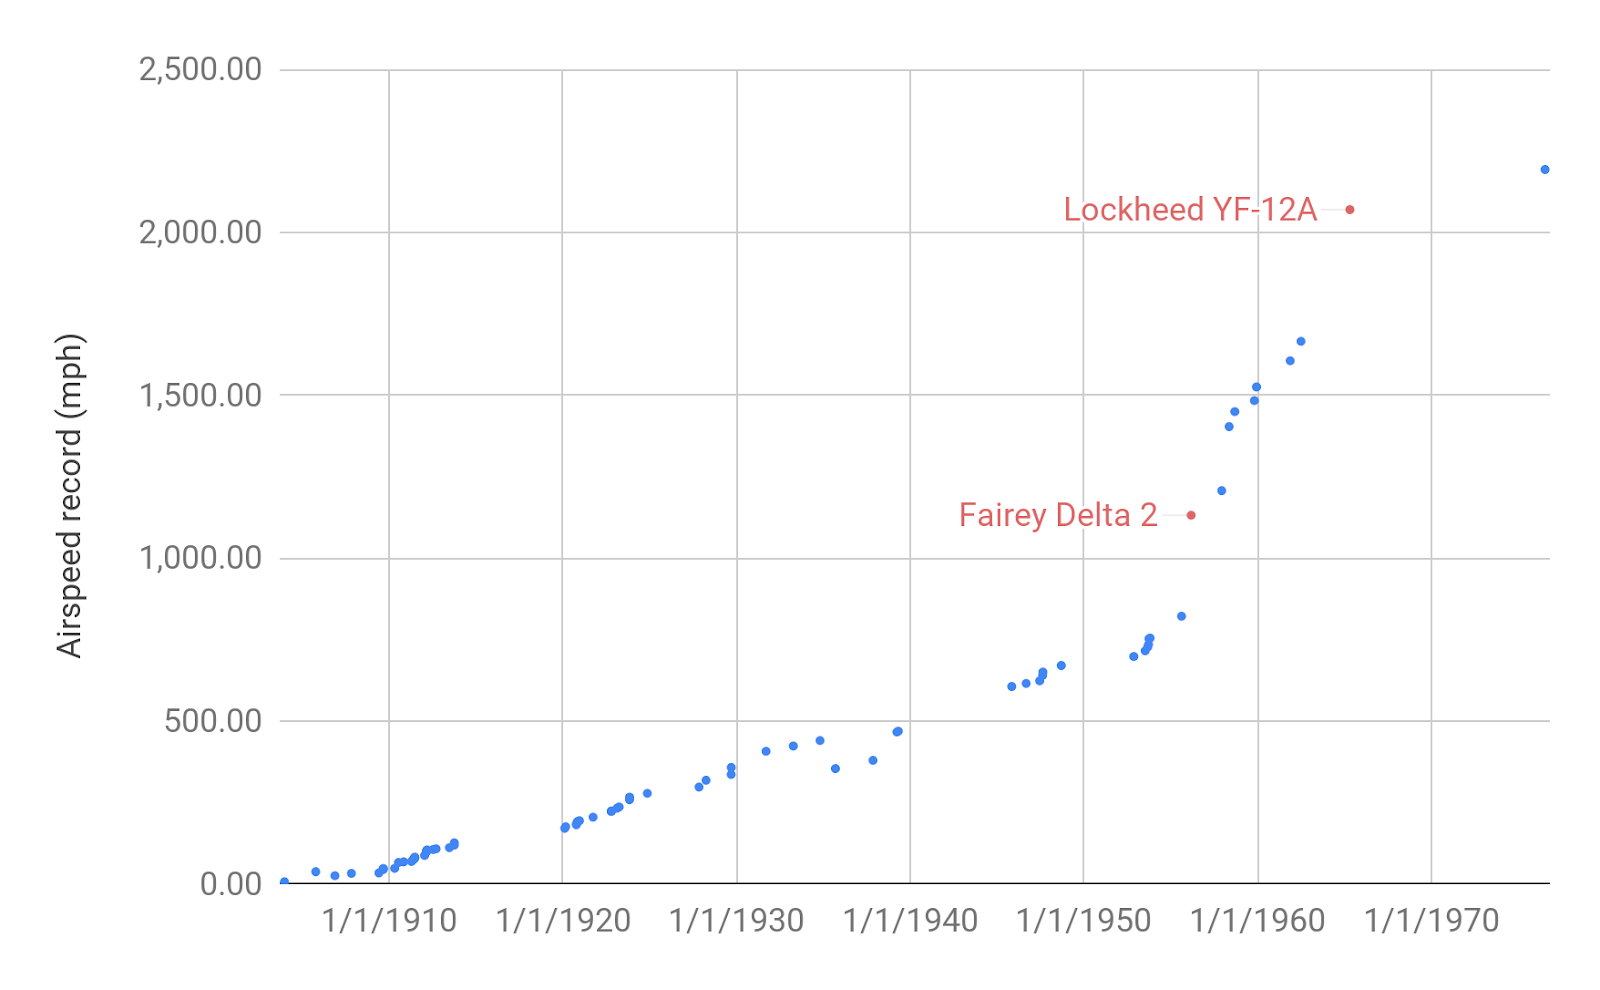**Figure 1:** Flight airspeed records over time\n##### Discontinuity measurement\n\n\nWe treat the data as linear, and once deem it to have begun a new trend, for the purpose of determining the past rate of progress. [3](https://aiimpacts.org/historic-trends-in-flight-airspeed-records/#easy-footnote-bottom-3-1624 \"See our methodology page for more details.\") We calculate the size of discontinuities in [**this spreadsheet**](https://docs.google.com/spreadsheets/d/1m7xLC684oPjwnjLGOskV0LyO_JOeQh7G23f55ihPva4/edit?usp=sharing).[4](https://aiimpacts.org/historic-trends-in-flight-airspeed-records/#easy-footnote-bottom-4-1624 \"See our methodology page for details.\") In 1956, there was a 19-year discontinuity in flight airspeed records with the Fairey Delta 2 flight. \n\n\nWe tabulated a number of other related metrics **[here](https://docs.google.com/spreadsheets/d/1iMIZ57Ka9-ZYednnGeonC-NqwGC7dKiHN9S-TAxfVdQ/edit?usp=sharing)**.[5](https://aiimpacts.org/historic-trends-in-flight-airspeed-records/#easy-footnote-bottom-5-1624 \"See our methodology page for more details.\")\nFigure 2: Fairey Delta 2[6](https://aiimpacts.org/historic-trends-in-flight-airspeed-records/#easy-footnote-bottom-6-1624 \"From Wikimedia Commons: Roland Turner from Birmingham, Great Britain [CC BY-SA 2.0 (https://creativecommons.org/licenses/by-sa/2.0)]\"), whose 1956 record represented a 19 year discontinuity.\n##### Change in the growth rate\n\n\nThe average annual growth in flight airspeed markedly increased at around the time of the Fairey Delta 2. Airspeed records grew by an average of 16mph/year up until the one before Fairey Delta 2, whereas from that point until 1965 they grew by an average of 129mph/year.[7](https://aiimpacts.org/historic-trends-in-flight-airspeed-records/#easy-footnote-bottom-7-1624 \"See spreadsheet for calculations.\") \n\n\nNotes\n-----\n\n\n\n", "url": "https://aiimpacts.org/historic-trends-in-flight-airspeed-records/", "title": "Historic trends in flight airspeed records", "source": "aiimpacts.org", "source_type": "wordpress", "date_published": "2020-02-07T22:47:35+00:00", "paged_url": "https://aiimpacts.org/feed?paged=9", "authors": ["Asya Bergal"], "id": "108314290efba56b32597b0351253556", "summary": []}
{"text": "Comparison of naturally evolved and engineered solutions\n\n*This page describes a project that is in progress, and does not yet have results*\n\n\nWe are comparing naturally evolved and engineered solutions to problems, to learn about regularities that might let us make inferences about artificial intelligence from what we know about naturally evolved intelligence. \n\n\nDetails\n-------\n\n\n### Motivation\n\n\nEngineers and evolution have faced many similar design problems. For instance, the problem of designing an efficient flying machine. Another instance of a design problem that engineers and evolution have both worked on is designing intelligent machines. We hope that by looking at other instances of engineers and evolution working on similar problems, we will be able to learn more about how future AI systems will compare to evolved intelligences.\n\n\n### Methods\n\n\nWe will collect examples of optimization problems that engineers and evolution would perform better on if they could. Here are some candidate examples of such problems: \n\n\n* Flying\n* Hovering\n* Swimming\n* Running\n* Traveling long distances\n* Traveling quickly\n* Jumping\n* Balancing\n* Height of structure\n* Piercing\n* Applying compressive force\n* Striking\n* Tensile strength\n* Pumping blood\n* Breathing\n* Liver function\n* Detecting light\n* Recording light\n* Producing light\n* Detecting sound\n* Recording sound\n* Producing sound\n* Heat insulation\n* Determining chemical composition of a substance\n* Detecting chemical composition in the air\n* Adhesiveness\n* Picking heavy things up\n* Joint activation\n* Elasticity\n* Toxicity\n* Extracting energy from sunlight\n* Storing energy\n\n\nWe will then collect the best solutions we can readily find to these design problems, made by human engineers and by evolution respectively, and quantitative data on their performances. We will try to collect this over time, for engineered solutions. \n\n\n#### Analysis\n\n\nWe will use the data to answer the following questions for different design problems:\n\n\n1. How long does it take engineers to half, match, double, triple, etc. the performance of evolution’s current best designs?\n2. What does the shape of engineers’ performance curve look like around the point where engineers’ solutions first match evolution’s?\n3. How efficient (in terms of performance per energy or mass used) are the first solutions that match evolution’s performance compared to evolution’s best solutions?\n4. How long does it take engineers to find a more efficient solution after finding an equally good solution in terms of absolute performance?\n5. From a design perspective, how similar are engineers’ first equally good solutions to evolution’s best solutions?\n\n\nWe will use patterns in the answers to these questions across technologies to make inferences about the answers for natural and artificial intelligence.\n\n\nIn general, the more similar the answers to these questions turn out to be across design problems, the more strongly we will expect the answers for problems addressed by future AI developments to fit the same patterns. \n\n\nWe expect to make the data publicly available, so that others can check our conclusions, investigate related questions, or use it in other investigations of technology and evolution. \n\n\n", "url": "https://aiimpacts.org/comparison-of-naturally-evolved-and-engineered-solutions/", "title": "Comparison of naturally evolved and engineered solutions", "source": "aiimpacts.org", "source_type": "wordpress", "date_published": "2019-12-25T02:32:01+00:00", "paged_url": "https://aiimpacts.org/feed?paged=9", "authors": ["Katja Grace"], "id": "0ed41120be93c8a3cb9bc5a0ff6d5344", "summary": []}
{"text": "Walsh 2017 survey\n\nToby Walsh surveyed hundreds of experts and non-experts in 2016 and found their median estimates for ‘when a computer might be able to carry out most human professions at least as well as a typical human’ were as follows:\n\n\n\n\n| | | | |\n| --- | --- | --- | --- |\n| Probability of HLMI | | Group of survey respondents | |\n| | AI experts | Robotics experts | Non-experts |\n| 10% | 2035 | 2033 | 2026 |\n| 50% | 2061 | 2065 | 2039 |\n| 90% | 2109 | 2118 | 2060 |\n\n\nDetails\n-------\n\n\nToby Walsh, professor of AI at the University of New South Wales and Technical University of Berlin, conducted a poll of AI experts, robotics experts, and non-experts from late January to early February 2017. The survey focused on the potential automation of various occupations and the arrival of high-level machine intelligence (HLMI). \n\n\n### Survey respondents\n\n\nThere were 849 total survey respondents composing three separate groups: AI experts, robotics experts, and non-experts. \n\n\n\nThe AI experts consisted of 200 authors from two AI conferences: the 2015 meeting of the Association for the Advancement of AI (AAAI) and the 2011 International Joint Conference on AI (IJCAI). \n\n\n\nThe robotics experts consisted of 101 individuals who were either Fellows of the Institute for Electrical and Electronics Engineers (IEEE) Robotics & Automation Society or authors from the 2016 meeting of the IEEE Conference on Robotics & Automation (ICRA). \n\n\n\nThe non-experts consisted of 548 readers of [an article about AI on the website The Conversation](https://theconversation.com/know-when-to-fold-em-ai-beats-worlds-top-poker-players-71713). While it seems data on their possible expertise in AI or robotics was not collected, Walsh writes that “it is reasonable to suppose that most are not experts in AI & robotics, and that they are unlikely to be publishing in the top venues in AI and robotics like IJCAI, AAAI or ICRA” (p. 635). Some additional demographic data was collected and reported (for this survey group only):\n\n\n* **Geographic distribution:** 36% Australia, 29% United States, 7% United Kingdom, 4% Canada, and 24% rest of the world\n* **Education:** 85% have an undergraduate degree or higher\n* **Age:** >33% are 34 or under, 59% are under 44, and 11% are 65 or older\n* **Employment status:** >66% are employed and 25% are in or about to enter higher education\n* **Income:** 40% reported an annual income of >$100,000\n\n\n### Classifying occupations at risk of automation\n\n\nThe first seven survey questions (out of eight total) asked respondents to classify occupations as either at risk of automation in the next two decades or not (binary response). For each occupation, respondents were provided with information about the work involved and skills required. There were 70 total occupations, which came from a previous study that had used a machine learning (ML) classifier to rank them in terms of their risk for automation. These rankings were then used in the present survey: Each question had respondents classify 10 occupations, starting with the five most likely and five least likely at risk of automation according to the ML classifier. This continued through subsequent questions until respondents classified all 70 occupations.\n\n\n### Arrival of high-level machine intelligence (HLMI)\n\n\nThe last survey question asked by what year there would be a 10%, 50%, and 90% chance of HLMI, which was defined as “when a computer might be able to carry out most human professions at least as well as a typical human” (p. 634). For each probability respondents chose from among eight options: 2025, 2030, 2040, 2050, 2075, 2100, After 2100, and Never. Median responses were calculated by interpolating the cumulative distribution function between the two nearest dates.\n\n\n### Results\n\n\n#### Probability of when (in years) HLMI will arrive\n\n\nTable 1 below summarized the median responses and is reproduced here for convenience. \n\n\n\n**Table 1**\n\n\n\n\n| | | | |\n| --- | --- | --- | --- |\n| Probability of HLMI | | Group of survey respondents | |\n| | AI experts | Robotics experts | Non-experts |\n| 10% | 2035 | 2033 | 2026 |\n| 50% | 2061 | 2065 | 2039 |\n| 90% | 2109 | 2118 | 2060 |\n\n\nFigures 1-3 below show the cumulative distribution functions (CDFs) for 10%, 50%, and 90% probability of HLMI (respectively) at different years.\n\n\n\n**Figure 1**\n\n\n\n**Figure 2**\n\n\n\n**Figure 3**\n\n\n#### Occupations at risk of automation\n\n\nTable 2 below contains descriptive statistics about the number of occupations (out of 70 total) classified as being at risk of automation in the next two decades. Confidence intervals (last column) are at the 95% level. It is unclear why the sample size for Non-experts is listed as 473 when earlier in the article the number reported is 548. \n\n\n\n**Table 2**\n\n\n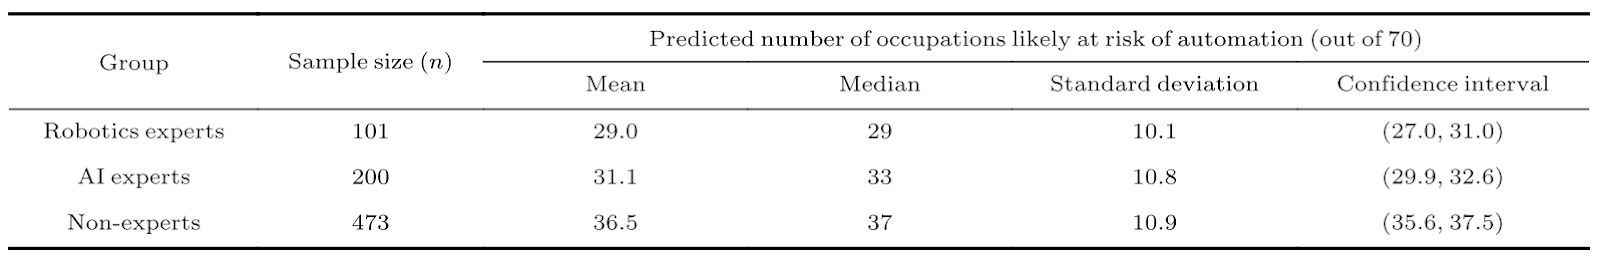\nThe difference in means between the Robotics (29.0) and AI experts (31.1) was not statistically significant (two-sided t-test, p = 0.096), while the differences in means between both expert groups and the non-expert group (36.5) separately were significant (two-sided t-test, both p’s < 0.0001). \n\n\n\nTable 3 below lists some of the largest differences in the proportion of experts (AI and robotics combined) compared to non-experts who classified occupations as at risk for automation. \n\n\n\n**Table 3**\n\n\n\n\n| | | |\n| --- | --- | --- |\n| Occupation | Proportion of respondents predicting risk for automation | |\n| | Experts | Non-experts |\n| Economist | 12% | 39% |\n| Electrical engineer | 6% | 33% |\n| Technical writer | 31% | 54% |\n| Civil engineer | 6% | 30% |\n\n\nFigure 4 below shows that respondents who predicted that HLMI would arrive earlier also classified more occupations as being at risk of automation (and vice versa). \n\n\n\n\n**Figure 4** \n\n\n", "url": "https://aiimpacts.org/walsh-2017-survey/", "title": "Walsh 2017 survey", "source": "aiimpacts.org", "source_type": "wordpress", "date_published": "2019-12-25T02:17:21+00:00", "paged_url": "https://aiimpacts.org/feed?paged=10", "authors": ["Asya Bergal"], "id": "7834b2af942297316938f0829fd4caba", "summary": ["In this survey, AI experts, robotics experts, and the public estimated a 50% chance of high-level machine intelligence (HLMI) by 2061, 2065, and 2039 respectively. The post presents other similar data from the survey."]}
{"text": "Conversation with Adam Gleave\n\nAI Impacts talked to AI safety researcher Adam Gleave about his views on AI risk. With his permission, we have transcribed this interview.\n\n\n**Participants**\n----------------\n\n\n* [Adam Gleave](https://gleave.me/) — PhD student at the Center for Human-Compatible AI, UC Berkeley\n* Asya Bergal – AI Impacts\n* [Robert Long](http://robertlong.online/) – AI Impacts\n\n\n**Summary**\n-----------\n\n\nWe spoke with Adam Gleave on August 27, 2019. Here is a brief summary of that conversation:\n\n\n* Gleave gives a number of reasons why it’s worth working on AI safety:\n\t+ It seems like the AI research community currently isn’t paying enough attention to building safe, reliable systems.\n\t+ There are several unsolved technical problems that could plausibly occur in AI systems without much advance notice.\n\t+ A few additional people working on safety may be extremely high leverage, especially if they can push the rest of the AI research community to pay more attention to important problems.\n* Gleave thinks there’s a ~10% chance that AI safety is very hard in the way that MIRI would argue, a ~20-30% chance that AI safety will almost certainly be solved by default, and a remaining ~60-70% chance that what we’re working on actually has some impact.\n\t+ Here are the reasons for Gleave’s beliefs, weighted by how much they factor into his holistic viewpoint:\n\t\t- 40%: The traditional arguments for risks from AI are unconvincing:\n\t\t\t* Traditional arguments often make an unexplained leap from having superintelligent AIs to superintelligent AIs being catastrophically bad.\n\t\t\t* It’s unlikely that AI systems not designed from mathematical principles are going to inherently be unsafe.\n\t\t\t* They’re long chains of heuristic reasoning, with little empirical validation.\n\t\t\t* Outside view: most fears about technology have been misplaced.\n\t\t- 20%: The AI research community will solve the AI safety problem naturally.\n\t\t- 20%: AI researchers will be more interested in AI safety when the problems are nearer.\n\t\t- 10%: The hard, MIRI version of the AI safety problem is not very compelling.\n\t\t- 10%: AI safety problems that seem hard now will be easier to solve once we have more sophisticated ML.\n* Fast takeoff defined as “GDP will double in 6 months before it doubles in 24 months” is plausible, though Gleave still leans towards slow takeoff.\n* Gleave thinks discontinuous progress in AI is extremely unlikely:\n\t+ There is unlikely to be a sudden important insight dropped into place, since AI has empirically progressed more by accumulation of lots of bags and tricks and compute.\n\t+ There isn’t going to be a sudden influx of compute in the near future, since well-funded organizations are currently already spending billions of dollars to optimize it.\n\t+ If we train impressive systems, we will likely train other systems beforehand that are almost as capable.\n\t+ Given discontinuous progress, the most likely story is that we combine many narrow AI systems in a way where the integrated whole is much better than half of them.\n* Gleave guesses a ~10-20% chance that AGI technology will only be a small difference away from current techniques, and a ~50% chance that AGI technology will be easily comprehensible to current AI researchers:\n\t+ There are fairly serious roadblocks in current techniques right now, e.g. memory, transfer learning, Sim2Real, sample inefficiency.\n\t+ Deep learning is slowing down compared to 2012 – 2013:\n\t\t- Much of the new progress is going to different domains, e.g. deep RL instead of supervised deep learning.\n\t\t- Computationally expensive algorithms will likely hit limits without new insights.\n\t\t\t* Though it seems possible that in fact progress will come from more computationally efficient algorithms.\n\t+ Outside view, we’ve had lots of different techniques for AI over time, so it would be surprising is the current one is the right one for AGI.\n\t+ Pushing more towards current techniques getting to AGI, from an economic point of view, there is a lot of money going into companies whose current mission is to build AGI.\n* Conditional on advanced AI technology being created, Gleave gives a 60-70% chance that it will pose a significant risk of harm without additional safety efforts.\n\t+ Gleave thinks that best case, we drive it down to 20 – 10%, median case, we drive it down to 40 – 30%. A lot of his uncertainty comes from how difficult the problem is.\n* Gleave thinks he could see evidence that could push him in either direction in terms of how likely AI is to be safe:\n\t+ Evidence that would cause Gleave to think AI is less likely to be safe:\n\t\t- Evidence that thorny but speculative technical problems, like inner optimizers, exist.\n\t\t- Seeing more arms race dynamics, e.g. between U.S. and China.\n\t\t- Seeing major catastrophes involving AI, though they would also cause people to pay more attention to risks from AI.\n\t\t- Hearing more solid arguments for AI risk.\n\t+ Evidence that would cause Gleave to think AI is more likely to be safe:\n\t\t- Seeing AI researchers spontaneously focus on relevant problems would make Gleave think that AI is less risky.\n\t\t- Getting evidence that AGI was going to take longer to develop.\n* Gleave is concerned that he doesn’t understand why members of the safety community come to widely different conclusions when it comes to AI safety.\n* Gleave thinks a potentially important question is the extent to which we can successfully influence field building within AI safety.\n\n\nThis transcript has been lightly edited for concision and clarity.\n\n\nTranscript\n----------\n\n\n**Asya Bergal:** We have a bunch of questions, sort of around the issue of– basically, we’ve been talking to people who are more optimistic than a lot of people in the community about AI. The proposition we’ve been asking people to explain their reasoning about is, ‘Is it valuable for people to be expending significant effort doing work that purports to reduce the risk from advanced artificial intelligence?’ To start with, I’d be curious for you to give a brief summary of what your take on that question is, and what your reasoning is. \n\n\n\n**Adam Gleave:** Yeah, sure. The short answer is, yes, I think it’s worth people spending a lot of effort on this, at the margins, it’s still in absolute terms quite a small number. Obviously it depends a bit whether you’re talking about diverting resources of people who are already really dedicated to having a high impact, versus having your median AI researchers work more on safety related things. Maybe you think the median AI researcher isn’t trying to optimize for impact anyway, so the opportunity cost might be lower. The case I see from reducing the risk of AI is maybe weaker than some people in the community, but I think it’s still overall very strong. \n\n\n\nThe goal of AI as a field is still to build artificial general intelligence, or human-level AI. If we’re successful in that, it does seem like it’s going to be an extremely transformative technology. There doesn’t seem to be any roadblock that would prevent us from eventually reaching that goal. The path to that, the timeline is quite murky, but that alone seems like a pretty strong signal for ‘oh, there should be some people looking at this and being aware of what’s going on.’ \n\n\n\nAnd then, if I look at the state of the art in AI, there’s a number of somewhat worrying trends. We seem to be quite good at getting very powerful superhuman systems in narrow domains when we can specify the objective that we want quite precisely. So AlphaStar, AlphaGo, OpenAI Five, these systems are very much lacking in robustness, so you have some quite surprising failure modes. Mostly we see adversarial examples in image classifiers, but some of these RL systems also have somewhat surprising failure modes. This seems to me like an area the AI research community isn’t paying much attention to, and I feel like it’s almost gotten obsessed with producing flashy results rather than necessarily doing good rigorous science and engineering. That seems like quite a worrying trend if you extrapolate it out, because some other engineering disciplines are much more focused on building reliable systems, so I more trust them to get that right by default. \n\n\n\nEven in something like aeronautical engineering where safety standards are very high, there are still accidents in initial systems. But because we don’t even have that focus, it doesn’t seem like the AI research community is going to put that much focus on building safe, reliable systems until they’re facing really strong external or commercial pressures to do so. Autonomous vehicles do have a reasonably good safety track record, but that’s somewhere where it’s very obvious what the risks are. So that’s kinda the sociological argument, I guess, for why I don’t think that the AI research community is going to solve all of the safety problems as far ahead of time as I would like. \n\n\n\nAnd then, there’s also a lot of very thorny technical problems that do seem like they’re going to need to be solved at some point before AGI. How do we get some information about what humans actually want? I’m a bit hesitant to use this phrase ‘value learning’ because you could plausibly do this just by imitation learning as well. But there needs to be some way of getting information from humans into the system, you can’t just derive it from first principles, we still don’t have a good way of doing that. \n\n\n\nThere’s lots of more speculative problems, e.g. inner optimizers. I’m not sure if these problems are necessarily going to be real or cause issues, but it’s not something that we– we’ve not ruled it in or out. So there’s enough plausible technical problems that could occur and we’re not necessarily going to get that much advance notice of, that it seems worrying to just charge ahead without looking into this. \n\n\n\nAnd then to caveat all this, I do think the AI community does care about producing useful technology. We’ve already seen some backlashes against autonomous weapons. People do want to do good science. And when the issues are obvious, there’s going to be a huge amount of focus on them. And it also seems like some of the problems might not actually be that hard to solve. So I am reasonably optimistic that in the default case of there’s no safety community really, things will still work out okay, but it also seems like the risk is large enough that just having a few people working on it can be extremely high leverage, especially if you can push the rest of the AI research community to pay a bit more attention to these problems. \n\n\n\nDoes that answer that question? \n\n\n\n**Asya Bergal:** Yeah, it totally does. \n\n\n\n**Robert Long:** Could you say a little bit more about why you think you might be more optimistic than other people in the safety community? \n\n\n\n**Adam Gleave:** Yeah, I guess one big reason is that I’m still not fully convinced by a lot of the arguments for risks from AI. I think they are compelling heuristic arguments, meaning it’s worth me working on this, but it’s not compelling enough for me to think ‘oh, this is definitely a watertight case’. \n\n\n\nI think the common area where I just don’t really follow the arguments is when you say, ‘oh, you have this superintelligent AI’. Let’s suppose we get to that, that’s already kind of a big leap of faith. And then if it’s not aligned, humans will die. It seems like there’s just a bit of a jump here that no one’s really filled in. \n\n\n\nIn particular it seems like sure, if you have something sufficiently capable, both in terms of intelligence and also access to other resources, it could destroy humanity. But it doesn’t just have to be smarter than an individual human, it has to be smarter than all of humanity potentially trying to work to combat this. And humanity will have a lot of inside knowledge about how this AI system works. And it’s also starting from a potentially weakened position in that it doesn’t already have legal protection, property ownership, all these other things. \n\n\n\nI can certainly imagine there being scenarios unfolding where this is a problem, so maybe you actually give an AI system a lot of power, or it just becomes so, so much more capable than humans that it really is able to outsmart all of us, or it might just be quite easy to kill everyone. Maybe civilization is just much more fragile than we think. Maybe there are some quite easy bio ex-risks or nanotech that you could reason about from first principles. If it turned out that a malevolent but very smart human could kill all of humanity, then I would be more worried about the AI problem, but then maybe we should also be working on the human x-risk problem. So that’s one area that I’m a bit skeptical about, though maybe flushing that argument out more is bad for info-hazard reasons. \n\n\n\nThen the other thing is I guess I feel like there’s a distribution of how difficult the AI safety problem is going to be. So there’s one world where anything that is not designed from mathematical principles is just going to be unsafe– there are going to be failure modes we haven’t considered, these failure modes are only going to arise when the system is smart enough to hurt you, and the system is going to be actively trying to deceive you. So this is I think, maybe a bit of a caricature, but I think this is roughly MIRI’s viewpoint. I think this is a productive viewpoint to inhabit when you’re trying to identify problems, but I think it’s probably not the world we actually live in. If you can solve that version, great, but it seems like a lot of the failure modes that are going to occur with advanced AI systems you’re going to see signs of earlier, especially if you’re actually looking out for them. \n\n\n\nI don’t see much reason for AI progress to be discontinuous in particular. So there’s a lot of empirical records you could bring to bear on this, and it also seems like a lot of commercially valuable interesting research applications are going to require solving some of these problems. You’ve already seen this with value learning, that people are beginning to realize that there’s a limitation to what we can just write a reward function down for, and there’s been a lot more focus on imitation learning recently. Obviously people are solving much narrower versions of what the safety community cares about, but as AI progresses, they’re going to work on broader and broader versions of these problems. \n\n\n\nI guess the general skepticism I have with the arguments, is, a lot of them take the form of ‘oh, there’s this problem that we need to solve and we have no idea how to solve it,’ but forget that we only need to solve that problem once we have all this other treasure trove of AI techniques that we can bring to bear on the problem. It seems plausible that this very strong unsupervised learning is going to do a lot of heavy lifting for us, maybe it’s going to give us a human ontology, it’s going to give us quite a good inductive bias for learning values, and so on. So there’s just a lot of things that might seem a lot stickier than they actually are in practice. \n\n\n\nAnd then, I also have optimism that yes, the AI research community is going to try to solve these problems. It’s not like people are just completely disinterested in whether their systems cause harm, it’s just that right now, it seems to a lot of people very premature to work on this. There’s a sense of ‘how much good can we do now, where nearer to the time there’s going to just be naturally 100s of times more people working on the problem?’. I think there is still value you can do now, in laying the foundations of the field, but that maybe gives me a bit of a different perspective in terms of thinking, ‘What can we do that’s going to be useful to people in the future, who are going to be aware of this problem?’ versus ‘How can I solve all the problems now, and build a separate AI safety community?’. \n\n\n\nI guess there’s also the outside view of just, people have been worried about a lot of new technology in the past, and most of the time it’s worked out fine. I’m not that compelled by this. I think there are real reasons to think that AI is going to be quite different. I guess there’s also just the outside view of, if you don’t know how hard a problem is, you should put a probability distribution over it and have quite a lot of uncertainty, and right now we don’t have that much information about how hard the AI safety problem is. Some problems seem to be pretty tractable, some problems seem to be intractable, but we don’t know if they actually need to be solved or not. \n\n\n\nSo, decent chance– I think I put a reasonable probability, like 10% probability, on the hard-mode MIRI version of the world being true. In which case, I think there’s probably nothing we can do. And I also put a significant probability, 20-30%, on AI safety basically not needing to be solved, we’ll just solve it by default unless we’re completely completely careless. And then there’s this big chunk of probability mass in the middle where maybe what we’re working on will actually have an impact, and obviously it’s hard to know whether at the margin, you’re going to be changing the outcome. \n\n\n\n**Asya Bergal:** I’m curious– I think a lot of people we’ve talked to, some people have said somewhat similar things to what you said. And I think there’s two classic axes on which peoples’ opinions differ. One is this slow takeoff, fast takeoff proposition. The other is whether they think something that looks like current methods is likely to lead to AGI. I’m curious on your take on both those questions. \n\n\n\n**Adam Gleave:** Yeah, sure. So, for slow vs. fast takeoff, I feel like I need to define the terms for people who use them in slightly different ways. I don’t expect there to be a discontinuity, in the sense of, we just see this sudden jump. But I wouldn’t be that surprised if there was exponential growth and quite a high growth rate. I think Paul defines fast takeoff as, GDP will double in six months before it doubles in 24 months. I’m probably mangling that but it was something like that. I think that scenario of fast takeoff seems plausible to me. I probably am still leaning slightly more towards the slow takeoff scenario, but it seems like fast takeoff will be plausible in terms of very fast exponential growth. \n\n\n\nI think a lot of the case for the discontinuous progress argument falls on there being sudden insight that dropped into place, and it doesn’t seem to me like that’s what’s happening in AI, it’s more just a cumulation of lots of bags of tricks and a lot of compute. I also don’t see there being bags of compute falling out of the sky. Maybe if there was another AI winter, leading to a hardware overhang, then you might see sudden progress when AI gets funding again. But right now a lot of very well-funded organizations are spending billions of dollars on compute, including developing new application-specific integrated circuits for AI, so we’re going to be very close to the physical limits there anyway. \n\n\n\nProbably the strongest case I see for discontinuities are the discontinuities you see when you’re training systems. But I just don’t think that’s going to be strong enough, because you’ll train other systems before that’ll be almost as capable. I guess we do see sometimes cases where one technique lets you solve a new class of problems. \n\n\n\nMaybe you could see something where you get increasingly capable narrow systems, and there’s not a discontinuity overall, you already had very strong narrow AI. But eventually you just have so many narrow AI systems that they can basically do everything, and maybe you get to a stage where the integrated whole of those is much stronger than if you just had half of them, let’s say. I guess this is sort of the comprehensive AI services model. But again that seems a bit unlikely to me, because most of the time you can probably outsource some other chunks to humans if you really needed to. But yeah, I think it’s a bit more plausible than some of the other stories. \n\n\n\nAnd then, in terms of whether I think current techniques are likely to get us to human-level AI– I guess I put significant probability mass on that depending on how narrowly you define it. One fuzzy definition is that a PhD thesis describing AGI being something that a typical AI researcher today could read and understand without too much work. Under this definition I’d assign 40 – 50%. And that could still include introducing quite a lot of new techniques, right, but just– I mean plausibly I think something based on deep learning, deep RL, you could describe to someone in the 1970s in a PhD thesis and they’d still understand it. But it’s just showing you, it’s not that much real theory that was developed, it was applying some pretty simple algorithms and a lot of compute in the right way. Which implies no huge new theoretical insights. \n\n\n\nBut if we’re defining it more narrowly, only allowing small variants of current techniques, I think that’s much less likely to lead to AGI: around 10-20%. I think that case is almost synonymous with the argument that you just need more compute, because it seems like there are so many things right now that we really cannot do: we still don’t have great solutions to memory, we still can’t really do transfer learning, Sim2Real just barely works sometimes. We’re still extremely sample inefficient. It just feels like all of those problems are going to require quite a lot of research in themselves. I can’t see there being one simple trick that would solve all of them. But maybe, current algorithms if you gave them 10000x compute would do a lot better on these, that is somewhat plausible. \n\n\n\nAnd yeah, I do put fairly significant probability, 50%, on it being something that is kind of radically different. And I guess there’s a couple of reasons for that. One is, just trying to extrapolate progress forward, it does seem like there are some fairly serious roadblocks. Deep learning is slowing down in terms of, it’s not hitting as many big achievements as it was in the past. And also just AI has had many kinds of fads over time, right. We’ve had good old-fashioned AI, symbolic AI, we had expert systems, we had Bayesianism. It would be sort of surprising that the current method is the right one. \n\n\n\nI don’t find that people are focusing on these techniques is necessarily particularly strong evidence that these systems are going to lead us to AGI. First, many researchers are not focused on AGI, and you can probably get useful applications out of current techniques. Second, AI research seems like it can be quite fashion driven. Obviously, there are organizations whose mission is to build AGI who are working within the current paradigm. And I think it is probably still the best bet, of the things that we know, but I still think it’s a bet that’s reasonably unlikely to pay off. \n\n\n\nDoes that answer your question? \n\n\n\n**Asya Bergal:** Yeah. \n\n\n\n**Robert Long:** Just on that last bit, you said– I might just be mixing up the different definitions you had and your different credences in those– but in the end there you said that’s a bet that you think is reasonably unlikely to pay off, but you’d also said 50% that it’s something radically different, so how– I think I was just confusing which ones you were on. \n\n\n\n**Adam Gleave:** Right. So, I guess these definitions are all quite fuzzy, but I was saying 10-20% that something that is only a small difference away from current techniques would build AGI, and 50% that AGI was going to be comprehensible to us. I guess the distinction I’m trying to draw is the narrow one, which I give 10-20% credence, is we basically already have the right algorithms and we just need a few tricks and more compute. And the other more expansive definition, which I give 40-50% credence to, is allows for completely different algorithms, but excludes any deep theoretical insight akin to a whole new field of mathematics. So we might not be using back propagation any longer, we might not be using gradient descent, but it’ll be something similar — like the difference between gradient descent and evolutionary algorithms. \n\n\n\nThere’s a separate question of, if you’re trying to build AGI right now, where should you be investing your resources? Should you be trying to come up with a completely new novel theory, or should you be trying to scale up current techniques? And I think it’s plausible that you should just be trying to scale up techniques and figure out if we can push them forward, because trying to come up with a completely new way of doing AI is also very challenging, right. It’s not really a sort of insight you can force. \n\n\n\n**Asya Bergal:** You kind of covered this earlier– and maybe you even said the exact number, so I’m sorry if this is a repeat. But one thing we’ve been asking people is the credence that without additional intervention– so imagining a world where EA wasn’t pushing for AI safety, and there wasn’t this separate AI safety movement outside of the AI research community, imagining that world. In that world, what is the chance that advanced artificial intelligence poses a significant risk of harm? \n\n\n\n**Adam Gleave:** The chance it does cause a significant risk of harm? \n\n\n\n**Asya Bergal:** Yeah, that’s right. \n\n\n\n**Adam Gleave:** Conditional on advanced artificial intelligence being created, I think 60, 70%. I have a much harder time giving an unconditional probability, because there are other things that could cause humanity to stop developing AI. Is a conditional probability good enough, or do you want me to give an unconditional one? \n\n\n\n**Asya Bergal:** No, I think the conditional one is what we’re looking for. \n\n\n\n**Robert Long:** Do you have a hunch about how much we can expect dedicated efforts to drive down that probability? That is, the EA-focused AI safety efforts. \n\n\n\n**Adam Gleave:** I think the best case is, you drive it down to 20 – 10%. I’m kind of picturing a lot of this uncertainty coming from just, how hard is the problem technically? And if we do inhabit this really hard version where you have to solve all of the problems perfectly and you have to have a formally verified AI system, I just don’t think we’re going to do that in time. You’d have to solve a very hard coordination problem to stop people developing AI without those safety checks. It seems like a very expensive process, developing safe AI. \n\n\n\nI guess the median case, where the AI safety community just sort of grows at its current pace, I think maybe that gets it down to 40 – 30%? But I have a lot of uncertainty in these numbers. \n\n\n\n**Asya Bergal:** Another question, going back to original statements for why you believe this– do you think there’s plausible concrete evidence that we could get or are likely to get that would change your views on this one direction or the other? \n\n\n\n**Adam Gleave:** Yeah, so, seeing evidence of some of the more thorny but currently quite speculative technical problems, like inner optimizers, would make me update towards, ‘oh, this is just a really hard technical problem, and unless we really work hard on this, the default outcome is definitely going to be bad’. Right now, no one’s demonstrated an inner optimizer existing, it’s just a sort of theoretical problem. This is a bit of an unfair thing to ask in some sense, in that the whole reason that people are worried about this is that it’s only a problem with very advanced AI systems. Maybe I’m asking for evidence that can’t be provided. But relative to many other people, I am unconvinced by heuristic arguments appealing just to mathematical intuitions. I’m much more convinced either by very solid theoretical arguments that are proof-based, or by empirical evidence. \n\n\n\nAnother thing that would update me in a positive direction, as in AI seems less risky, would be seeing more AI researchers spontaneously focus on some relevant problems. There’s already, I guess this is a bit of a tangent, but I think maybe– people tend to conceive as the AI safety community as people who would identify as AI safety researchers. But I think the vast majority of AI safety research work is happening by people who have never heard of AI safety, but they have been working on related problems. This is useful to me all of the time. I think where we could plausibly end up having a lot more of this work happening without AI safety ever really becoming a thing is people realizing ‘oh, I want my robot to do this thing and I have a really hard time making it do that, let’s come up with a new imitation learning technique’. \n\n\n\nBut yeah, other things that could update me positively… I guess, AI seeming like a harder problem, as in, it seems like AI, general artificial intelligence is further away, that would probably update me in a positive direction. It’s not obvious but I think generally all else being equal, longer timelines is going to generally have more time to diagnose problems. And also it seems like the current set of AI techniques — deep learning and very data-driven approaches — are particularly difficult to analyze or prove anything about, so some other paradigm is probably going to be better, if possible. \n\n\n\nOther things that would make me scared would be more arms race dynamics. It’s been very sad to me what we’re seeing with China – U.S. arms race dynamics around AI, especially since it doesn’t even seem like there is much direct competition, but that meme is still being pushed for political reasons. \n\n\n\nAny actual major catastrophes involving AI would make me think it’s more risky, although it would also make people pay more attention to AI risk, so I guess it’s not obvious what direction it would push overall. But it certainly would make me think that there’s a bit more technical risk. \n\n\n\nI’m trying to think if there’s anything else that would make more pessimistic. I guess just more solid arguments for AI safety, because a lot of my skepticism is coming from there’s just this very unlikely sounding set of ideas, and there are just heuristic arguments that I’m convinced enough by to work on the problem, but not convinced by enough to say, this is definitely going to happen. And if there was a way to patch some of the holes in those arguments, then I probably would be more convinced as well. \n\n\n\n**Robert Long:** Can I ask you a little bit more about evidence for or against AGI being a certain distance away? You mentioned that as evidence that would change your mind. What sort of evidence do you have in mind? \n\n\n\n**Adam Gleave:** Sure, so I guess a lot of the short timelines scenarios basically are coming from current ML techniques scaling to AGI, with just a bit more compute. So, watching for if those milestones are being achieved at the rate I was expecting, or slower. \n\n\n\nThis is a little bit hard to crystallize, but I would say right now it seems like the rate of progress is slowing down compared to something like 2012, 2013. And interestingly, I think a lot of the more interesting progress has come from, I guess, from going to different domains. So we’ve seen maybe a little bit more progress happening in deep RL compared to supervised deep learning. And the optimistic thing is to say, well, that’s because we’ve solved supervised learning, but we haven’t really. We’ve got superhuman performance on ImageNet, but not on real images that you just take on your mobile phone. And it’s still very sample inefficient, we can’t do few-shot learning well. Sometimes it seems like there’s a lack of interest on the part of the research community in solving some of these problems. I think it’s partly because no one has a solid angle of attack on solving these problems. \n\n\n\nSimilarly, while some of the recent progress in deep RL has been very exciting, it seems to have some limits. For example, AlphaStar and OpenAI Five both involved scaling up self-play and population based training. These were hugely computationally expensive, and that was where a lot of the scaling was coming from. So while there have been algorithmic improvements, I don’t see how you get this working in much more complicated environments without either huge additional compute or some major insights. These are things that are pushing me towards thinking deep learning will not continue to scale, and therefore very short timelines are unlikely. \n\n\n\nSomething that would update me towards shorter timelines would be if something that I thought was impossible turns out to be very easy. So OpenAI Five did update me positively, because I just didn’t think PPO was going to work well in Dota and it turns out that it does if you have enough compute. I don’t think it updated me that strongly towards short timelines, because it did need a lot of compute, and if you scale it to a more complex game you’re going to have exponential scaling. But it did make me think, well, maybe there isn’t a deep insight required, maybe this is going to be much more about finding more computationally efficient algorithms rather than lots of novel insights. \n\n\n\nI guess there’s also sort of economic factors– I mention mostly because I often see people neglecting them. One thing that makes me bullish on short timelines is that, there’s some very well-resourced companies whose mission is to build AGI. OpenAI just raised a billion, DeepMind is spending considerable resources. As long as this continues, it’s going to be a real accelerator. But that could go away: if AI doesn’t start making people money, I expect another AI winter. \n\n\n\n**Robert Long:** One thing we’re asking people, and again I think you’ve actually already given us a pretty good sense of this, is just a relative weighting of different considerations. And as I say that, you actually have already been tagging this. But just to half review, from what I’ve scrawled down. A lot of different considerations in your relative optimism are: cases for AI as an x-risk being not as watertight as you’d like them, arguments for failure modes being the default and really hard, not being sold on those arguments, ideas that these problems might become easier to solve the closer we get to AGI when we have more powerful techniques, and then the general hope that people will try to solve them as we get closer to AI. Yeah, I think those were at least some of the main considerations I got. How strong relatively are those considerations in your reasoning? \n\n\n\n**Adam Gleave:** I’m going to quote numbers that may not add up to 100, so we’ll have to normalize it at the end. I think the skepticism surrounding AI x-risk arguments is probably the strongest consideration, so I would put maybe 40% of my weight on that. This is because the outside view is quite strong to me, so if you talk about this very big problem that there’s not much concrete evidence for, then I’m going to be reasonably optimistic that actually we’re wrong and there isn’t a big problem. \n\n\n\nThe second most important thing to me is the AI research community solving this naturally. We’re already seeing signs of a set of people beginning to work on related problems, and I see this continuing. So I’m putting 20% of my weight on that. \n\n\n\nAnd then, the hard version of AI safety not seeming very likely to me, I think that’s 10% of the weight. This seems reasonably important if I buy into the AI safety argument in general, because that makes a big difference in terms of how tractable these problems are. What were the other considerations you listed? \n\n\n\n**Robert Long:** Two of them might be so related that you already covered them, but I had distinguished between the problems getting easier the closer we get, and people working more on them the closer we get. \n\n\n\n**Adam Gleave:** Yeah, that makes sense. I think I don’t put that much weight on the problems getting easier. Or I don’t directly put weight on it, maybe it’s just rolled into my skepticism surrounding AI safety arguments, because I’m going to naturally find an argument a bit uncompelling if you say ‘we don’t know how to properly model human preferences’. I’m going to say, ‘Well, we don’t know how to properly do lots of things humans can do right now’. So everything needs to be relative to our capabilities. Whereas I find arguments of the form ‘we can solve problems that humans can’t solve, but only when we know how to specify what those problems are’, that seems more compelling, that’s talking about a relative strength between ability to optimize vs. ability to specify objectives. Obviously that’s not the only AI safety problem, but it’s a problem. \n\n\n\nSo yeah, I think I’m putting a lot of the weight on people paying more attention to these problems over time, so that’s probably actually 15 – 20% of my weight. And then I’ll put 5% on the problems getting easier and then some residual probability mass on things I haven’t thought about or haven’t mentioned in this conversation. \n\n\n\n**Robert Long:** Is there anything you wish we had asked that you would like to talk about? \n\n\n\n**Adam Gleave:** I guess, I don’t know if this is really useful, but I do wish I had a better sense of what other people in the safety community and outside of it actually thought and why they were working on it, so I really appreciate you guys doing these interviews because it’s useful to me as well. I am generally a bit concerned about lots of people coming to lots of different conclusions regarding how pessimistic we should be, regarding timelines, regarding the right research agenda. \n\n\n\nI think disagreement can be healthy because it’s good to explore different areas. The ideal thing would be for us to all converge to some common probability distribution and we decide we’re going to work on different areas. But it’s very hard psychologically to do this, to say, ‘okay, I’m going to be the person working on this area that I think isn’t very promising because at the margin it’s good’– people don’t work like that. It’s better if people think, ‘oh, I am working on the best thing, under my beliefs’. So having some diversity of beliefs is good. But it bothers me that I don’t know why people have come to different conclusions to me. If I understood why they disagree, I’d be happier at least. \n\n\n\nI’m trying to think if there’s anything else that’s relevant… yeah, so I guess another, this is merely just a question for you guys to maybe think about, is, I’m still unsure about how valuable field-building should be. And in particular, to what extent AI safety researchers should be working on this. It seems like a lot of reasons why I was optimistic assume the the AI research community is going to solve some of these problems naturally. A natural follow up to that is to ask whether we should be doing something to encourage this to happen, like writing more position papers, or just training up more grad students? Should we be trying to actively push for this rather than just relying on people to organically develop an interest in this research area? And I don’t know whether you can actually change research directions in this way, because it’s very far outside my area of expertise, but I’d love someone to study it.\n\n", "url": "https://aiimpacts.org/conversation-with-adam-gleave/", "title": "Conversation with Adam Gleave", "source": "aiimpacts.org", "source_type": "wordpress", "date_published": "2019-12-24T03:08:20+00:00", "paged_url": "https://aiimpacts.org/feed?paged=10", "authors": ["Asya Bergal"], "id": "de3ad4b35ccf297b65697cb7816b4c7d", "summary": ["Adam finds the traditional arguments for AI risk unconvincing. First, it isn't clear that we will build an AI system that is so capable that it can fight all of humanity from its initial position where it doesn't have any resources, legal protections, etc. While discontinuous progress in AI could cause this, Adam doesn't see much reason to expect such discontinuous progress: it seems like AI is progressing by using more computation rather than finding fundamental insights. Second, we don't know how difficult AI safety will turn out to be; he gives a probability of ~10% that the problem is as hard as (a caricature of) MIRI suggests, where any design not based on mathematical principles will be unsafe. This is especially true because as we get closer to AGI we'll have many more powerful AI techniques that we can leverage for safety. Thirdly, Adam does expect that AI researchers will eventually solve safety problems; they don't right now because it seems premature to work on those problems. Adam would be more worried if there were more arms race dynamics, or more empirical evidence or solid theoretical arguments in support of speculative concerns like inner optimizers. He would be less worried if AI researchers spontaneously started to work on relative problems (more than they already do).\n\nAdam makes the case for AI safety work differently. At the highest level, it seems possible to build AGI, and some organizations are trying very hard to build AGI, and if they succeed it would be transformative. That alone is enough to justify some effort into making sure such a technology is used well. Then, looking at the field itself, it seems like the field is not currently focused on doing good science and engineering to build safe, reliable systems. So there is an opportunity to have an impact by pushing on safety and reliability. Finally, there are several technical problems that we do need to solve before AGI, such as how we get information about what humans actually want.\n\nAdam also thinks that it's 40-50% likely that when we build AGI, a PhD thesis describing it would be understandable by researchers today without too much work, but ~50% that it's something radically different. However, it's only 10-20% likely that AGI comes only from small variations of current techniques (i.e. by vastly increasing data and compute). He would see this as more likely if we hit additional milestones by investing more compute and data (OpenAI Five was an example of such a milestone)."]}
{"text": "Historic trends in ship size\n\n***This page may be out-of-date. Visit the [updated version of this page](https://wiki.aiimpacts.org/doku.php?id=takeoff_speed:continuity_of_progress:historic_trends_in_ship_size) on our [wiki](https://wiki.aiimpacts.org/doku.php?id=start).*** \n \nTrends for ship tonnage (builder’s old measurement) and ship displacement for Royal Navy first rate line-of-battle ships saw eleven and six discontinuities of between ten and one hundred years respectively during the period 1637-1876, if progress is treated as linear or exponential as usual. There is a hyperbolic extrapolation of progress such that neither measurement sees any discontinuities of more than ten years.\n\n\nWe do not have long term data for ship size in general, however the SS *Great Eastern* seems to have represented around 400 years of discontinuity in both tonnage (BOM) and displacement if we use Royal Navy ship of the line size as a proxy, and exponential progress is expected, or 11 or 13 in the hyperbolic trend. This discontinuity appears to have been the result of some combination of technological innovation and poor financial decisions.\n\n\nDetails\n-------\n\n\nThis case study is part of AI Impacts’ [discontinuous progress investigation](https://aiimpacts.org/discontinuous-progress-investigation/).\n\n\n### Background\n\n\nAccording to Wikipedia, naval tactics in the age of sail rewarded larger ships, because larger ships were harder to sink and could carry more guns, and battles were usually lengthy affairs in which two lines of ships fired at each other until one side surrendered.[1](https://aiimpacts.org/historic-trends-in-ship-size/#easy-footnote-bottom-1-1385 \"“One consequence of the line of battle was that a ship had to be strong enough to stand in it. In the old type of mêlée battle a small ship could seek out an opponent of her own size, or combine with others to attack a larger one. As the line of battle was adopted, navies began to distinguish between vessels that were fit to form parts of the line in action, and the smaller ships that were not. By the time the line of battle was firmly established as the standard tactical formation during the 1660s, merchant ships and lightly armed warships became less able to sustain their place in a pitched battle. In the line of battle, each ship had to stand and fight the opposing ship in the enemy line, however powerful she might be. The purpose-built ships powerful enough to stand in the line of battle came to be known as a ship of the line.”
“Sailing Ship Tactics.” Wikipedia. February 08, 2019. Accessed April 23, 2019. https://en.wikipedia.org/wiki/Sailing_ship_tactics.\") [2](https://aiimpacts.org/historic-trends-in-ship-size/#easy-footnote-bottom-2-1385 \"See these three pages for more on battle tactics during this period.\") Our understanding is that when steamships and iron-clad ships appeared, financial constraints sometimes prevented navies from building ships as big as technically possible, but the incentives towards bigger ships remained, since the best way to punch through heavy armor was to carry heavy guns, which required a big ship.[3](https://aiimpacts.org/historic-trends-in-ship-size/#easy-footnote-bottom-3-1385 \"“the only effective weapons against a big ship were big guns, which required a big ship to carry them.”
.jpg\\\")
“Naval Gazing Main/A Brief History of the Destroyer.” Accessed October 26, 2019. https://www.navalgazing.net/A-Brief-History-of-the-Destroyer. \") \n\n\nFigure 1: A Royal Navy First-Rate Ship of the Line[4](https://aiimpacts.org/historic-trends-in-ship-size/#easy-footnote-bottom-4-1385 \"From Wikimedia Commons.
Creator: John Cantiloe Joy [Public domain]\")\n### Trends\n\n\n#### Royal Navy first-rate line-of-battle ships ‘tonnage’ (BOM)\n\n\n[‘Tonnage’ (BOM)](https://en.wikipedia.org/wiki/Builder%27s_Old_Measurement) is a pre-20th century measure of ship cargo capacity.[5](https://aiimpacts.org/historic-trends-in-ship-size/#easy-footnote-bottom-5-1385 \"“Builder’s Old Measurement (BOM, bm, OM, and o.m.) is the method used in England from approximately 1650 to 1849 for calculating the cargo capacity of a ship.”
“Builder’s Old Measurement.” Wikipedia. December 27, 2018. Accessed April 22, 2019. https://en.wikipedia.org/wiki/Builder’s_Old_Measurement. \") It is calculated as:\n\n\n\nWe use it because that’s what we have data on; [displacement](https://en.wikipedia.org/wiki/Displacement_(ship)), the modern way of calculating ship weight, was not widely recorded until towards the end of our dataset. Unfortunately, BOM seems to be less accurate for estimating the cargo capacity of ships after 1860, which could affect some of the findings in the report. However, our [Spot check](https://aiimpacts.org/feed/?paged=10#spot-check) section goes into more detail about this and offers some evidence that this choice of metric isn’t responsible for producing the largest discontinuity as an uninteresting artifact.\n\n\n##### Data\n\n\nFigure 2 shows ship [‘tonnage’ (BOM)](https://en.wikipedia.org/wiki/Builder%27s_Old_Measurement) over time for UK Royal Navy first-rate line-of-battle ships, according to Wikipedia contributors Toddy1 and Morn The Gorn.[6](https://aiimpacts.org/historic-trends-in-ship-size/#easy-footnote-bottom-6-1385 \"“File: Weight Growth of RN First Rate Line-of-Battle Ships 1630-1875.Svg.” In Wikipedia. Accessed October 26, 2019. https://de.wikipedia.org/wiki/Datei:Weight_Growth_of_RN_First_Rate_Line-of-Battle_Ships_1630-1875.svg.\") [This spreadsheet](https://docs.google.com/spreadsheets/d/1iUTwqlafTPd74MEG8w9rHyTYFKLwg2MsBI4-I8bC5Us/edit?usp=sharing) contains their data. We have not vetted it thoroughly, but have spot-checked it (see [Spot check](https://aiimpacts.org/feed/?paged=10#spot-check) section below). We extract the record-breaking subset of ships (see Figure 3).\n\n\n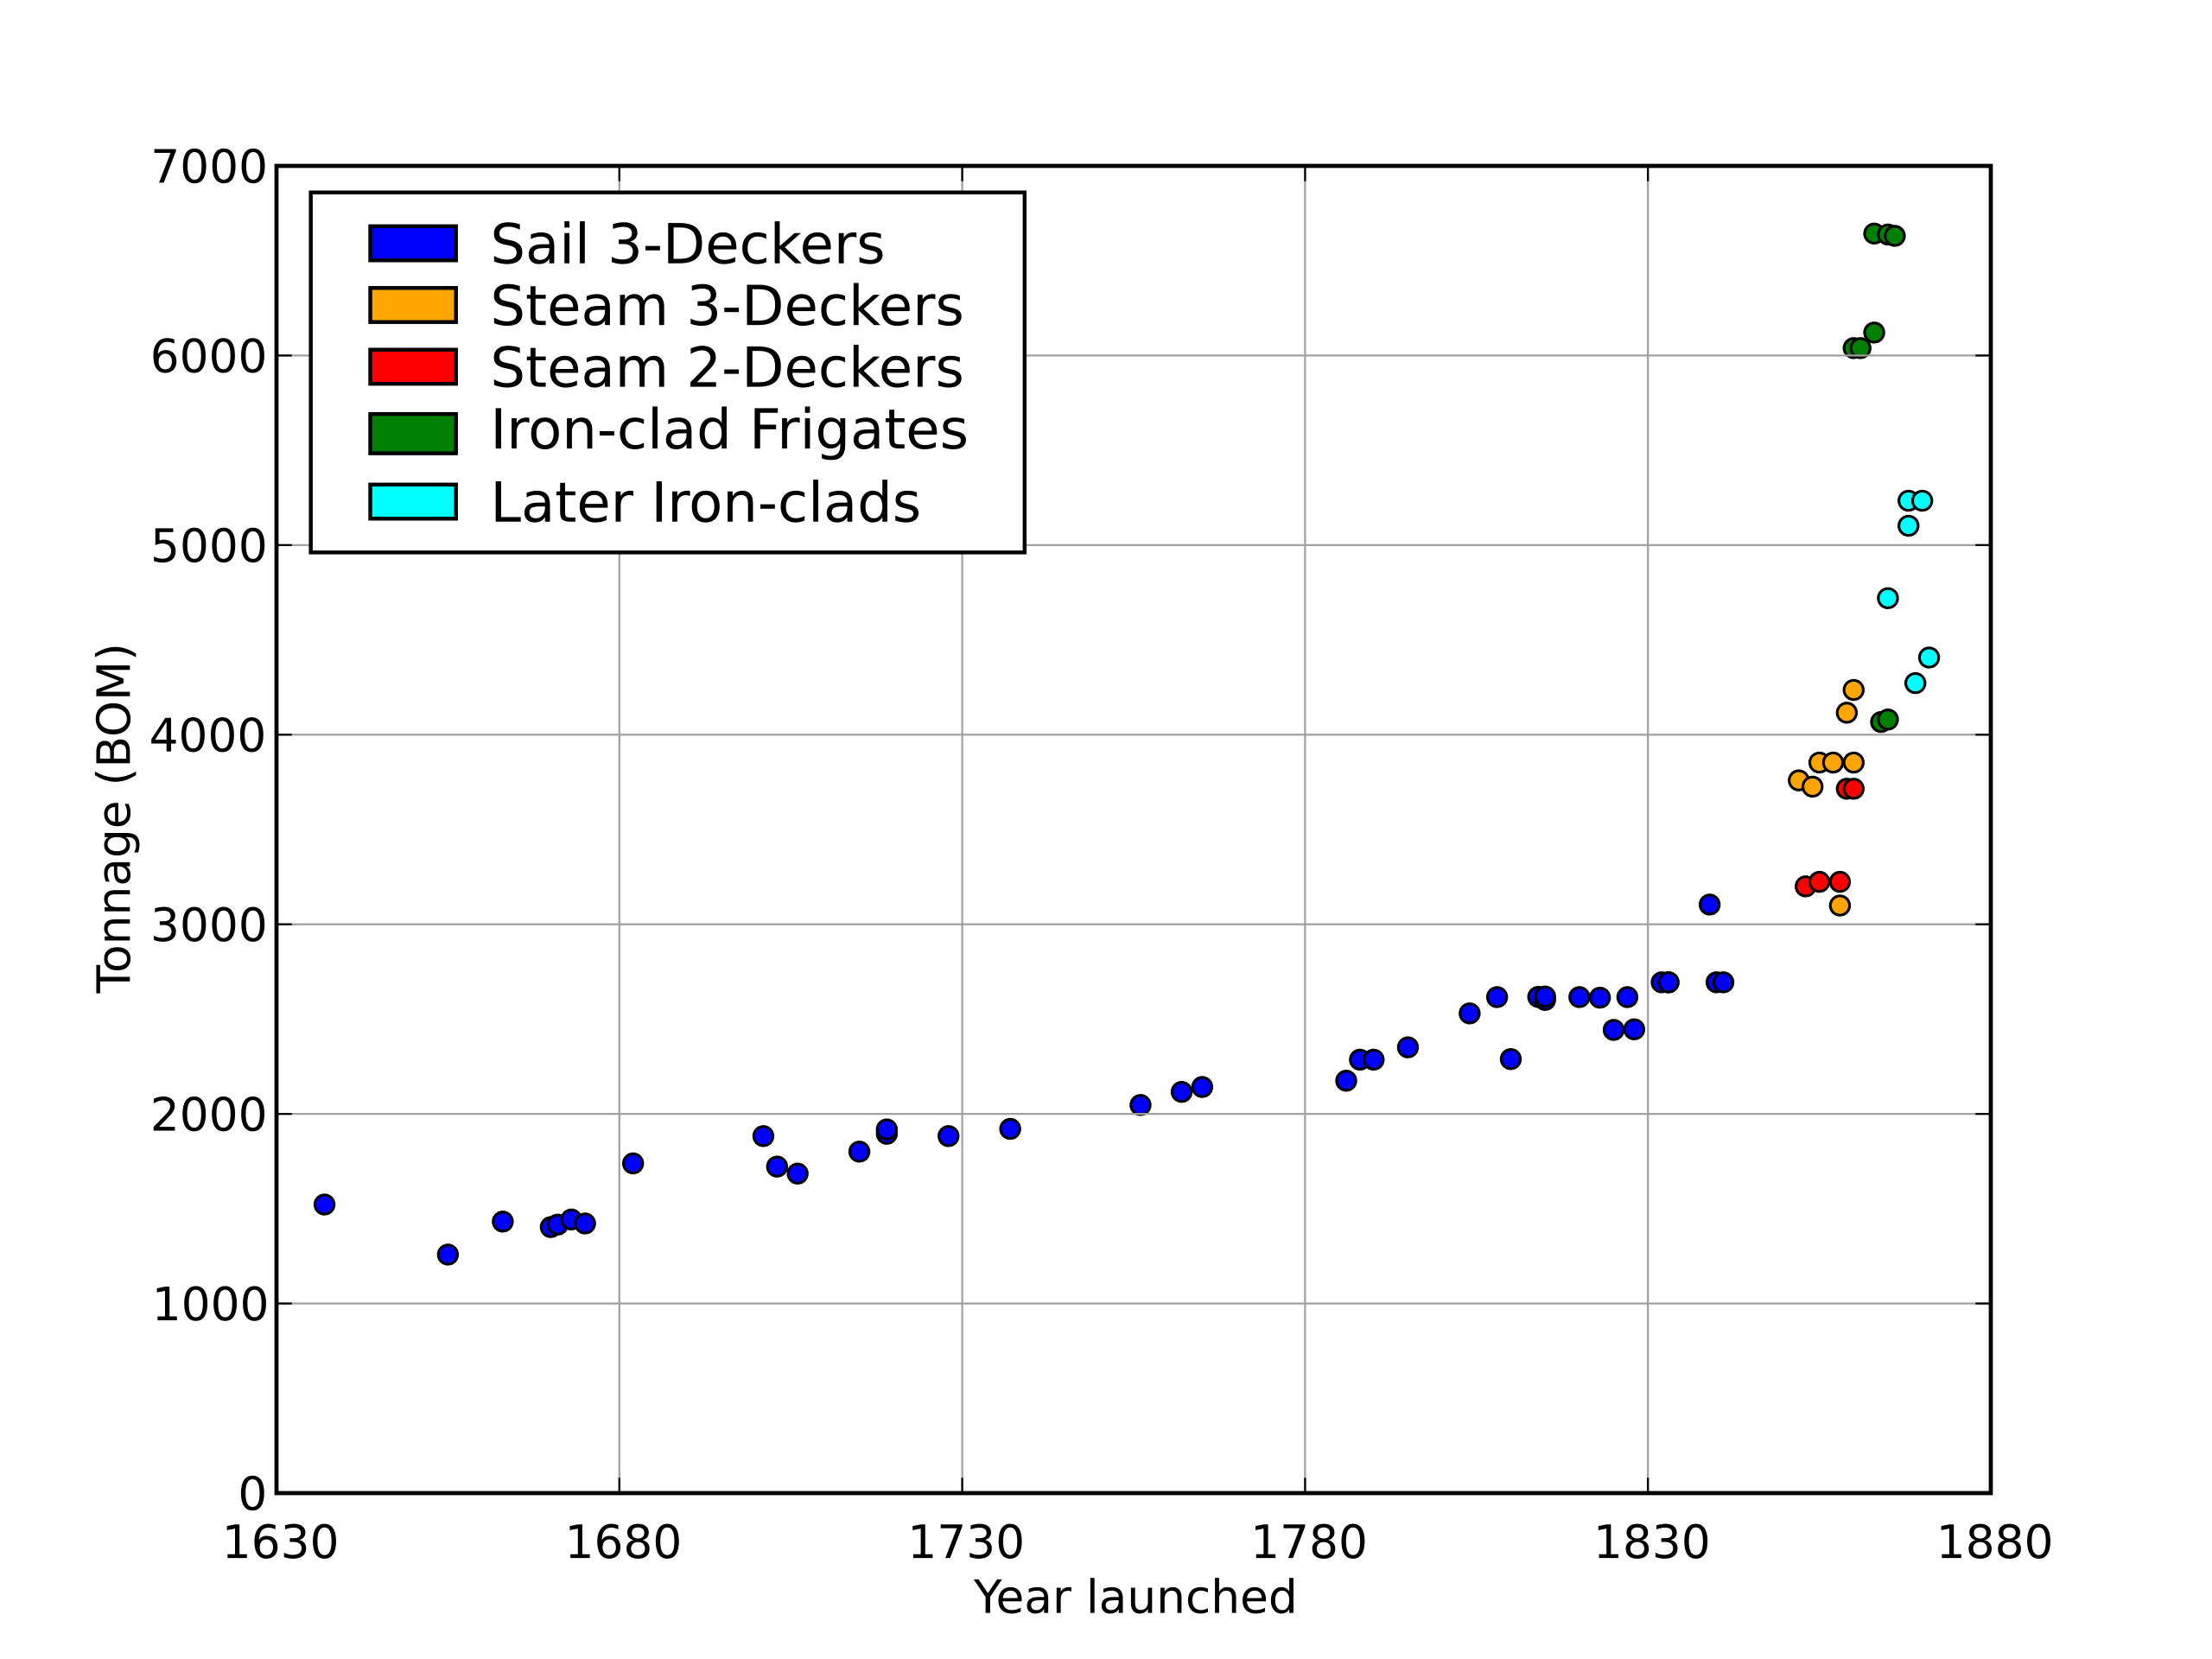Figure 2: Tonnage (in BOM) of Royal Navy First-Rate Line-of-Battle Ships, from [Wikipedia](https://de.wikipedia.org/wiki/Datei:Weight_Growth_of_RN_First_Rate_Line-of-Battle_Ships_1630-1875.svg).[7](https://aiimpacts.org/historic-trends-in-ship-size/#easy-footnote-bottom-7-1385 \"“File: Weight Growth of RN First Rate Line-of-Battle Ships 1630-1875.Svg.” In Wikipedia. Accessed October 26, 2019. https://de.wikipedia.org/wiki/Datei:Weight_Growth_of_RN_First_Rate_Line-of-Battle_Ships_1630-1875.svg.\")\n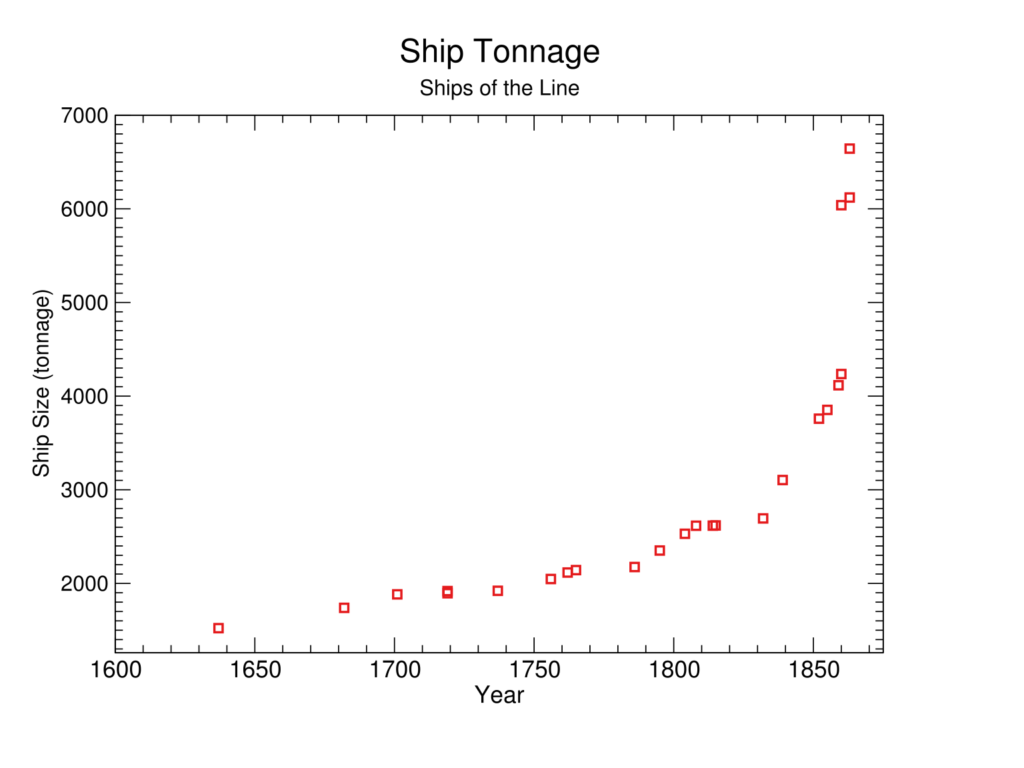Figure 3: The subset of tonnages from Figure 2 that are the highest so far.\n##### Discontinuity measurement\n\n\n###### Exponential prior\n\n\nIf we have a strong prior on technological trends being linear or exponential, we might treat this data as a linear trend through 1804 followed by an exponential trend.[8](https://aiimpacts.org/historic-trends-in-ship-size/#easy-footnote-bottom-8-1385 \"See our spreadsheet, sheet ‘Tonnage calculations’ to see the trends, and our methodology page for details on how we divide the data into trends and how to interpret the spreadsheet.\") Extrapolated in this way, tonnage saw ten greater than ten year discontinuities in this data, shown in the table below.[9](https://aiimpacts.org/historic-trends-in-ship-size/#easy-footnote-bottom-9-1385 \"See our methodology page for explanation of how we calculated these numbers. Also see our spreadsheet, sheet ‘Tonnage calculations’ for these calculations.\")\n\n\n| | | | |\n| --- | --- | --- | --- |\n| **Year** | **Tonnage (BOM)** | **Discontinuity** | **Name** |\n| 1701 | 1,883 | 11 years | *[Royal Sovereign](https://en.wikipedia.org/wiki/HMS_Royal_Sovereign_(1786))* |\n| 1756 | 2,047 | 13 years | *[Royal George](https://en.wikipedia.org/wiki/HMS_Royal_George_(1756))* |\n| 1762 | 2,116 | 10 years | *[Brittania](https://en.wikipedia.org/wiki/HMS_Britannia_(1762))* |\n| 1795 | 2,351 | 31 years | *[Ville de Paris](https://en.wikipedia.org/wiki/French_ship_Ville_de_Paris_(1764))* |\n| 1804 | 2,530 | 25 years | *[Hibernia](https://en.wikipedia.org/wiki/HMS_Hibernia_(1804))* |\n| 1839 | 3,104 | 41 years | *[Queen](https://en.wikipedia.org/wiki/HMS_Queen_(1839))* |\n| 1852 | 3,759 | 41 years | *[Duke of Wellington](https://en.wikipedia.org/wiki/HMS_Duke_of_Wellington_(1852))* |\n| 1859 | 4,116 | 12 years | *[Victoria](https://en.wikipedia.org/wiki/Victoria_(ship))* |\n| 1860 | 6,039 | 77 years | *[Warrior](https://en.wikipedia.org/wiki/HMS_Warrior_(1860))* |\n| 1863 | 6,643 | 13 years | *[Minotaur](https://en.wikipedia.org/wiki/HMS_Minotaur_(1863))* |\n| 1867 | 8946 | 33 years | Inflexible |\n\n\nIn addition to the size of these discontinuity in years, we have tabulated a number of other potentially relevant metrics [here](https://docs.google.com/spreadsheets/d/1iMIZ57Ka9-ZYednnGeonC-NqwGC7dKiHN9S-TAxfVdQ/edit?usp=sharing).[10](https://aiimpacts.org/historic-trends-in-ship-size/#easy-footnote-bottom-10-1385 \"See our methodology page for more details.\")\n###### Other curves\n\n\nWith a weaker prior on linear or exponential trends in technology progress, one might prefer to extrapolate this data as a more exotic curve, such as a hyperbola. For instance, *Tonnage = (1/(c\\*year + d))^(1/3)* for some constants *c* and *d* appears to be a good model, since *1/(tonnage^3)* looks fairly linear (see Figure 4).\n\n\n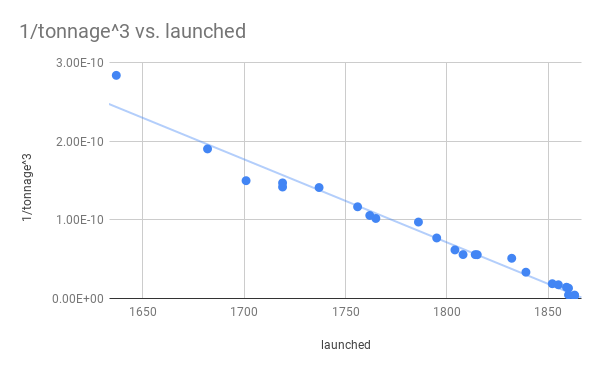Figure 4: 1/(tonnage^3) is roughly linear\nUsing this to extrapolate past progress, we get no discontinuities (see [**our spreadsheet, sheet ‘Tonnage calculations’**](https://docs.google.com/spreadsheets/d/1iUTwqlafTPd74MEG8w9rHyTYFKLwg2MsBI4-I8bC5Us/edit?usp=sharing) for this calculation). However this is unsurprising toward the end, since hyperbolas have asymptotes (potentially going to infinity in finite time), and this particular one reaches such a singularity in about 1869. So on that model, any size ship is expected by 1869, and discontinuities cannot be larger than the time remaining until that date. (The largest discontinuity is nine years, from *Warrior*, which is within a year of the implied ship-tonnage singularity.)\n\n\n##### Discussion of causes\n\n\nGiven that modeling the data as hyperbolic means there are no discontinuities, a plausible cause for apparent discontinuities when modeling it as exponential is that the process of ship size increase is fundamentally closer to being hyperbolic (though it must have departed from this trend before long, since it would have implied arbitrarily large ships from 1869). We do not know why this trend in particular would be hyperbolic, given that we understand exponential curves to be much more common in technological progress. \n\n\nOn a brief investigation of possible causes of particular discontinuities in this trend, *Ville de Paris, Hibernia, and Queen* do not appear to use any dramatically different technology to previous ships. \n\n\nThe *[Duke of Wellington](https://en.wikipedia.org/wiki/HMS_Duke_of_Wellington_(1852))* was the first Royal Navy ship of the line to be steam powered, and it was apparently lengthened to fit the engines.[11](https://aiimpacts.org/historic-trends-in-ship-size/#easy-footnote-bottom-11-1385 \"“Although the Royal Navy had been using steam power in smaller ships for three decades, it had not been adopted for ships of the line, partly because the enormous paddle-boxes required would have meant a severe reduction in the number of guns carried. This problem was solved by the adoption of the screw propeller in the 1840s. Under a crash programme announced in December 1851 to provide the navy with a steam-driven battlefleet, the design was further modified by the new Surveyor, Captain Baldwin Walker. The ship was cut apart in two places on the stocks in January 1852, lengthened by 30 feet (9.1 m) overall and given screw propulsion.”
“HMS Duke of Wellington (1852).” Wikipedia. February 08, 2019. Accessed April 22, 2019. https://en.wikipedia.org/wiki/HMS_Duke_of_Wellington_(1852). \")\nThe largest discontinuity was from *[Warrior](https://en.wikipedia.org/wiki/HMS_Warrior_(1860))*, which was one of the two first armor-plated, iron-hulled warships.[12](https://aiimpacts.org/historic-trends-in-ship-size/#easy-footnote-bottom-12-1385 \"“Warrior and her sister ship HMS Black Prince were the first armour-plated, iron-hulled warships, and were built in response to France’s launching in 1859 of the first ocean-going ironclad warship, the wooden-hulled Gloire.” “HMS Warrior (1860).” Wikipedia. December 18, 2018. Accessed April 23, 2019. https://en.wikipedia.org/wiki/HMS_Warrior_(1860). \") It seems likely that iron hulls allowed larger ships. For example, the wooden steamship *[Mersey](https://en.wikipedia.org/wiki/HMS_Mersey_(1858))*, unusually large for a wooden ship yet smaller than the *Warrior,* is considered to have been beyond the limits of wood as a structural material.[13](https://aiimpacts.org/historic-trends-in-ship-size/#easy-footnote-bottom-13-1385 \"\n\n\n\n
\n\n\n\n\nShe and her sister ship the Orlando were the longest wooden warships built for the Royal Navy. … The length, the unique aspect of the ship, was actually an Achilles’ heel of the Mersey and Orlando. The extreme length of the ship put enormous strains on her hull due to the unusual merging of heavy machinery, and a lengthy wooden hull, resulting in her seams opening up. They were pushing the limits of what was possible in wooden ship construction:
\n\n\n\n\n
Even the biggest of the 5,000-6,000-ton wooden battleships of the mid-to-late 19th century and the 5,000-ton wooden motorships constructed in the United States during World War I did not exceed 340 feet in length or 60 feet in width. The longest of these ships, the Mersey-class frigates, were unsuccessful, and one, HMS Orlando, showed signs of structural failure after an 1863 voyage to the United States. The Orlando was scrapped in 1871 and the Mersey soon after. Both the Mersey-class frigates and the largest of the wooden battleships, the 121-gun Victoria class, required internal iron strapping to support the hull, as did many other ships of this kind. In short, the construction and use histories of these ships indicated that they were already pushing or had exceeded the practical limits for the size of wooden ships.[1]
Britain had built two long frigates in 1858 – HMS Mersey and HMS Orlando – the longest, largest and most powerful single-decked wooden fighting ships. Although only 335 feet long, they suffered from the strain of their length, proving too weak to face a ship of the line in close quarters.[2]
“HMS Mersey (1858).” Wikipedia. August 29, 2017. Accessed April 24, 2019. https://en.wikipedia.org/wiki/HMS_Mersey_(1858). \") Moreover, the very large civilian ship [*Great Eastern*](https://en.wikipedia.org/wiki/SS_Great_Eastern), made extensive use of iron for structure and appears to have been regarded as innovative for its structure.[14](https://aiimpacts.org/historic-trends-in-ship-size/#easy-footnote-bottom-14-1385 \"“Brunel’s Great Eastern represented the next great development in shipbuilding. Built in association with John Scott Russell, it used longitudinal stringers for strength, inner and outer hulls, and bulkheads to form multiple watertight compartments.”
“Shipbuilding.” Wikipedia. April 18, 2019. Accessed April 23, 2019. https://en.wikipedia.org/wiki/Shipbuilding#Industrial_Revolution.
“The hull was an all-iron construction, a double hull of 19 mm (0.75 in) wrought iron in 0.86 metres (2 feet 10 inches) plates with ribs every 1.8 m (5.9 ft). Internally, the hull was divided by two 107 m (351 ft) long, 18 m (59 ft) high, longitudinal bulkheads and further transverse bulkheads dividing the ship into nineteen compartments.”
“SS Great Eastern.” Wikipedia. April 22, 2019. Accessed April 23, 2019. https://en.wikipedia.org/wiki/SS_Great_Eastern. \") So plausibly this was an important enough innovation to produce an immediate jump in ship size.\n\n\n##### Spot check\n\n\nOur metric, BOM, doesn’t measure volume or weight directly; it is derived from a ship’s width and length. Thus it might often be a reasonable proxy for a more normal notion of size, but change arbitrarily between different ship designs. There is particular reason to suspect this here, since according to Wikipedia, “[s]teamships required a different method of estimating tonnage, because the ratio of length to beam was larger and a significant volume of internal space was used for boilers and machinery.”[15](https://aiimpacts.org/historic-trends-in-ship-size/#easy-footnote-bottom-15-1385 \"Wikipedia, The Free Encyclopedia, s.v. “Builder’s Old Measurement,” (accessed April 5, 2019)
https://en.wikipedia.org/wiki/Builder%27s_Old_Measurement \") \n\n\n\nTo check whether the *Warrior* discontinuity was an artifact of this measurement scheme, we also searched for displacement figures for some of these ships. (We also made a brief attempt to find ships from other navies, like the French, that might destroy the discontinuity. We didn’t find any.) We did not collect many, but they cover the period of the largest discontinuity, 1850-1860, and confirm that it is probably robust to different ship size metrics, and thus not an artifact. See [this spreadsheet](https://docs.google.com/spreadsheets/d/1fkJ5pkLBt5dvciFkOb4S1ala7ZPmOhGLW8lI_CkpO9Y/edit?usp=sharing).\n\n\n#### Royal Navy first-rate line-of-battle ships displacement (tons)\n\n\nThe [displacement](https://en.wikipedia.org/wiki/Displacement_(ship)) of a ship is its weight, measured by looking at the amount of water that a ship displaces when it’s floating.[16](https://aiimpacts.org/historic-trends-in-ship-size/#easy-footnote-bottom-16-1385 \"“The displacement or displacement tonnage of a ship is its weight based on the amount of water its hull displaces at varying loads.” – “Displacement (Ship)”. 2019. En.Wikipedia.Org. Accessed July 8 2019. https://en.wikipedia.org/w/index.php?title=Displacement_(ship)&oldid=899439176.\")\n##### Data\n\n\nWe took displacement and ‘estimated displacement’ data from the same Wikipedia table[17](https://aiimpacts.org/historic-trends-in-ship-size/#easy-footnote-bottom-17-1385 \"“File: Weight Growth of RN First Rate Line-of-Battle Ships 1630-1875.Svg.” In Wikipedia. Accessed October 26, 2019. https://de.wikipedia.org/wiki/Datei:Weight_Growth_of_RN_First_Rate_Line-of-Battle_Ships_1630-1875.svg.\") for Royal Navy first-rate line-of-battle ships and put it in [this spreadsheet, sheet ‘Displacement calculations’](https://docs.google.com/spreadsheets/d/1iUTwqlafTPd74MEG8w9rHyTYFKLwg2MsBI4-I8bC5Us/edit?usp=sharing). Figure 5 below shows this data.\n\n\n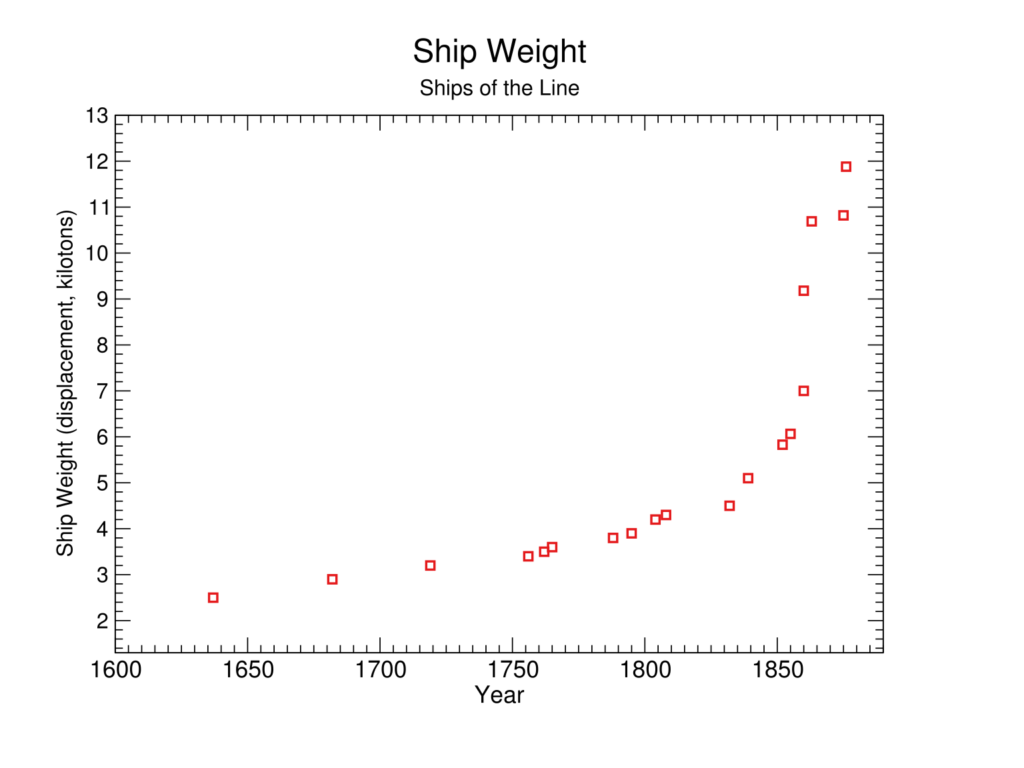Figure 5: Ship Weight (displacement) over time\n##### Discontinuity Measurement\n\n\nIf we model this data as a linear trend through 1795 followed by an exponential trend,[18](https://aiimpacts.org/historic-trends-in-ship-size/#easy-footnote-bottom-18-1385 \"See our spreadsheet, sheet ‘Displacement calculations’ to see the trends, and our methodology page for details on how we divide the data into trends and how to interpret the spreadsheet.\") then compared to previous rates in these trends, tonnage contained six greater than ten year discontinuities, shown in the table below.[19](https://aiimpacts.org/historic-trends-in-ship-size/#easy-footnote-bottom-19-1385 \"See our methodology page for explanation of how we calculated these numbers. Also see our spreadsheet, sheet ‘Displacement calculations’ for these calculations.\") \n\n\n\n\n| | | | |\n| --- | --- | --- | --- |\n| **Year** | **Displacement (tons)** | **Discontinuity** | **Ship Surname** |\n| 1804 | 4,200 | 17 years | *[Hibernia](https://en.wikipedia.org/wiki/HMS_Hibernia_(1804))* |\n| 1839 | 5,100 | 35 years | *[Queen](https://en.wikipedia.org/wiki/HMS_Queen_(1839))* |\n| 1852 | 5,829 | 25 years | *[Duke of Wellington](https://en.wikipedia.org/wiki/HMS_Duke_of_Wellington_(1852))* |\n| 1860 | 7,000 | 30 years | *[Victoria](https://en.wikipedia.org/wiki/Victoria_(ship))* |\n| 1860 | 9,180 | 59 years | *[Warrior](https://en.wikipedia.org/wiki/HMS_Warrior_(1860))* |\n| 1863 | 10,690 | 23 years | *[Minotaur](https://en.wikipedia.org/wiki/HMS_Minotaur_(1863))* |\n\n\nIn addition to the sizes of these discontinuities in years, we have tabulated a number of other potentially relevant metrics [here](https://docs.google.com/spreadsheets/d/1iMIZ57Ka9-ZYednnGeonC-NqwGC7dKiHN9S-TAxfVdQ/edit?usp=sharing).[20](https://aiimpacts.org/historic-trends-in-ship-size/#easy-footnote-bottom-20-1385 \"See our methodology page for more details.\")\nOnce again, if we model the data as hyperbolic, it contains no discontinuities of more than ten years, however this is unsurprising after about 1859 end given the proximity of the asymptote (see further explanation in previous section, and calculations in the [spreadsheet, sheet ‘Displacement calculations’](https://docs.google.com/spreadsheets/d/1iUTwqlafTPd74MEG8w9rHyTYFKLwg2MsBI4-I8bC5Us/edit?usp=sharing)).\n\n\n### The SS *Great Eastern*\n\n\nIn the process of another investigation, we noted that a civilian ship, the [SS *Great Eastern*](https://en.wikipedia.org/wiki/SS_Great_Eastern), launched in 1858, was about six times larger by volume than any other ship at the time. It apparently took more than forty years for its length, gross tonnage, and passenger capacity to be surpassed.[21](https://aiimpacts.org/historic-trends-in-ship-size/#easy-footnote-bottom-21-1385 \"” She was by far the largest ship ever built at the time of her 1858 launch, and had the capacity to carry 4,000 passengers from England to Australia without refueling. Her length of 692 feet (211 m) was only surpassed in 1899 by the 705-foot (215 m) 17,274-gross-ton RMS Oceanic, her gross tonnage of 18,915 was only surpassed in 1901 by the 701-foot (214 m) 21,035-gross-ton RMS Celtic, and her 4,000-passenger capacity was surpassed in 1913 by the 4,935-passenger SS Imperator. The ship’s five funnels were rare. These were later reduced to four.” “These measurements were six times larger by volume than any ship afloat…”
“SS Great Eastern.” Wikipedia. April 22, 2019. Accessed April 23, 2019. https://en.wikipedia.org/wiki/SS_Great_Eastern.\") We calculate its tonnage (BOM) to be 22,990 tons (see [spreadsheet, tab Tonnage calculations](https://docs.google.com/spreadsheets/d/1iUTwqlafTPd74MEG8w9rHyTYFKLwg2MsBI4-I8bC5Us/edit#gid=2046407726)). Supposing our Royal Navy dataset is a good proxy for overall ship size records during this time, and treating past progress as exponential, the SS *Great Eastern* represents a 416-year discontinuity in tonnage (BOM) over previous Royal Navy ships. (See [spreadsheet, tab Tonnage calculations](https://docs.google.com/spreadsheets/d/1iUTwqlafTPd74MEG8w9rHyTYFKLwg2MsBI4-I8bC5Us/edit#gid=2046407726)) If the trend is modeled as a hyperbola instead, the SS *Great Eastern* still represents an 11 year discontinuity, which is as big as a discontinuity can be in the context of the theoretical expectation of arbitrarily large ships when the hyperbola reaches its asymptote in 11 years.[22](https://aiimpacts.org/historic-trends-in-ship-size/#easy-footnote-bottom-22-1385 \"See discussion above, and spreadsheet for calculation.\") \n\n\nFigure 6: The SS *Great Eastern*[23](https://aiimpacts.org/historic-trends-in-ship-size/#easy-footnote-bottom-23-1385 \"From Wikimedia Commons:
Charles Parsons (1821-1910) [Public domain] \")\nIt is possible that there were other civilian ships prior to the *Great Eastern* that were also big, making the *Great Eastern* not a discontinuity. However we think this is unlikely. The [RMS Persia](https://en.wikipedia.org/wiki/RMS_Persia), launched only three years prior to the *Great Eastern*, was the ‘largest’ ship in the world at that time[24](https://aiimpacts.org/historic-trends-in-ship-size/#easy-footnote-bottom-24-1385 \"“She was the first Atlantic record breaker constructed of iron and was the largest ship in the world at the time of her launch.”
“RMS Persia.” Wikipedia. February 25, 2018. Accessed April 30, 2019. https://en.wikipedia.org/wiki/RMS_Persia. \"), and yet was only slightly bigger than the biggest military ships, in terms of tonnage (BOM). ([See spreadsheet](https://docs.google.com/spreadsheets/d/1iUTwqlafTPd74MEG8w9rHyTYFKLwg2MsBI4-I8bC5Us/edit?usp=sharing)). If in the intervening two or three years a larger ship appeared, we do not know of it. \n\n\nUsing displacement, recorded on Wikipedia as 32,160 tons, and again assuming that our Royal Navy dataset is a good proxy for all ships, we also get a large discontinuity– 407 years when compared to our previous exponential trend for Royal Navy ships. ([See spreadsheet](https://docs.google.com/spreadsheets/d/1iUTwqlafTPd74MEG8w9rHyTYFKLwg2MsBI4-I8bC5Us/edit?usp=sharing)). \n\n\n\n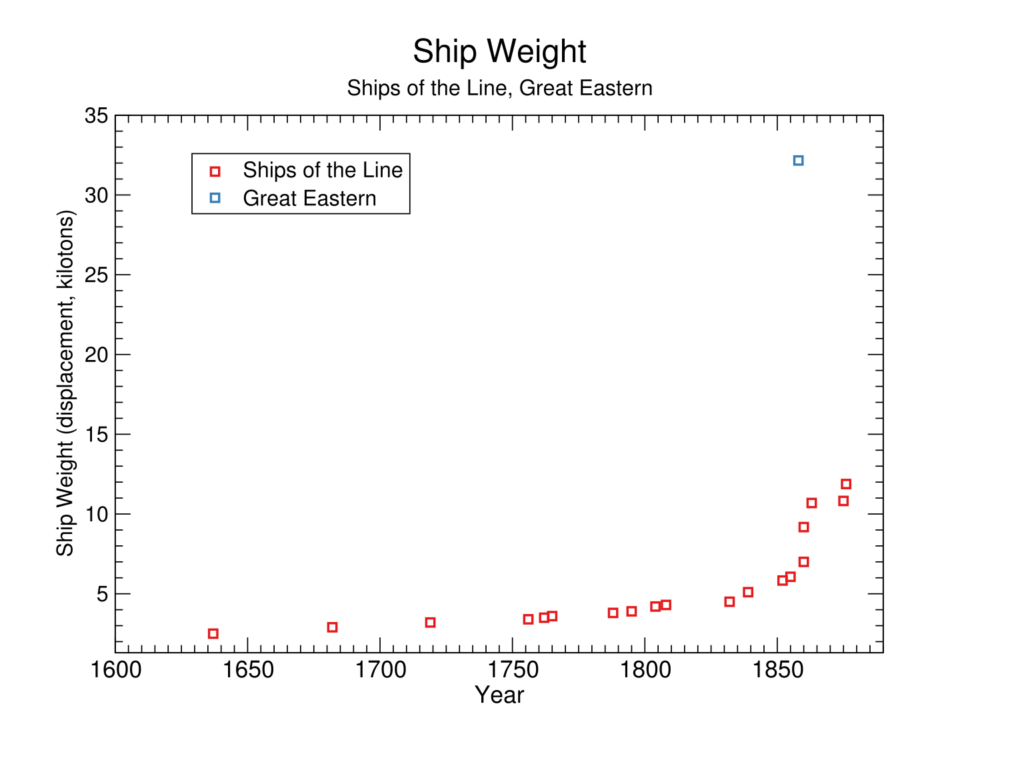Figure 7: Ship weight (displacement) over time, now with the *Great Eastern*.\nWe do not know why the *Great Eastern* was so exceptional. It seems that itwas innovative in several ways,[25](https://aiimpacts.org/historic-trends-in-ship-size/#easy-footnote-bottom-25-1385 \" The Great Eastern was the first ship to use a double-skinned hull:
“Great Eastern was the first ship to incorporate the double-skinned hull, a feature which would not be seen again in a ship for several decades, but which is now compulsory for reasons of safety. ” We understand that it was also one of the first European ships to be divided into watertight compartments using internal bulkheads, one of the first iron-hulled ships, and one of the first ships to use screw propulsion (although it also had sails and paddlewheels) “SS Great Eastern.” Wikipedia. April 22, 2019. Accessed April 23, 2019. https://en.wikipedia.org/wiki/SS_Great_Eastern. \") and that it was designed by a pair of exceptional engineer-scientists, one of whom may have been influential to the design of the *Warrior*.[26](https://aiimpacts.org/historic-trends-in-ship-size/#easy-footnote-bottom-26-1385 \"“During the 1850s he argued within the Navy for the construction of iron warships and the first design, HMS Warrior, is said by some to be a “Russell ship”.[25][26] ”
“John Scott Russell.” Wikipedia. March 29, 2019. Accessed May 01, 2019. https://en.wikipedia.org/wiki/John_Scott_Russell.
“Isambard Kingdom Brunel FRS (/ˈɪzəmbɑːrd bruːˈnɛl/; 9 April 1806 – 15 September 1859[1]), was an English mechanical and civil engineer who is considered “one of the most ingenious and prolific figures in engineering history”,[2] “one of the 19th-century engineering giants”,[3] and “one of the greatest figures of the Industrial Revolution, [who] changed the face of the English landscape with his groundbreaking designs and ingenious constructions”.[4]“
“Isambard Kingdom Brunel.” Wikipedia. April 11, 2019. Accessed May 01, 2019. https://en.wikipedia.org/wiki/Isambard_Kingdom_Brunel. \") However, the ship’s size might have also been the result of poor business sense, as it appears to have been a financial failure. [27](https://aiimpacts.org/historic-trends-in-ship-size/#easy-footnote-bottom-27-1385 \"In what appears to be the beginning of a pattern of financial problems, the ship’s maiden voyage brought in considerably less revenue than expected:
“From a financial perspective, the American venture had been a disaster; the ship had taken in only $120,000 against a $72,000 overhead, whereas the company had expected to take in $700,000. In addition, the company was facing a daily interest payment of $5,000, which ate into any profits the ship made.[15]”
“SS Great Eastern” Wikipedia. September 19, 2022. Accessed September 26, 2022.\")\n \nFigure 8: Cutaway of one of the SS *Great Eastern*‘s engine rooms.[28](https://aiimpacts.org/historic-trends-in-ship-size/#easy-footnote-bottom-28-1385 \"This 3D reconstruction image was made by Simon Edwards at History Rebuilt. Reproduced with permission.\") \nNuño Sempere has also investigated the *Great Eastern* as a potential discontinuity to passenger and sailing vessel length trends.[29](https://aiimpacts.org/historic-trends-in-ship-size/#easy-footnote-bottom-29-1385 \"Sempere, Nuño. “Discontinuous Progress in Technological Trends.” In brightest day, in blackest night. Accessed May 10, 2020. https://nunosempere.github.io/rat/Discontinuous-Progress.html.\") We learned of this after our own investigation, so have not measured these discontinuities by the same methods as those noted above, nor checked the data. Sempere notes that it took 41 years for the length trend excluding the *Great Eastern* to surpass it. Figures 9-11 show some of this data.\n\n\n \n\n\n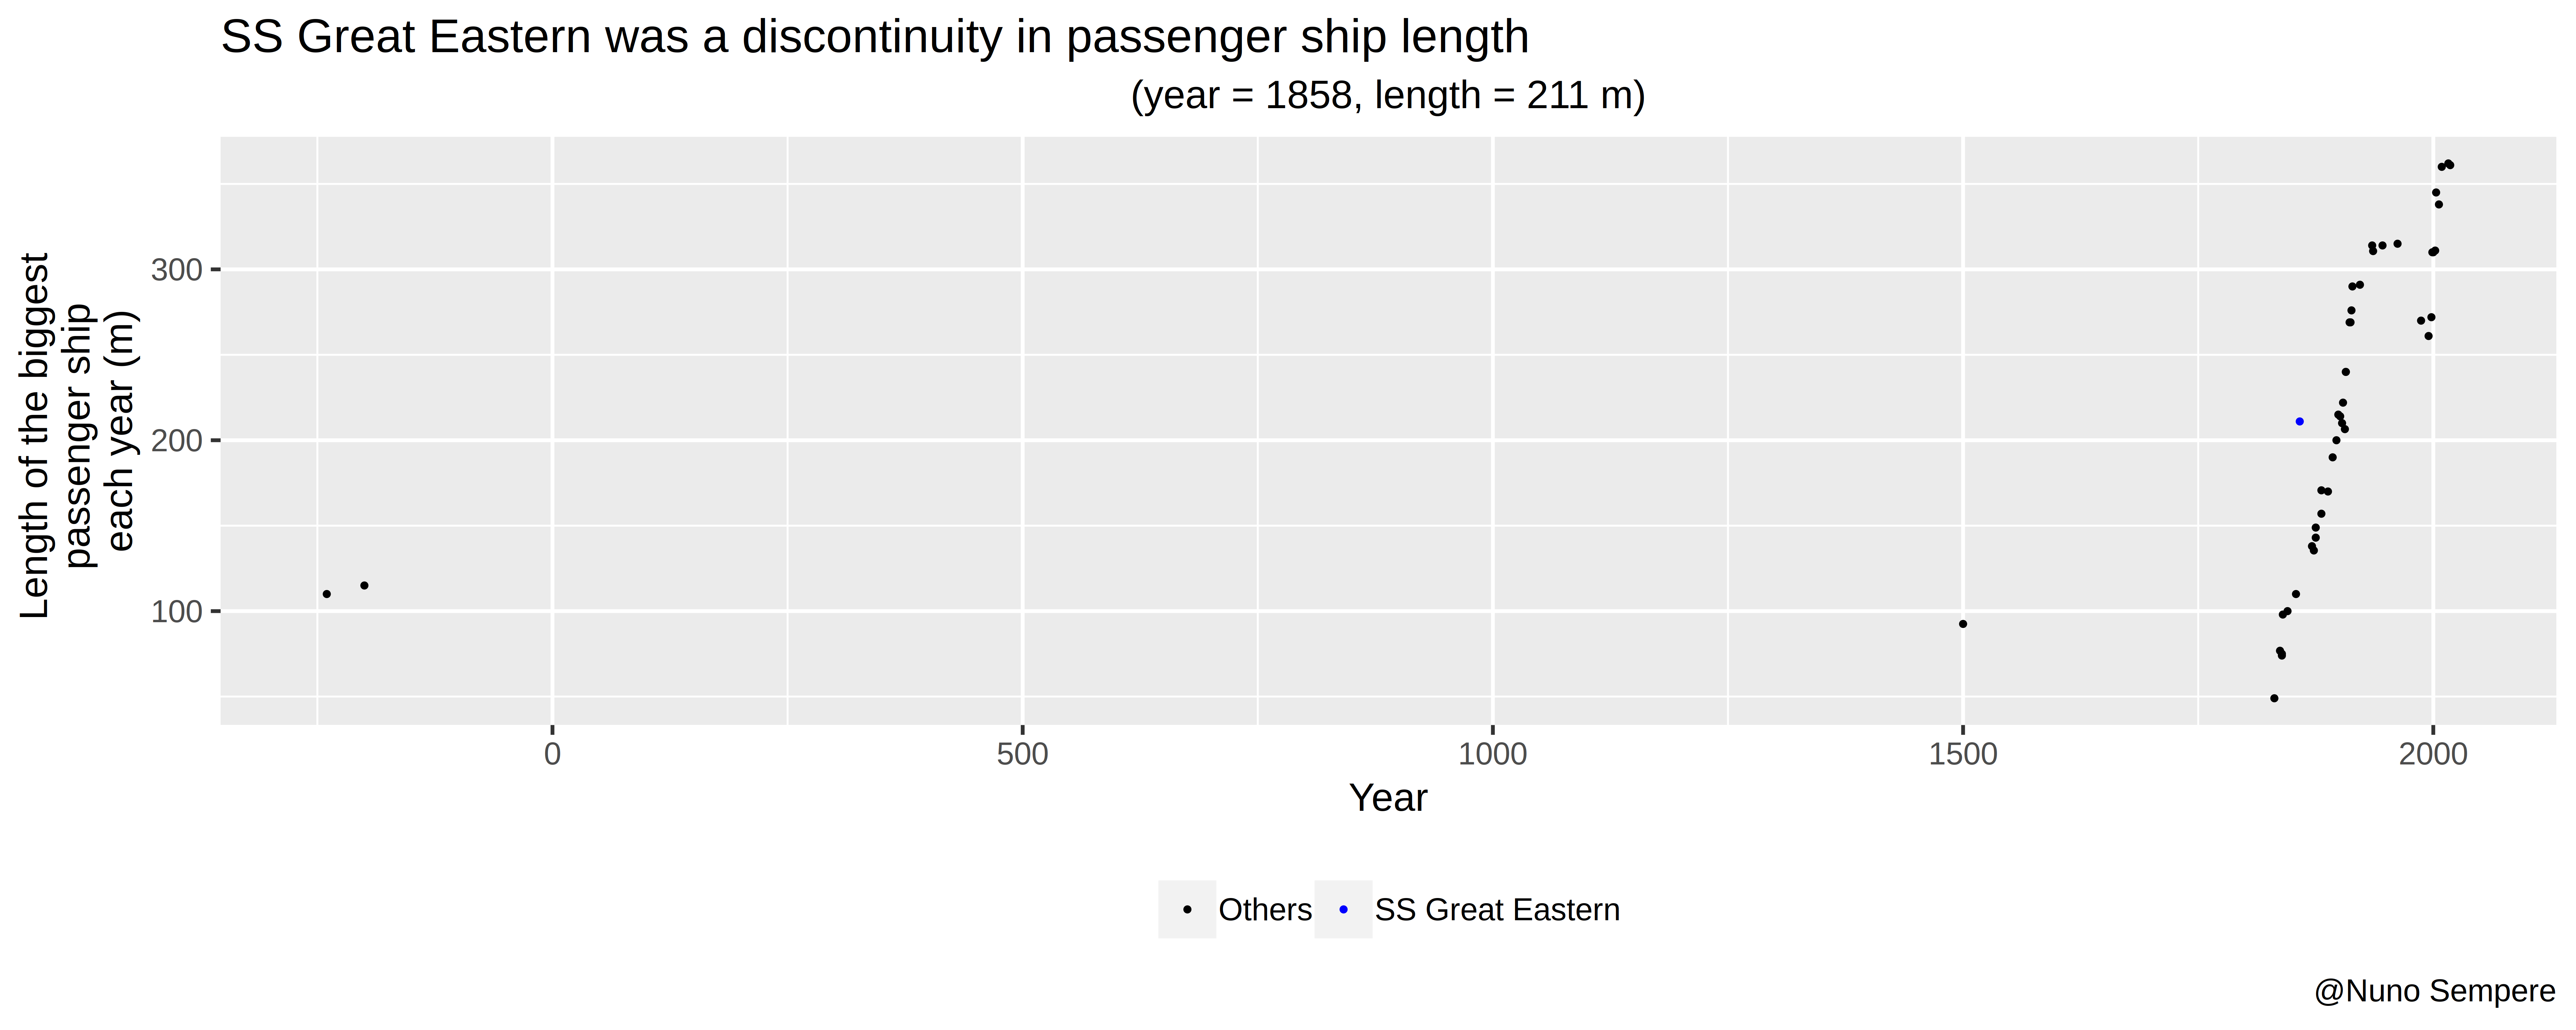Figure 9: Nuño Sempere’s data on passenger ship lengths over history. \n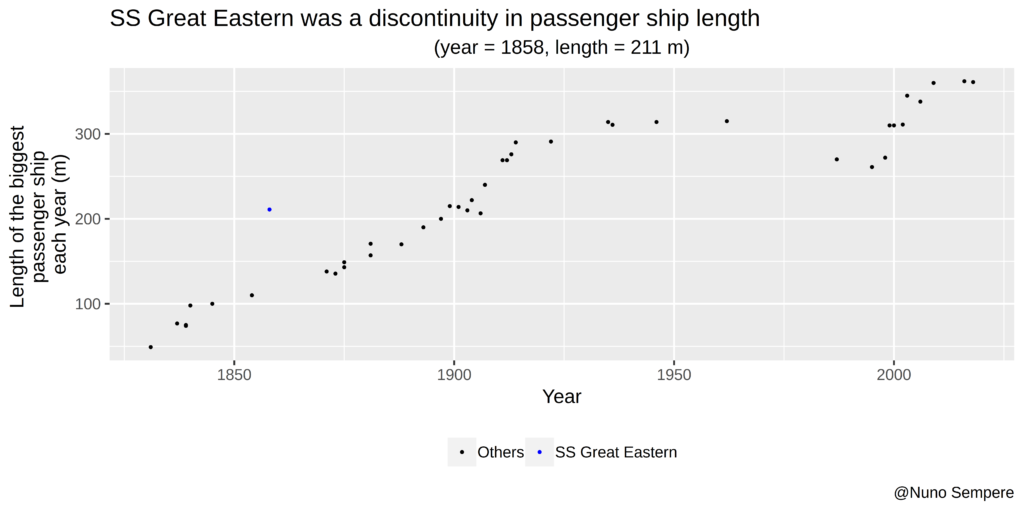Figure 10: Nuño Sempere’s data on passenger ship lengths over recent history (note that points prior to the *Great Eastern* are not all-time records).\n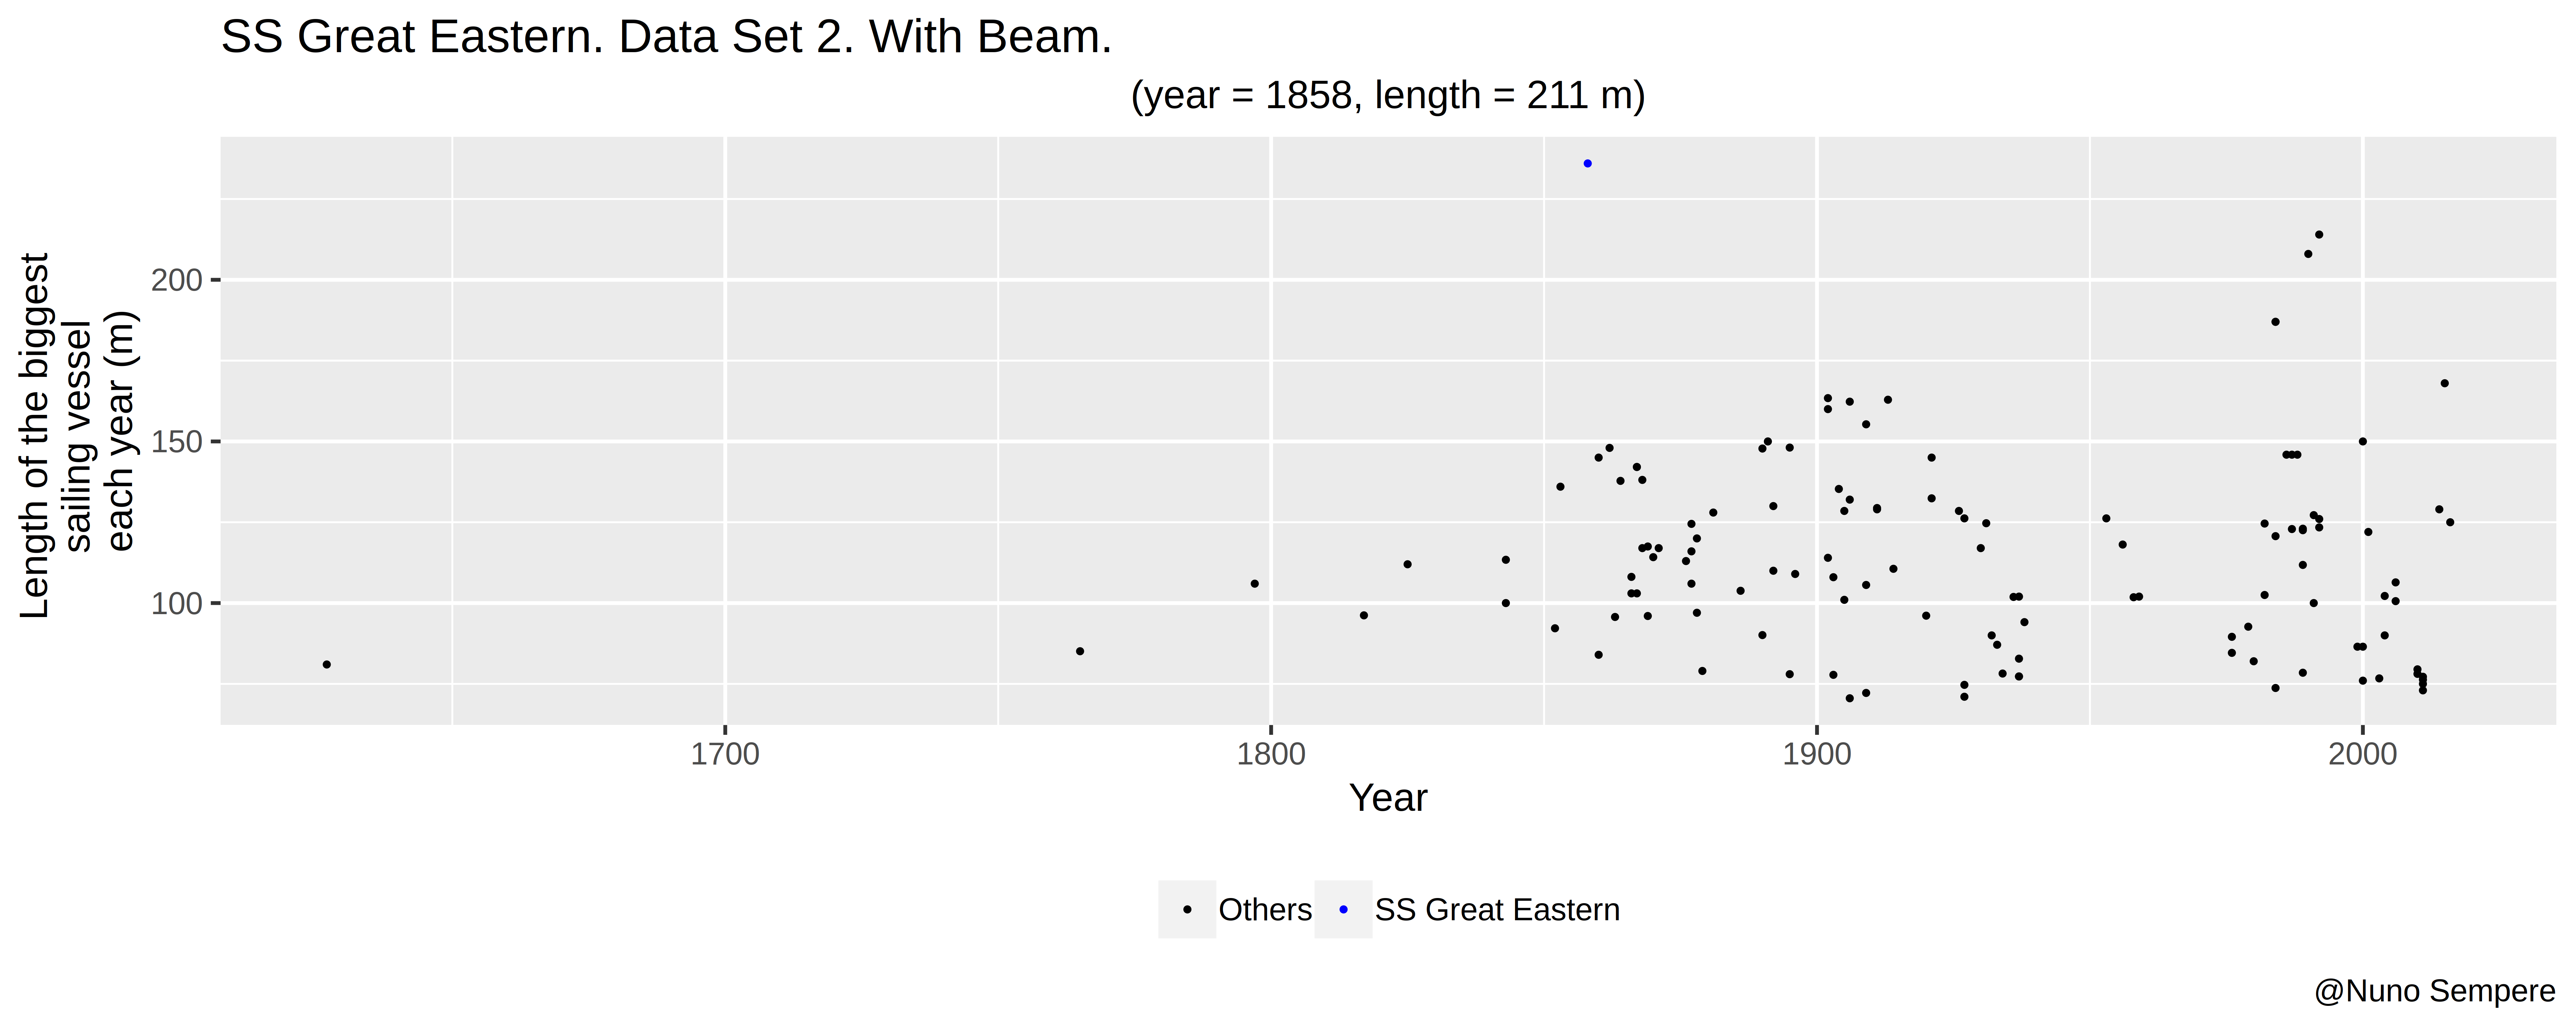Figure 11: Nuño Sempere’s data on sailing ship lengths over history, beams included. *SS Great Eastern* is the highest point. \nAcknowledgements\n----------------\n\n\nThanks to bean for his help with this. He blogs about naval history at [navalgazing.net](http://navalgazing.net/).\n\n\nNotes\n-----\n\n\n\n\n\n\n\n\n\n\n\n\n\n", "url": "https://aiimpacts.org/historic-trends-in-ship-size/", "title": "Historic trends in ship size", "source": "aiimpacts.org", "source_type": "wordpress", "date_published": "2019-12-23T07:57:11+00:00", "paged_url": "https://aiimpacts.org/feed?paged=10", "authors": ["Katja Grace"], "id": "7d805d39c33d7cb2467cb645b956554c", "summary": []}
{"text": "Effects of breech loading rifles on historic trends in firearm progress\n\n*Published Feb 7 2020*\n\n\nWe do not know if breech loading rifles represented a discontinuity in military strength. They probably did not represent a discontinuity in fire rate.\n\n\nDetails\n-------\n\n\nThis case study is part of AI Impacts’ [discontinuous progress investigation](https://aiimpacts.org/discontinuous-progress-investigation/).\n\n\nWe have not investigated this topic in depth. What follows are our initial impressions.\n\n\n### Background\n\n\nFrom [Wikipedia](https://en.wikipedia.org/wiki/Breechloader)[1](https://aiimpacts.org/effects-of-breech-loading-rifles-on-historic-trends-in-firearm-progress/#easy-footnote-bottom-1-1370 \"
“Breechloader.” In Wikipedia, May 14, 2019. https://en.wikipedia.org/w/index.php?title=Breechloader&oldid=897060135. \"):\n\n\n\n> A **breechloader**[[1]](https://en.wikipedia.org/wiki/Breechloader#cite_note-1)[[2]](https://en.wikipedia.org/wiki/Breechloader#cite_note-2) is a [firearm](https://en.wikipedia.org/wiki/Firearm) in which the [cartridge](https://en.wikipedia.org/wiki/Cartridge_(firearms)) or [shell](https://en.wikipedia.org/wiki/Shell_(projectile)) is inserted or loaded into a chamber integral to the rear portion of a [barrel](https://en.wikipedia.org/wiki/Gun_barrel).\n> \n> Modern [mass production](https://en.wikipedia.org/wiki/Mass_production) firearms are breech-loading (though [mortars](https://en.wikipedia.org/wiki/Mortar_(weapon)) are generally muzzle-loaded), except those which are intended specifically by design to be [muzzle-loaders](https://en.wikipedia.org/wiki/Muzzleloader), in order to be legal for certain types of hunting. Early firearms, on the other hand, were almost entirely muzzle-loading. The main advantage of breech-loading is a reduction in reloading time – it is much quicker to load the projectile and the charge into the breech of a gun or cannon than to try to force them down a long tube, especially when the bullet fit is tight and the tube has spiral ridges from [rifling](https://en.wikipedia.org/wiki/Rifling). In field artillery, the advantages were similar: the crew no longer had to force powder and shot down a long barrel with rammers, and the shot could now tightly fit the bore (increasing accuracy greatly), without being impossible to ram home with a fouled barrel. \n> \n> \n\n\n### Trends\n\n\nBreech loading rifles were suggested to us as a potential discontinuity in some measure of army strength, due to high fire rate and ability to be used while lying down. We did not have time to investigate this extensively, and have not looked for evidence for or against discontinuities in military strength overall. That said, the reading we have done does not suggest any such discontinuities. \n\n\nWe briefly looked for evidence of discontinuity in firing rate, since firing rate seemed to be a key factor of any advantage in military strength.\n\n\n#### Firing rate\n\n\nUpon brief review it seems unlikely to us that breech loading rifles represented a discontinuity in firing rate alone. [Revolvers](https://en.wikipedia.org/wiki/Revolver) developed in parallel with breech-loading rifles, and appear to have had similar or higher rates of fire. This includes revolver rifles, which (being rifles) appear to be long-ranged enough to be comparable to muskets and breech-loading rifles.[2](https://aiimpacts.org/effects-of-breech-loading-rifles-on-historic-trends-in-firearm-progress/#easy-footnote-bottom-2-1370 \"For an example of a revolver rifle in use at roughly the same time as the Dreyse needle gun, the first breech-loading rifle to get widespread uptake, see the Colt New Model Revolving Rifle. Quote: “Revolving rifles were an attempt to increase the rate of fire of rifles by combining them with the revolving firing mechanism that had been developed earlier for revolving pistols. Colt began experimenting with revolving rifles in the early 19th century, making them in a variety of calibers and barrel lengths.” “Colt’s New Model Revolving Rifle.” Wikipedia. April 16, 2019. Accessed April 19, 2019. https://en.wikipedia.org/wiki/Colt’s_New_Model_Revolving_rifle.\") \n\n\n\nThe best candidate we found for a breech loading rifle constituting a discontinuity in firing rate is the Ferguson Rifle, first used in 1777 in the American Revolutionary War.[3](https://aiimpacts.org/effects-of-breech-loading-rifles-on-historic-trends-in-firearm-progress/#easy-footnote-bottom-3-1370 \"“The Ferguson rifle was one of the first breech-loading rifles to be put into service by the British military. It fired a standard British carbine ball of .615″ calibre and was used by the British Army in the American War of Independence at the Battle of Saratoga in 1777, and possibly at the Siege of Charleston in 1780.[1]” – “Ferguson Rifle.” Wikipedia. March 09, 2019. Accessed April 29, 2019. https://en.m.wikipedia.org/wiki/Ferguson_rifle.\") It was expensive and fragile, so it did not see widespread use;[4](https://aiimpacts.org/effects-of-breech-loading-rifles-on-historic-trends-in-firearm-progress/#easy-footnote-bottom-4-1370 \"“The two main reasons that Ferguson rifles were not used by the rest of the army: The gun was difficult and expensive to produce using the small, decentralized gunsmith and subcontractor system in use to supply the Ordnance in early Industrial Revolution Britain. The guns broke down easily in combat, especially in the wood of the stock around the lock mortise. The lock mechanism and breech were larger than the stock could withstand with rough use. All surviving military Fergusons feature a horseshoe-shaped iron repair under the lock to hold the stock together where it repeatedly broke around the weak, over-drilled out mortise.” – “Ferguson Rifle.” Wikipedia. March 09, 2019. Accessed April 29, 2019. https://en.m.wikipedia.org/wiki/Ferguson_rifle.\") breech-loading rifles did not become standard in any army until the Prussian “Needle gun” in 1841 and the Norwegian “Kammerlader” in 1842.[5](https://aiimpacts.org/effects-of-breech-loading-rifles-on-historic-trends-in-firearm-progress/#easy-footnote-bottom-5-1370 \"“The Kammerlader, or “chamber loader”, was the first Norwegian breech-loadingrifle, and among the very first breech loaders adopted for use by an armed force anywhere in the world.” “Kammerlader.” Wikipedia. January 07, 2019. Accessed May 01, 2019. https://en.wikipedia.org/wiki/Kammerlader.
“Dreyse Needle Gun.” Wikipedia. March 09, 2019. Accessed May 01, 2019. https://en.wikipedia.org/wiki/Dreyse_needle_gun. \") Both the Ferguson and the Dreyse needle gun could fire about six rounds a minute (sources vary),[6](https://aiimpacts.org/effects-of-breech-loading-rifles-on-historic-trends-in-firearm-progress/#easy-footnote-bottom-6-1370 \"“In the British trials, the Dreyse was shown to be capable of six rounds per minute” “Dreyse Needle Gun.” Wikipedia. March 09, 2019. Accessed May 01, 2019. https://en.wikipedia.org/wiki/Dreyse_needle_gun. “Since the weapon was loaded from the breech, rather than from the muzzle, it had an amazingly high rate of fire for its day, and in capable hands, it fired six to ten rounds per minute.” – “Ferguson Rifle.” Wikipedia. March 09, 2019. Accessed April 19, 2019. https://en.m.wikipedia.org/wiki/Ferguson_rifle.\") but by the time of the Ferguson well-trained British soldiers could fire muskets at about four rounds a minute.[7](https://aiimpacts.org/effects-of-breech-loading-rifles-on-historic-trends-in-firearm-progress/#easy-footnote-bottom-7-1370 \"“The main advantage of the British Army was that the infantry soldier trained at this procedure almost every day. A properly trained group of regular infantry soldiers was able to load and fire four rounds per minute. A crack infantry company could load and fire five rounds in a minute. ” – “Muskets.” Wikipedia. June 08, 2017. Accessed April 19, 2019. https://en.wikipedia.org/wiki/Muskets. \") Moreover, apparently there are some expensive and fragile revolvers that predate the Ferguson, again suggesting that breech-loading rifles did not lead to a discontinuity in rate of fire.[8](https://aiimpacts.org/effects-of-breech-loading-rifles-on-historic-trends-in-firearm-progress/#easy-footnote-bottom-8-1370 \" “During the late 16th century in China, Zhao Shi-zhen invented the Xun Lei Chong, a five-barreled musket revolver spear. Around the same time, the earliest examples of what today is called a revolver were made in Germany. These weapons featured a single barrel with a revolving cylinder holding the powder and ball. They would soon be made by many European gun-makers, in numerous designs and configurations.[4] However, these weapons were difficult to use, complicated and prohibitively expensive to make, and as such they were not widely distributed. In 1836, an American, Samuel Colt, patented the mechanism which led to the widespread use of the revolver,[5] the mechanically indexing cylinder.” – “Revolver.” Wikipedia. April 07, 2019. Accessed April 19, 2019. https://en.wikipedia.org/wiki/Revolver#History.\") All in all, while we don’t have enough data to plot a trend, everything we’ve seen is consistent with continuous growth in firing rate.\n\n\nFigure 1: Diagram of how to load the Ferguson rifle[9](https://aiimpacts.org/effects-of-breech-loading-rifles-on-historic-trends-in-firearm-progress/#easy-footnote-bottom-9-1370 \"From Wikimedia Commons: See page for author [Public domain]\")\n#### Other metrics\n\n\nIt is still possible that a combination of factors including fire rate contributed to a discontinuity in a military strength metric, or that a narrower metric including fire rate saw some discontinuity. \n\n\n*Thanks to Jesko Zimmerman for suggesting breech-loading rifles as a potential area of discontinuity.*\n\n\nNotes\n-----\n\n", "url": "https://aiimpacts.org/effects-of-breech-loading-rifles-on-historic-trends-in-firearm-progress/", "title": "Effects of breech loading rifles on historic trends in firearm progress", "source": "aiimpacts.org", "source_type": "wordpress", "date_published": "2019-12-23T07:53:06+00:00", "paged_url": "https://aiimpacts.org/feed?paged=10", "authors": ["Katja Grace"], "id": "8c91c0525ba874371a6695ccf18f44ab", "summary": []}
{"text": "Historic trends in transatlantic passenger travel\n\nThe speed of human travel across the Atlantic Ocean has seen at least seven discontinuities of more than ten years’ progress at past rates, two of which represented more than one hundred years’ progress at past rates: Columbus’ second journey, and the first non-stop transatlantic flight.\n\n\nDetails\n-------\n\n\nThis case study is part of AI Impacts’ [discontinuous progress investigation](https://aiimpacts.org/discontinuous-progress-investigation/).\n\n\n### Trends\n\n\n#### Transatlantic passenger crossing speed\n\n\nWe investigated fastest recorded passenger trips across the Atlantic Ocean over time. By ‘passenger’ we mean that any human made the crossing, or could have done.\n\n\nWe look for fastest speeds of real historic systems that could have with high probability delivered a live person across the Atlantic Ocean. We do not require that a person was actually sent by the method in question, though in fact all of our records did involve a passenger traveling. \n\n\nWe generally use whatever route was actually taken (or supposed in an estimate), and do not attempt to infer faster speeds possible had an optimal route been taken (though note that because we are measuring speed rather than time to cross the Ocean, route length is adjusted for to a first approximation). \n\n\n##### Data\n\n\nWe collated records of historic speeds to cross the Atlantic Ocean from online sources.[1](https://aiimpacts.org/historic-trends-in-transatlantic-passenger-travel/#easy-footnote-bottom-1-1860 \"See the ‘Passenger’ tab of this spreadsheet for our sources.\") These are available at the ‘Passenger’ tab of [this spreadsheet](https://docs.google.com/spreadsheets/d/11WV8JUIZeVNWKfggCmHaCEJrtG_YMiOdq18zjfwFUVk/edit?usp=sharing), and are shown in Figure 1 below. We have not verified this data.\n\n\n###### Detailed overview of data\n\n\nWe collected some data on speeds of drifting across the Atlantic Ocean and Viking ship speeds as evidence about the previous trend, but do not look for discontinuities until Columbus’ trips, for which relatively detailed descriptions are available. \n\n\nBetween then and 1841 the fastest records of transatlantic crossings we know of come from [Slavevoyages.org](http://Slavevoyages.org)‘s [database](https://slavevoyages.org/voyage/database#results) of over thirty six thousand voyages made by slave ships. We combined this data with distances between recorded ports for trips that might plausibly be fastest, to find speed records. This produced only three record trips. These were substantial outliers in speed, which suggests to us that those records may have been driven by error, or may have involved different types of ship or circumstances to the others. The latter explanation would suggest that faster trips were likely made for purposes other than slave transport, meaning that these slave trips were unlikely to represent discontinuities in crossing speed across all types of ship. Given this, and that we do not have data for other types of ship at that time, we do not measure discontinuities during this period. We do include these ships to estimate the longer term trend, for measuring later discontinuities. The existence of later discontinuities does not appear to be sensitive to whether we include outlier slave ships in the historic trend, or replace them with more credible slower slave ships.\n\n\nFrom 1841 to 1909 all of our records are from Wikipedia’s page, [Blue Riband](https://en.wikipedia.org/wiki/Blue_Riband). That page describes the Blue Riband was ‘an unofficial accolade given to the [passenger liner](https://en.wikipedia.org/wiki/Passenger_ship) crossing the Atlantic Ocean in regular service with the record highest speed’. It appears that this title was sought after, and the records during that time are dense, so this part of the dataset is probably relatively accurate and complete for passenger steam ships. The main potential gap in this data is that we cannot be sure there are not other types of boat at the time that traveled faster than passenger steam ships.\n\n\nFrom the first flight in 1919, speed records were held by planes. We found these in a variety of places, and we judged the data to be relatively complete when we ceased to find new records with moderate searching.\n\n\nWe are particularly interested in avoiding missing data just before apparent discontinuities, since continuous progress may look discontinuous if data is missing. There is a fifteen year gap before the Concorde discontinuity in 1973 where we didn’t find any records. However we note that a record for fastest subsonic Atlantic crossing set in 1979 was substantially slower than the Concorde. This means that if there were no other supersonic transatlantic crossings prior to the Concorde, the Concorde must have been substantially faster than the previous record even if we were missing some data. For instance if we were missing a 1965 record as fast as the 1979 record (which might make sense, since the 1979 record was set by a 1965 aircraft), then the Concorde would still be a discontinuity of around twenty years. We could not find other supersonic transatlantic crossings, but cannot rule them out.\n\n\n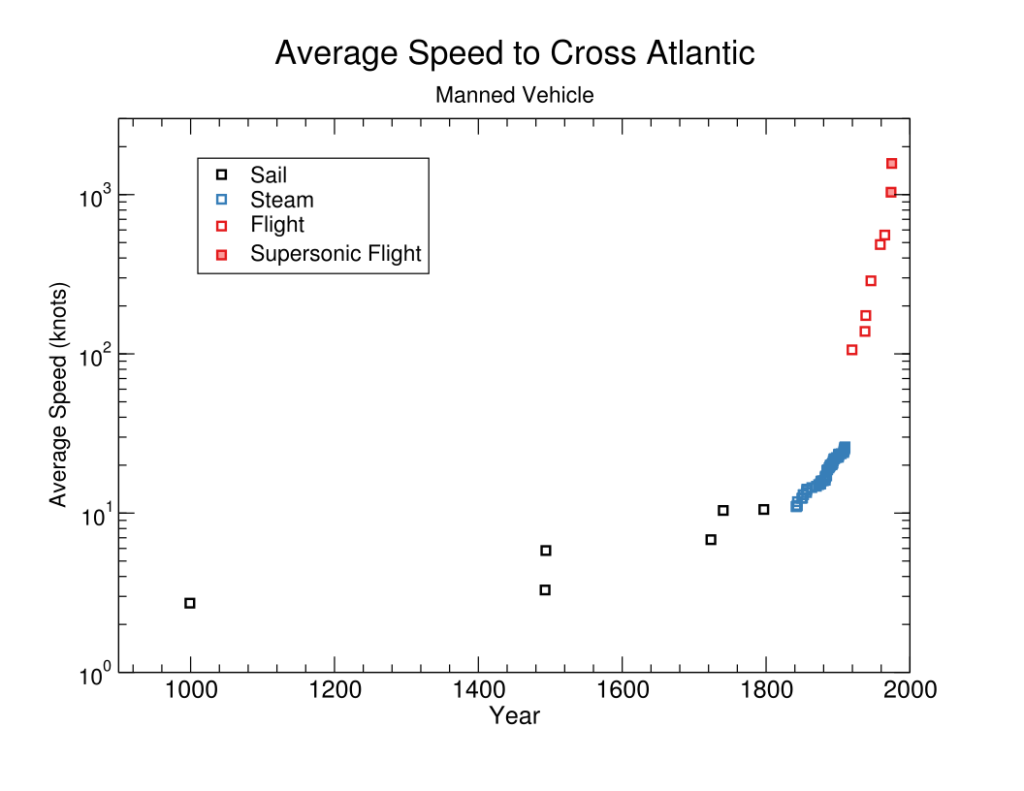Figure 1: Historical progress in passenger travel across the Atlantic\n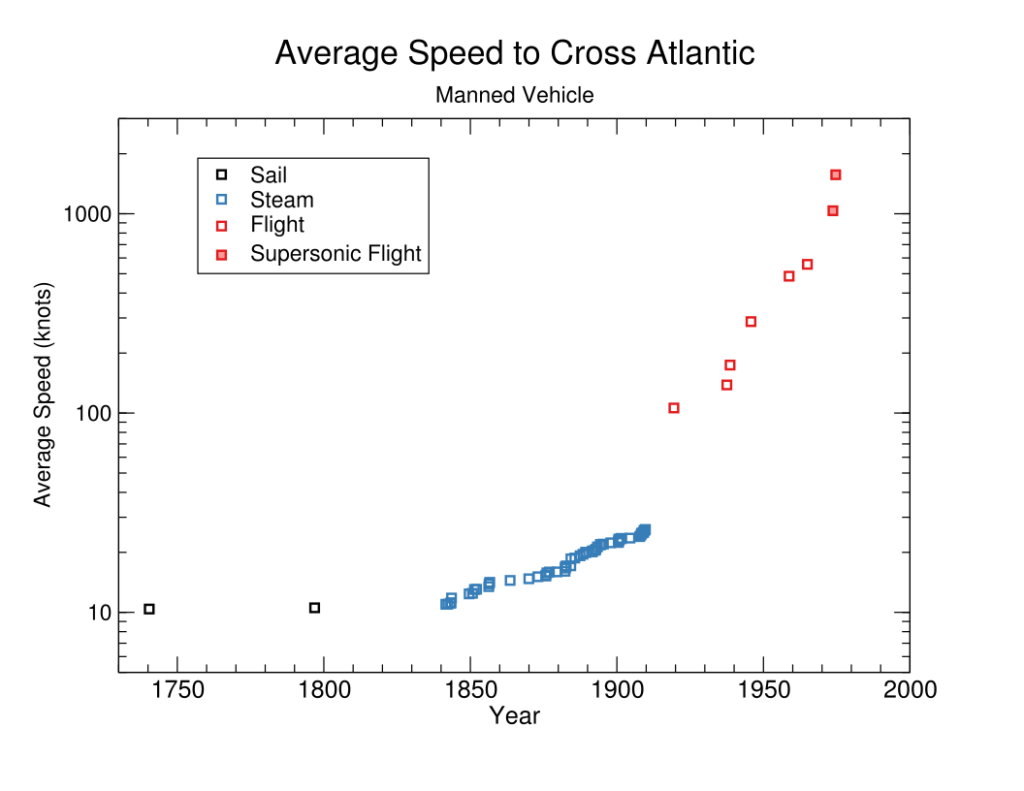 Figure 2: Historical progress in passenger travel across the Atlantic, since 1730\n##### Discontinuity measurement\n\n\nWe measure discontinuities by comparing progress made at a particular time to the past trend. For this purpose, we treat the past trend at any given point as exponential or linear depending on apparent fit, and judge a new trend to have begun when the recent trend has diverged sufficiently from the longer term trend. See [our spreadsheet](https://docs.google.com/spreadsheets/d/11WV8JUIZeVNWKfggCmHaCEJrtG_YMiOdq18zjfwFUVk/edit?usp=sharing), tab ‘Passenger’ to view the trends we break this data into, and [our methodology page](https://aiimpacts.org/methodology-for-discontinuity-investigation/#time-period-selection) for details on how to interpret our sheets and how we divide data into trends. \n\n\nGiven these judgments about past progress, there were seven greater than 10-year discontinuities during the periods that we looked at, summarized in the following table.[2](https://aiimpacts.org/historic-trends-in-transatlantic-passenger-travel/#easy-footnote-bottom-2-1860 \"See our methodology page for more details, and our spreadsheet, tab ‘Passenger’ for our calculation.\") Two of them were large (more than one hundred years of progress at previous rate).\n\n\n\n\n| | | | |\n| --- | --- | --- | --- |\n| **Date** | **Mode of transport** | **Knots** | **Discontinuity size (years progress at past rate)** |\n| 1493 | Columbus’ second voyage | 5.8 | 1465 |\n| 1884 | Oregon (steamship) | 18.6 | 10 |\n| 1919 | WWI Bomber (first non-stop transatlantic flight) | 106 | 351 |\n| 1938 | Focke-Wulf Fw 200 Condor | 174 | 19 |\n| 1945 | Lockheed Constellation | 288 | 25 |\n| 1973 | Concorde | 1035 | 19 |\n| 1974 | SR-71 | 1569 | 21 |\n\n\nIn addition to the sizes of these discontinuity in years, we have tabulated a number of other potentially relevant metrics [here](https://docs.google.com/spreadsheets/d/1iMIZ57Ka9-ZYednnGeonC-NqwGC7dKiHN9S-TAxfVdQ/edit?usp=sharing).[3](https://aiimpacts.org/historic-trends-in-transatlantic-passenger-travel/#easy-footnote-bottom-3-1860 \"See our methodology page for more details.\")\n##### Discussion of causes\n\n\nThe first measured discontinuity comes from Columbus’ second voyage being much quicker than his first. We expect this is for non-technological reasons, such as noise in crossing times (such that if there had been a longer history of crossing, Columbus’ first voyage would not have been record-setting), Columbus’ crew benefiting from experience, and the second voyage being intended to reach its destination rather than doing so accidentally.\n\n\nThe largest discontinuity we noted (352 years at previous rates) came from [the first non-stop transatlantic flight](https://en.wikipedia.org/wiki/Transatlantic_flight_of_Alcock_and_Brown), in 1919.[4](https://aiimpacts.org/historic-trends-in-transatlantic-passenger-travel/#easy-footnote-bottom-4-1860 \"“British aviators John Alcock and Arthur Brown made the first non-stop transatlantic flight in June 1919. They flew a modified First World War Vickers Vimy bomber from St. John’s, Newfoundland, to Clifden, Connemara, County Galway, Ireland.” – “Transatlantic Flight Of Alcock And Brown”. 2019. En.Wikipedia.Org. Accessed June 25 2019. https://en.wikipedia.org/w/index.php?title=Transatlantic_flight_of_Alcock_and_Brown&oldid=902818541.\") This represented a relatively fundamental change in the means of crossing the Atlantic, supporting the hypothesis that discontinuities tend to be associated with more fundamental technological progress.\n\n\nWe have not investigated the significance of the developments underlying the other smaller discontinuities.\n\n\nDuring the Blue Riband period, attention appears to have been given to Atlantic crossing speed in particular, suggesting that more effort may have been directed to this metric then. During the later era of flight, record Atlantic crossing time appears to have been less of a goal.[5](https://aiimpacts.org/historic-trends-in-transatlantic-passenger-travel/#easy-footnote-bottom-5-1860 \"For instance, the fastest crossing for a subsonic airliner achieved in 1979 was done in a 1965 plane, suggesting that such a record could plausibly have been set earlier (and before 1973 it would have been the record for any kind of flight, not just subsonic). The captain’s description also makes the attempt sound like it was unplanned and motivated by thinking it sounded feasible not long before, rather than a major effort. (See sheet for sources.) \") This, in combination with the much more incremental progress in the earlier era, weakly supports the hypothesis that discontinuities are associated with metrics that receive less attention.\n\n\nNotes\n-----\n\n\n\n", "url": "https://aiimpacts.org/historic-trends-in-transatlantic-passenger-travel/", "title": "Historic trends in transatlantic passenger travel", "source": "aiimpacts.org", "source_type": "wordpress", "date_published": "2019-12-05T00:07:19+00:00", "paged_url": "https://aiimpacts.org/feed?paged=10", "authors": ["Katja Grace"], "id": "9d8dc7ee1fa466ca79e3f329e871cdd2", "summary": []}
{"text": "Robin Hanson on the futurist focus on AI\n\n*By Asya Bergal, 13 November 2019*\n\n\n[](http://aiimpacts.org/wp-content/uploads/2019/11/robin_hanson.jpg)Robin Hanson\nRobert Long and I recently talked to Robin Hanson—GMU economist, prolific [blogger](http://www.overcomingbias.com/), and longtime thinker on the future of AI—about the amount of futurist effort going into thinking about AI risk.\n\n\nIt was noteworthy to me that Robin thinks human-level AI is a century, perhaps multiple centuries away— much longer than the 50-year number given by AI researchers. I think these longer timelines are the source of a lot of his disagreement with the AI risk community about how much of futurist thought should be put into AI. \n\n\n\nRobin is particularly interested in the notion of ‘lumpiness’– how much AI is likely to be furthered by a few big improvements as opposed to a slow and steady trickle of progress. If, as Robin believes, most academic progress and AI in particular are not likely to be ‘lumpy’, he thinks we shouldn’t think things will happen without a lot of warning.\n\n\nThe full recording and transcript of our conversation can be found [here](https://aiimpacts.org/conversation-with-robin-hanson/). \n\n\n", "url": "https://aiimpacts.org/robin-hanson-on-the-futurist-focus-on-ai/", "title": "Robin Hanson on the futurist focus on AI", "source": "aiimpacts.org", "source_type": "wordpress", "date_published": "2019-11-13T21:40:42+00:00", "paged_url": "https://aiimpacts.org/feed?paged=10", "authors": ["Asya Bergal"], "id": "f6ab98a5cf92f2f332d62743cc5d3c9a", "summary": []}
{"text": "Conversation with Robin Hanson\n\nAI Impacts talked to economist Robin Hanson about his views on AI risk and timelines. With his permission, we have posted and transcribed this interview.\n\n\n**Participants**\n----------------\n\n\n* [Robin Hanson](http://mason.gmu.edu/~rhanson/home.html) — Associate Professor of Economics, George Mason University\n* Asya Bergal – AI Impacts\n* [Robert Long](http://robertlong.online/) – AI Impacts\n\n\n**Summary**\n-----------\n\n\nWe spoke with Robin Hanson on September 5, 2019. Here is a brief summary of that conversation: \n\n\n\n* Hanson thinks that now is the wrong time to put a lot of effort into addressing AI risk:\n\t+ We will know more about the problem later, and there’s an opportunity cost to spending resources now vs later, so there has to be a compelling reason to spend resources now instead.\n\t+ Hanson is not compelled by existing arguments he’s heard that would argue that we need to spend resources now:\n\t\t- Hanson famously disagrees with the theory that [AI will appear very quickly and in a very concentrated way](http://intelligence.org/files/AIFoomDebate.pdf), which would suggest that we need to spend resources now because won’t have time to prepare.\n\t\t- Hanson views the AI risk problem as essentially continuous with existing principal agent problems, and [disagrees that the key difference](http://www.overcomingbias.com/2019/04/agency-failure-ai-apocalypse.html)—the agents being smarter—should clearly worsen such problems.\n\t+ Hanson thinks that we will see concrete signatures of problems before it’s too late– he is skeptical that there are big things that have to be coordinated ahead of time.\n\t\t- Relatedly, he thinks useful work anticipating problems in advance usually happens with concrete designs, not with abstract descriptions of systems.\n\t+ Hanson thinks we are still too far away from AI for field-building to be useful.\n* Hanson thinks AI is probably at least a century, perhaps multiple centuries away:\n\t+ Hanson thinks the mean estimate for human-level AI arriving is long, and he thinks AI is unlikely to be ‘lumpy’ enough to happen without much warning :\n\t\t- Hanson is interested in how ‘lumpy’ progress in AI is likely to be: whether progress is likely to come in large chunks or in a slower and steadier stream.\n\t\t\t* Measured in terms of how much a given paper is cited, academic progress is not lumpy in any field.\n\t\t\t* The literature on innovation suggests that innovation is not lumpy: most innovation is lots of little things, though once in a while there are a few bigger things.\n\t+ From an outside view perspective, the current AI boom does not seem different from previous AI booms.\n\t+ We don’t have a good sense of how much research needs to be done to get to human-level AI.\n\t+ If we don’t expect progress to be particularly lumpy, and we don’t have a good sense of exactly how close we are, we have good reason to think we are not e.g. five-years away rather than halfway.\n\t+ Hanson thinks we shouldn’t believe it when AI researchers give 50-year timescales:\n\t\t- Rephrasing the question in different ways, e.g. “When will most people lose their jobs?” causes people to give different timescales.\n\t\t- People consistently give overconfident estimates when they’re estimating things that are [abstract and far away](https://www.overcomingbias.com/2010/06/near-far-summary.html).\n* Hanson thinks AI risk takes up far too large a fraction of people thinking seriously about the future.\n\t+ Hanson thinks more futurists should be exploring other future scenarios, roughly proportionally to how likely they are with some kicker for extremity of consequences.\n\t+ Hanson doesn’t think that AI is that much worse than other future scenarios in terms of how much future value is likely to be destroyed.\n* Hanson thinks the key to intelligence is having many not-fully-general tools:\n\t+ Most of the value in tools is in more specific tools, and we shouldn’t expect intelligence innovation to be different.\n\t+ Academic fields are often simplified to simple essences, but real-life things like biological organisms and the industrial world progress via lots of little things, and we should expect intelligence to be more similar to the latter examples.\n* Hanson says the literature on human uniqueness suggests cultural evolution and language abilities came from several modest brain improvements, not clear differences in brain architecture.\n* Hanson worries that having so many people publicly worrying about AI risk before it is an acute problem will mean it is taken less seriously when it is, because the public will have learned to think of such concerns as erroneous fear mongering.\n* Hanson would be interested in seeing more work on the following things:\n\t+ Seeing examples of big, lumpy innovations that made a big difference to the performance of a system. This could change Hanson’s view of intelligence.\n\t\t- In particular, he’d be influenced by evidence for important architectural differences in the brains of humans vs. primates.\n\t+ Tracking of the automation of U.S. jobs over time as a potential proxy for AI progress.\n* Hanson thinks there’s a lack of engagement with critics from people concerned about AI risk.\n\t+ Hanson is interested in seeing concrete outside-view models people have for why AI might be soon.\n\t+ Hanson is interested in proponents of AI risk responding to the following questions:\n\t\t- Setting aside everything you know except what this looks like from the outside, would you predict AGI happening soon?\n\t\t- Should reasoning around AI risk arguments be compelling to outsiders outside of AI?\n\t\t- What percentage of people who agree with you that AI risk is big, agree for the same reasons that you do?\n* Hanson thinks even if we tried, we wouldn’t now be able to solve all the small messy problems that insects can solve, indicating that it’s not sufficient to have insect-level amounts of hardware.\n\t+ Hanson thinks that AI researchers might argue that we can solve the core functionalities of insects, but Hanson thinks that their intelligence is largely in being able to do many small things in complicated environments, robustly.\n\n\nSmall sections of the original audio recording have been removed. The corresponding transcript has been lightly edited for concision and clarity. \n\n\nAudio\n-----\n\n\n\nTranscript\n----------\n\n\n**Asya Bergal:** Great. Yeah. I guess to start with, the proposition we’ve been asking people to weigh in on is whether it’s valuable for people to be expending significant effort doing work that purports to reduce the risk from advanced AI. I’d be curious for your take on that question, and maybe a brief description of your reasoning there. \n\n\n\n**Robin Hanson:** Well, my highest level reaction is to say whatever effort you’re putting in, probably now isn’t the right time. When is the right time is a separate question from how much effort, and in what context. AI’s going to be a big fraction of the world when it shows up, so it certainly at some point is worth a fair bit of effort to think about and deal with. It’s not like you should just completely ignore it. \n\n\n\nYou should put a fair bit of effort into any large area of life or large area of the world, anything that’s big and has big impacts. The question is just really, should you be doing it way ahead of time before you know much about it at all, or have much concrete examples, know the– even structure or architecture, how it’s integrated in the economy, what are the terms of purchase, what are the terms of relationships. \n\n\n\nI mean, there’s just a whole bunch of things we don’t know about. That’s one of the reasons to wait–because you’ll know more later. Another reason to wait is because of the opportunity cost of resources. If you save the resources until later, you have more to work with. Those considerations have to be weighed against some expectation of an especially early leverage, or an especially early choice point or things like that. \n\n\n\nFor most things you expect that you should wait until they show themselves in a substantial form before you start to envision problems and deal with them. But there could be exceptions. Mostly it comes down to arguments that this is an exception. \n\n\n\n**Asya Bergal:** Yeah. I think we’re definitely interested in the proposition that you should put in work now as opposed to later. If you’re familiar with the arguments that this might be an exceptional case, I’d be curious for your take on those and where you disagree . \n\n\n\n**Robin Hanson:** Sure. As you may know, I started involving in this conversation over a decade ago with my co-blogger Eliezer Yudkowsky, and at that point, the major argument that he brought up was something we now call the Foom Argument. \n\n\n\nThat argument was a very particular one, that this would appear under a certain trajectory, under a certain scenario. That was a scenario where it would happen really fast, would happen in a very concentrated place in time, and basically once it starts, it happens so fast, you can’t really do much about it after that point. So the only chance you have is before that point. \n\n\n\nBecause it’s very hard to predict when or where, you’re forced to just do stuff early, because you’re never sure when is how early. That’s a perfectly plausible argument given that scenario, if you believe that it shows up in one time and place all of a sudden, fully formed and no longer influenceable. Then you only have the shot before that moment. If you are very unsure when and where that moment would be, then you basically just have to do it now. \n\n\n\nBut I was doubting that scenario. I was saying that that wasn’t a zero probability scenario, but I was thinking it was overestimated by him and other people in that space. I still think many people overestimate the probability of that scenario. Over time, it seems like more people have distanced themselves from that scenario, yet I haven’t heard as many substitute rationales for why we should do any of this stuff early. \n\n\n\nI did a recent blog post responding to a [Paul Christiano post](https://www.alignmentforum.org/posts/HBxe6wdjxK239zajf/what-failure-looks-like) and my title was [Agency FailureAI Apocalypse?](https://www.overcomingbias.com/2019/04/agency-failure-ai-apocalypse.html), and so at least I saw an argument there that was different from the Foom argument. It was an argument that you’d see a certain kind of agency failure with AI, and that because of that agency failure, it would just be bad. \n\n\n\nIt wasn’t exactly an argument that we need to do effort early, though. Even that argument wasn’t per se a reason why you need to do stuff way ahead of time. But it was an argument of why the consequences might be especially bad I guess, and therefore deserving of more investment. And then I critiqued that argument in my post saying he was basically saying the agency problem, which is a standard problem in all human relationships and all organizations, is exasperated when the agent is smart. \n\n\n\nAnd because the AI is, by assumption, very smart, then it’s a very exasperated agency problem; therefore, it goes really bad. I said, “Our literature on the agency problem doesn’t say that it’s a worse problem when they’re smart.” I just denied that basic assumption, pointing to what I’ve known about the agency literature over a long time. Basically Paul in his response said, “Oh, I wasn’t saying there was an agency problem,” and then I was kind of baffled because I thought that was the whole point of his post that I was summarizing. \n\n\n\nIn any case, he just said he was worried about wealth redistribution. Of course, any large social change has the potential to produce wealth redistribution, and so I’m still less clear why this change would be a bigger wealth distribution consequence than others, or why it would happen more suddenly, or require a more early effort. But if you guys have other particular arguments to talk about here, I’d love to hear what you think, or what you’ve heard are the best arguments aside from Foom. \n\n\n\n**Asya Bergal:** Yeah. I’m at risk of putting words in other people’s mouth here, because we’ve interviewed a bunch of people. I think one thing that’s come up repeatedly is- \n\n\n\n**Robin Hanson:** You aren’t going to name them. \n\n\n\n**Asya Bergal:** Oh, I definitely won’t give a name, but- \n\n\n\n**Robin Hanson:** I’ll just respond to whatever- \n\n\n\n**Asya Bergal:** Yeah, just prefacing this, this might be a strawman of some argument. One thing people are sort of consistently excited about is– they use the term ‘field building,’ where basically the idea is: AI’s likely to be this pretty difficult problem and if we do think it’s far away, there’s still sort of meaningful work we can do in terms of setting up an AI safety field with an increasing number of people who have an increasing amount of–the assumption is useful knowledge–about the field. \n\n\n\nThen sort of there’s another assumption that goes along with that that if we investigate problems now, even if we don’t know the exact specifics of what AGI might look like, they’re going to share some common sub problems with problems that we may encounter in the future. I don’t know if both of those would sort of count as field building in people’s lexicon. \n\n\n\n**Robin Hanson:** The example I would give to make it concrete is to imagine in the year 1,000, tasking people with dealing with various of our major problems in our society today. Social media addiction, nuclear war, concentration of capital and manufacturing, privacy invasions by police, I mean any major problem that you could think of in our world today, imagine tasking people in the year 1,000 with trying to deal with that problem. \n\n\n\nNow the arguments you gave would sound kind of silly. We need to build up a field in the year 1,000 to study nuclear annihilation, or nuclear conflict, or criminal privacy rules? I mean, you only want to build up a field just before you want to use a field, right? I mean, building up a field way in advance is crazy. You still need some sort of argument that we are near enough that the timescale on which it takes to build a field will match roughly the timescale until we need the field. If it’s a factor of ten off or a thousand off, then that’s crazy. \n\n\n\n**Robert Long:** Yeah. This leads into a specific question I was going to ask about your views. You’ve written based on AI practitioners estimates of how much progress they’ve been making that an outside view calculation suggests we probably have at least a century to go, if maybe a great many centuries at the current rates of progress in AI. That was in 2012. Is that still roughly your timeline? Are there other things that go into your timelines? Basically in general what’s your current AI timeline? \n\n\n\n**Robin Hanson:** Obviously there’s a median estimate and a mean estimate, and then there’s a probability per-unit-time estimate, say, and obviously most everyone agrees that the median or mean could be pretty long, and that’s reasonable. So they’re focused on some, “Yes, but what’s the probability of an early surprise.” \n\n\n\nThat isn’t directly addressed by that estimate, of course. I mean, you could turn that into a per-unit time if you just thought it was a constant per-unit time thing. That would, I think, be overly optimistic. That would give you too high an estimate I think. I have a series of blog posts, which you may have seen on lumpiness. A key idea here would be we’re getting AI progress over time, and how lumpy it is, is extremely directly relevant to these estimates. \n\n\n\nFor example, if it was maximally lumpy, if it just shows up at one point, like the Foom scenario, then in that scenario, you kind of have to work ahead of time because you’re not sure when. There’s a substantial… if like, the mean is two centuries, but that means in every year there’s a 1-in-200 chance. There’s a half-a-percent chance next year. Half-a-percent is pretty high, I guess we better do something, because what if it happens next year? \n\n\n\nOkay. I mean, that’s where extreme lumpiness goes. The less lumpy it is, then the more that the variance around that mean is less. It’s just going to take a long time, and it’ll take 10% less or 10% more, but it’s basically going to take that long. The key question is how lumpy is it reasonable to expect these sorts of things. I would say, “Well, let’s look at how lumpy things have been. How lumpy are most things? Even how lumpy has computer science innovation been? Or even AI innovation?” \n\n\n\nI think those are all relevant data sets. There’s general lumpiness in everything, and lumpiness of the kinds of innovation that are closest to the kinds of innovation postulated here. I note that one of our best or most concrete measures we have of lumpiness is citations. That is, we can take for any research idea, how many citations the seminal paper produces, and we say, “How lumpy are citations?” \n\n\n\nInterestingly, citation lumpiness seems to be field independent. Not just time independent, but field independent. Seems to be a general feature of academia, which you might have thought lumpiness would vary by field, and maybe it does in some more fundamental sense, but as it’s translated into citations, it’s field independent. And of course, it’s not that lumpy, i.e. most of the distribution of citations is papers with few citations, and the few papers that have the most citations constitute a relatively small fraction of the total citations. \n\n\n\nThat’s what we also know for other kinds of innovation literature. The generic innovation literature says that most innovation is lots of little things, even though once in a while there are a few bigger things. For example, I remember there’s this time series of the best locomotive at any one time. You have that from 1800 or something. You can just see in speed, or energy efficiency, and you see this point—. \n\n\n\nIt’s not an exactly smooth graph. On the other hand, it’s pretty smooth. The biggest jumps are a small fraction of the total jumpiness. A lot of technical, social innovation is, as we well understand, a few big things, matched with lots of small things. Of course, we also understand that big ideas, big fundamental insights, usually require lots of complementary, matching, small insights to make it work. \n\n\n\nThat’s part of why this trajectory happens this way. That smooths out and makes more effectively less lumpy the overall pace of progress in most areas. It seems to me that the most reasonable default assumption is to assume future AI progress looks like past computer science progress and even past technical progress in other areas. I mean, the most concrete example is AI progress. \n\n\n\nI’ve observed that we’ve had these repeated booms of AI concern and interest, and we’re in one boom now, but we saw a boom in the 90s. We saw a boom in the 60s, 70s, we saw a boom in the 30s. In each of these booms, the primary thing people point to is, “Look at these demos. These demos are so cool. Look what they can do that we couldn’t do before.” That’s the primary evidence people tend to point to in all of these areas. \n\n\n\nThey just have concrete examples that they were really impressed by. No doubt we have had these very impressive things. The question really is, for example, well, one question is, do we have any evidence that now is different? As opposed to evidence that there will be a big difference in the future. So if you’re asking, “Is now different,” then you’d want to ask, “Are the signs people point to now, i.e. AlphaGo, say, as a dramatic really impressive thing, how different are they as a degree than the comparable things that have happened in the past?” \n\n\n\nThe more you understand the past and see it, you saw how impressed people were back in the past with the best things that happened then. That suggests to me that, I mean AlphaGo is say a lump, I’m happy to admit it looks out of line with a smooth attribution of equal research progress to all teams at all times. But it also doesn’t look out of line with the lumpiness we’ve seen over the last 70 years, say, in computer innovation. \n\n\n\nIt’s on trajectory. So if you’re going to say, “And we still expect that same overall lumpiness for the next 70 years, or the next 700,” then I’d say then it’s about how close are we now? If you just don’t know how close you are, then you’re still going to end up with a relatively random, “When do we reach this threshold where it’s good enough?” If you just had no idea how close you were, how much is required. \n\n\n\nThe more you think you have an idea of what’s required and where you are, the more you can ask how far you are. Then if you say you’re only halfway, then you could say, “Well, if it’s taken us this many years to get halfway,” then the odds that we’re going to get all the rest of the way in the next five years are much less than you’d attribute to just randomly assigning say, “It’s going to happen in 200 years, therefore it’ll be one in two hundred per year.” I do think we’re in more of that sort of situation. We can roughly guess that we’re not almost there. \n\n\n\n**Robert Long:** Can you say a little bit more about how we should think about this question of how close we are? \n\n\n\n**Robin Hanson:** Sure. The best reliable source on that would be people who have been in this research area for a long time. They’ve just seen lots of problems, they’ve seen lots of techniques, they better understand what it takes to do many hard problems. They have a better sense of, no, they have a good sense of where we are, but ultimately where we have to go. \n\n\n\nI think when you don’t understand these things as well by theory or by experience, et cetera, you’re more tempted to look at something like AlphaGo and say, “Oh my God, we’re almost there.” Because you just say, “Oh, look.” You tend more to think, “Well, if we can do human level anywhere, we can do it everywhere.” That was the initial— what people in the 1960s said, “Let’s solve chess, and if we can solve chess, certainly we can do anything.” \n\n\n\nI mean, something that can do chess, it’s got to be smart. But they just didn’t fully appreciate the range of tasks, and problems, and problem environments, that you need to deal with. Once you understand the range of possible tasks, task environments, obstacles, issues, et cetera, once you’ve been in AI for a long time and have just seen a wide range of those things, then you have a more of a sense for “I see, AlphaGo, that’s a good job, but let’s list all these simplifying assumptions you made here that made this problem easier”, and you know how to make that list. \n\n\n\nThen you’re not so much saying, “If we can do this, we can do anything.” I think pretty uniformly, the experienced AI researchers have said, “We’re not close.” I mean I’d be very surprised if you interviewed any person with a more broad range of AI experience who said, “We’re almost there. If we can do this one more thing we can do everything.” \n\n\n\n**Asya Bergal:** Yeah. I might be wrong about this–my impression is that your estimate of at least a century or maybe centuries might still be longer than a lot of researchers–and this might be because there’s this trend where people will just say 50 years about almost any technology or something like that. \n\n\n\n**Robin Hanson:** Sure. I’m happy to walk through that. That’s the logic of that post of mine that you mentioned. It was exactly trying to confront that issue. So I would say there is a disconnect to be addressed. The people you ask are not being consistent when you ask similar things in different ways. The challenge is to disentangle that. \n\n\n\nI’m happy to admit when you ask a lot of people how long it will take, they give you 40, 50 year sort of timescales. Absolutely true. Question is, should you believe it? One way to check whether you should believe that is to see how they answer when you ask them different ways. I mean, as you know, I guess one of those surveys interestingly said, “When will most people lose their jobs?” \n\n\n\nThey gave much longer time scales than when will computers be able to do most everything, like a factor of two or something. That’s kind of bothersome. That’s a pretty close consistency relation. If computers can do everything cheaper, then they will, right? Apparently not. But I would think that, I mean, I’ve done some writing on this psychology concept called construal-level theory, which just really emphasizes how people have different ways they think about things conceived abstractly and broadly versus narrowly. \n\n\n\nThere’s a consistent pattern there, which is consistent with the pattern we are seeing here, that is in the far mode where you’re thinking abstractly and broadly, we tend to be more confident in simple, abstract theories that have simple predictions and you tend to neglect messy details. When you’re in the near mode and focus on a particular thing, you see all the messy difficulties. \n\n\n\nIt’s kind of the difference between will you have a happy marriage in life? Sure. This person you’re in a relationship with? Will that work in the next week? I don’t know. There’s all the things to work out. Of course, you’ll only have a happy relationship over a lifetime if every week keeps going okay for the rest of your life. I mean, if enough weeks do. That’s a near/far sort of distinction. \n\n\n\nWhen you ask people about AI in general and what time scale, that’s a very far mode sort of version of the question. They are aggregating, and they are going on very aggregate sort of theories in their head. But if you take an AI researcher who has been staring at difficult problems in their area for 20 years, and you ask them, “In the problems you’re looking at, how far have we gotten since 20 years ago?,” they’ll be really aware of all the obstacles they have not solved, succeeded in dealing with that, all the things we have not been able to do for 20 years. \n\n\n\nThat seems to me a more reliable basis for projection. I mean, of course we’re still in a similar regime. If the regime would change, then past experience is not relevant. If we’re in a similar regime of the kind of problems we’re dealing with and the kind of tools and the kind of people and the kind of incentives, all that sort of thing, then that seems to be much more relevant. That’s the point of that survey, and that’s the point of believing that survey somewhat more than the question asked very much more abstractly. \n\n\n\n**Asya Bergal:** Two sort of related questions on this. One question is, how many years out do you think it is important to start work on AI? And I guess, a related question is, now even given that it’s super unlikely, what’s the ideal number of people working about or thinking about this? \n\n\n\n**Robin Hanson:** Well, I’ve said many times in many of these posts that it’s not zero at any time. That is, whenever there’s a problem that it isn’t the right time to work on, it’s still the right time to have some people asking if it’s the right time to work on it. You can’t have people asking a question unless they’re kind of working on it. They’d have to be thinking about it enough to be able to ask the question if it’s the right time to work on it. \n\n\n\nThat means you always need some core of people thinking about it, at least, in related areas such they are skilled enough to be able to ask the question, “Hey, what do you think? Is this time to turn and work on this area?” It’s a big world, and eventually this is a big thing, so hey, a dozen could be fine. Given how random academia of course and the intellectual world is, the intellectual world is not at all optimized in terms of number of people per topic. It’s really not. \n\n\n\nRelative to that standard, you could be not unusually misallocated if you were still pretty random about it. For that it’s more just: for the other purposes that academic fields exist and perpetuate themselves, how well is it doing for those other purposes? I would basically say, “Academia’s mainly about showing people credentialing impressiveness.” There’s all these topics that are neglected because you can’t credential and impress very well via them. If AI risk was a topic that happened to be unusually able to be impressive with, then it would be an unusually suitable topic for academics to work on. \n\n\n\nNot because it’s useful, just because that’s what academics do. That might well be true for ways in which AI problems brings up interesting new conceptual angles that you could explore, or pushes on concepts that you need to push on because they haven’t been generalized in that direction, or just doing formal theorems that are in a new space of theorems. \n\n\n\nLike pushing on decision theory, right? Certainly there’s a point of view from which decision theory was kind of stuck, and people weren’t pushing on it, and then AI risk people pushed on some dimensions of decision theory that people hadn’t… people had just different decision theory, not because it’s good for AI. How many people, again, it’s very sensitive to that, right? You might justify 100 people if it not only was about AI risk, but was really more about just pushing on these other interesting conceptual dimensions. \n\n\n\nThat’s why it would be hard to give a very precise answer there about how many. But I actually am less concerned about the number of academics working on it, and more about sort of the percentage of altruistic mind space it takes. Because it’s a much higher percentage of that than it is of actual serious research. That’s the part I’m a little more worried about. Especially the fraction of people thinking about the future. I think of, just in general, very few people seem to be that willing to think seriously about the future. As a percentage of that space, it’s huge. \n\n\n\nThat’s where I most think, “Now, that’s too high.” If you could say, “100 people will work on this as researchers, but then the rest of the people talk and think about the future.” If they can talk and think about something else, that would be a big win for me because there are tens and hundreds of thousands of people out there on the side just thinking about the future and so, so many of them are focused on this AI risk thing when they really can’t do much about it, but they’ve just told themselves that it’s the thing that they can talk about, and to really shame everybody into saying it’s the priority. Hey, there’s other stuff. \n\n\n\nNow of course, I completely have this whole other book, Age of Em, which is about a different kind of scenario that I think doesn’t get much attention, and I think it should get more attention relative to a range of options that people talk about. Again, the AI risk scenario so overwhelmingly sucks up that small fraction of the world. So a lot of this of course depends on your base. If you’re talking about the percentage of people in the world working on these future things, it’s large of course. \n\n\n\nIf you’re talking percentage of people who are serious researchers in AI risk relative to the world, it’s tiny of course. Obviously. If you’re talking about the percentage of people who think about AI risk, or talk about it, or treat it very seriously, relative to people who are willing to think and talk seriously about the future, it’s this huge thing. \n\n\n\n**Robert Long:** Yeah. That’s perfect. I was just going to … I was already going to ask a follow-up just about what share of, I don’t know, effective altruists who are focused on affecting the long-term future do you think it should be? Certainly you think it should be far less than this, is what I’m getting there? \n\n\n\n**Robin Hanson:** Right. First of all, things should be roughly proportional to probability, except with some kicker for extremity of consequences. But I think you don’t actually know about extremity of consequences until you explore a scenario. Right from the start you should roughly write down scenarios by probability, and then devote effort in proportion to the probability of scenarios. \n\n\n\nThen once you get into a scenario enough to say, “This looks like a less extreme scenario, this looks like a more extreme scenario,” at that point, you might be justified in adjusting some effort, in and out of areas based on that judgment. But that has to be a pretty tentative judgment so you can’t go too far there, because until you explore a scenario a lot, you really don’t know how extreme… basically it’s about extreme outcomes times the extreme leverage of influence at each point along the path multiplied by each other in hopes that you could be doing things thinking about it earlier and producing that outcome. That’s a lot of uncertainty to multiply though to get this estimate of how important a scenario is as a leverage to think about. \n\n\n\n**Robert Long:** Right, yeah. Relatedly, I think one thing that people say about why AI should take up a large share is that there’s the sense that maybe we have some reason to think that AI is the only thing we’ve identified so far that could plausibly destroy all value, all life on earth, as opposed to other existential risks that we’ve identified. I mean, I can guess, but you may know that consideration or that argument. \n\n\n\n**Robin Hanson:** Well, surely that’s hyperbole. Obviously anything that kills everybody destroys all value that arises from our source. Of course, there could be other alien sources out there, but even AI would only destroy things from our source relative to other alien sources that would potentially beat out our AI if it produces a bad outcome. Destroying all value is a little hyperbolic, even under the bad AI scenario. \n\n\n\nI do think there’s just a wide range of future scenarios, and there’s this very basic question, how different will our descendants be, and how far from our values will they deviate? It’s not clear to me AI is that much worse than other scenarios in terms of that range, or that variance. I mean, yes, AIs could vary a lot in whether they do things that we value or not, but so could a lot of other things. There’s a lot of other ways. \n\n\n\nSome people, I guess some people seem to think, “Well, as long as the future is human-like, then humans wouldn’t betray our values.” No, no, not humans. But machines, machines might do it. I mean, the difference between humans and machines isn’t quite that fundamental from the point of view of values. I mean, human values have changed enormously over a long time, we are now quite different in terms of our habits, attitudes, and values, than our distant ancestors. \n\n\n\nWe are quite capable of continuing to make huge value changes in many directions in the future. I can’t offer much assurance that because our descendants descended from humans that they would therefore preserve most of your values. I just don’t see that. To the extent that you think that our specific values are especially valuable and you’re afraid of value drift, you should be worried. I’ve written about this: basically in the Journal of Consciousness Studies I commented on a Chalmers paper, saying that generically through history, each generation has had to deal with the fact that the next and coming generations were out of their control. \n\n\n\nNot just that, they were out of their control and their values were changing. Unless you can find someway to put some bound on that sort of value change, you’ve got to model it as a random walk; you could go off to the edge if you go off arbitrarily far. That means, typically in history, people if they thought about it, they’d realize we got relatively little control about where this is all going. And that’s just been a generic problem we’ve all had to deal with, all through history, AI doesn’t fundamentally change that fact, people focusing on that thing that could happen with AI, too. \n\n\n\nI mean, obviously when we make our first AIs we will make them corresponding to our values in many ways, even if we don’t do it consciously, they will be fitting in our world. They will be agents of us, so they will have structures and arrangements that will achieve our ends. So then the argument is, “Yes, but they could drift from there, because we don’t have a very solid control mechanism to make sure they don’t change a lot, then they could change a lot.” \n\n\n\nThat’s very much true, but that’s still true for human culture and their descendants as well, that they can also change a lot. We don’t have very much assurance. I think it’s just some people say, “Yeah, but there’s just some common human nature that’ll make sure it doesn’t go too far.” I’m not seeing that. Sorry. There isn’t. That’s not much of an assurance. When people can change people, even culturally, and especially later on when we can change minds more directly, start tinkering, start shared minds, meet more directly, or just even today we have better propaganda, better mechanisms of persuasion. We can drift off in many directions a long way. \n\n\n\n**Robert Long:** This is sort of switching topics a little bit, but it’s digging into your general disagreement with some key arguments about AI safety. It’s about your views on intelligence. So you’ve written that there may well be no powerful general theories to be discovered revolutionizing AI, and this is related to your view that most everything we’ve learned about intelligence suggests that the key to smarts is having many not-fully-general tools. Human brains are smart mainly by containing many powerful, not-fully-general modules and using many modules to do each task. \n\n\n\nYou’ve written that these considerations are one of the main reasons you’re skeptical about AI. I guess the question is, can you think of evidence that might change your mind? I mean, the general question is just to dig in on this train of thought; so is there evidence that would change your mind about this general view of intelligence? And relatedly, why do you think that other people arrive at different views of what intelligence is, and why we could have general laws or general breakthroughs in intelligence? \n\n\n\n**Robin Hanson:** This is closely related to the lumpiness question. I mean, basically you can not only talk about the lumpiness of changes in capacities, i.e., lumpiness in innovations. You can also talk about the lumpiness of tools in our toolkit. If we just look in industry, if we look in academia, if we look in education, just look in a lot of different areas, you will find robustly that most tools are more specific tools. \n\n\n\nMost of the value of tools–of the integral–is in more specific tools, and relatively little of it is in the most general tools. Again, that’s true in things you learn in school, it’s true about things you learn on the job, it’s true about things that companies learn that can help them do things. It’s true about nation advantages that nations have over other nations. Again, just robustly, if you just look at what do you know and how valuable is each thing, most of the value is in lots of little things, and relatively few are big things. \n\n\n\nThere’s a power law distribution with most of the small things. It’s a similar sort of lumpiness distribution to the lumpiness of innovation. It’s understandable. If tools have that sort of lumpy innovation, then if each innovation is improving a tool by some percentage, even a distribution percentage, most of the improvements will be in small things, therefore most of the improvements will be small. \n\n\n\nFew of the improvements will be a big thing, even if it’s a big improvement in a big thing, that’ll be still a small part of the overall distribution. So lumpiness in the size of tools or the size of things that we have as tools predicts that, in intelligence as well, most of the things that make you intelligent are lumpy little things. It comes down to, “Is intelligence different?” \n\n\n\nAgain, that’s also the claim about, “Is intelligence innovation different?” If, of course, you thought intelligence was fundamentally different in there being fewer and bigger lumps to find, then that would predict that in the future we would find fewer, bigger lumps, because that’s what there is to find. You could say, “Well, yes. In the past we’ve only ever found small lumps, but that’s because we weren’t looking at the essential parts of intelligence.” \n\n\n\nOf course, I’ll very well believe that related to intelligence, there are lots of small things. You might believe that there are also a few really big things, and the reason that in the past, computer science or education innovation hasn’t found many of them is that we haven’t come to the mother lode yet. The mother lode is still yet to be found. When we find it, boy it’ll be big. The belief, you’ll find that in intelligence innovation, is related to a belief that it exists, that it’s a thing to find, which we can relatedly believe that fundamentally, intelligence is simple. \n\n\n\nFundamentally, there’s some essential simplicity to it that when you find it, the pieces will be … each piece is big, because there aren’t very many pieces, and that’s implied by it being simple. It can’t be simple unless … if there’s 100,000 pieces, it’s not simple. If there’s 10 pieces, it could be simple, but then each piece is big. Then the question is, “What reason do you have to believe that intelligence is fundamentally simple?” \n\n\n\nI think, in academia, we often try to find simple essence in various fields. So there’d be the simple theory of utilitarianism, or the simple theory of even physical particles, or simple theory of quantum mechanics, or … so if your world is thinking about abstract academic areas like that, then you might say, “Well, in most areas, the essence is a few really powerful, simple ideas.” \n\n\n\nYou could kind of squint and see academia in that way. You can’t see the industrial world that way. That is, we have much clearer data about the world of biological organisms competing, or firms competing, or even nations competing. We have much more solid data about that to say, “It’s really lots of little things.” Then it becomes, you might say, “Yeah, but intelligence. That’s more academic.” Because your idea of intelligence is sort of intrinsically academic, that you think of intelligence as the sort of thing that best exemplary happens in the best academics. \n\n\n\nIf your model is ordinary stupid people, they have a stupid, poor intelligence, but they just know a lot, or have some charisma, or whatever it is, but Von Neumann, look at that. That’s what real intelligence is. Von Neumann, he must’ve had just five things that were better. He couldn’t have been 100,000 things that were better, had to be five core things that were better, because you see, he’s able to produce these very simple, elegant things, and he was so much better, or something like that. \n\n\n\nI actually do think this account is true, that many people have these sort of core emotional attitudinal relationships to the concept of intelligence. And that colors a lot of what they think about intelligence, including about artificial intelligence. That’s not necessarily tied to sort of the data we have on variations, and productivity, and performance, and all that sort of thing. It’s more sort of essential abstract things. Certainly if you’re really into math, in the world of math there are core axioms or core results that are very lumpy and powerful. \n\n\n\nOf course even there, again, distribution of math citations follows exactly the same distribution as all the other fields. By the citation measure, math is not more lumpy. But still, when you think about math, you like to think about these core, elegant, powerful results. Seeing them as the essence of it all. \n\n\n\n**Robert Long:** So you mentioned Von Neumann and people have a tendency to think that there must be some simple difference between Von Neumann and us. Obviously the other comparison people make which you’ve written about is the comparison between us as a species and other species. I guess, can you say a little bit about how you think about human uniqueness and maybe how that influences your viewpoint on intelligence? \n\n\n\n**Robin Hanson:** Sure. That, we have literatures that I just defer to. I mean, I’ve read enough to think I know what they say and that they’re relatively in agreement and I just accept what they say. So what the standard story is then, humans’ key difference was an ability to support cultural evolution. That is, human mind capacities aren’t that different from a chimpanzee’s overall, and an individual [human] who hasn’t had the advantage of cultural evolution isn’t really much better. \n\n\n\nThe key difference is that we found a way to accumulate innovations culturally. Now obviously there’s some difference in the sense that it does seem hard, even though we’ve tried today to teach culture to chimps, we’ve also had some remarkable success. But still it’s plausible that there’s something they don’t have quite good enough yet that let’s the mdo that, but then the innovations that made a difference have to be centered around that in some sense. \n\n\n\nI mean, obviously most likely in a short period of time, a whole bunch of independent unusual things didn’t happen. More likely there was one biggest thing that happened that was the most important. Then the question is what that is. We know lots of differences of course. This is the “what made humans different” game. There’s all these literatures about all these different ways humans were different. They don’t have hair on their skin, they walk upright, they have fire, they have language, blah, blah, blah. \n\n\n\nThe question is, “Which of these matter?” Because they can’t all be the fundamental thing that matters. Presumably, if they all happen in a short time, something was more fundamental that caused most of them. The question is, “What is that?” But it seems to me that the standard answer is right, it was cultural evolution. And then the question is, “Well, okay. But what enabled cultural evolution?” Language certainly seems to be an important element, although it also seems like humans, even before they had language, could’ve had some faster cultural evolution than a lot of other animals. \n\n\n\nThen the question is, “How big a brain difference or structure difference would it take?” Then it seems like well, if you actually look at the mechanisms of cultural evolution, the key thing is sitting next to somebody else watching what they’re doing, trying to do what they’re doing. So that takes certain observation abilities, and it takes certain mirroring abilities, that is, the ability to just map what they’re doing onto what you’re doing. It takes sort of fine-grained motor control abilities to actually do whatever it is they’re doing. \n\n\n\nThose seem like just relatively modest incremental improvements on some parameters, like chimps weren’t quite up to that. Humans could be more up to that. Even our language ability seems like, well, we have modestly different structured mouths that can more precisely control sounds and chimps don’t quite do that, so it’s understandable why they can’t make as many sounds as distinctly. The bottom line is that our best answer is it looks like there was a threshold passed, sort of ability supporting cultural evolution, which included the ability to watch people, the ability to mirror it, the ability to do it yourself, the ability to tell people through language or through more things like that. \n\n\n\nIt looks roughly like there was just a threshold passed, and that threshold allowed cultural evolution, and that’s allowed humans to take off. If you’re looking for some fundamental, architectural thing, it’s probably not there. In fact, of course people have said when you look at chimp brains and human brains in fine detail, you see pretty much the same stuff. It isn’t some big overall architectural change, we can tell that. This is pretty much the same architecture. \n\n\n\nLooks like it’s some tools we are somewhat better at and plausibly those are the tools that allow us to do cultural evolution. \n\n\n\n**Robert Long:** Yeah. I think that might be it for my questions on human uniqueness. \n\n\n\n**Asya Bergal:** I want to briefly go back to, I think I sort of mentioned this question, but we didn’t quite address it. At what timescale do you think people–how far out do you think people should be starting maybe the field building stuff, or starting actually doing work on AI? Maybe number of years isn’t a good metric for this, but I’m still curious for your take. \n\n\n\n**Robin Hanson:** Well, first of all, let’s make two different categories of effort. One category of effort is actually solving actual problems. Another category of effort might be just sort of generally thinking about the kind of problems that might appear and generally categorizing and talking about them. So most of the effort that will eventually happen will be in the first category. Overwhelmingly, most of the effort, and appropriately so. \n\n\n\nI mean, that’s true today for cars or nuclear weapons or whatever it is. Most of the effort is going to be dealing with the actual concrete problems right in front of you. That effort, it’s really hard to do much before you actually have concrete systems that you’re worried about, and the concrete things that can actually go wrong with them. That seems completely appropriate to me. \n\n\n\nI would say that sort of effort is mostly, well, you see stuff and it goes wrong, deal with it. Ahead of seeing problems, you shouldn’t be doing that. You could today be dealing with computer security, you can be dealing with hackers and automated tools to deal with them, you could be dealing with deep fakes. I mean, it’s fine time now to deal with actual, concrete problems that are in front of people today. \n\n\n\nBut thinking about problems that could occur in the future, that you haven’t really seen the systems that would produce them or even the scenarios that would play out, that’s much more the other category of effort, is just thinking abstractly about the kinds of things that might go wrong, and maybe the kinds of architectures and kinds of approaches, et cetera. That, again, is something that you don’t really need that many people to do. If you have 100 people doing it, probably enough. \n\n\n\nEven 10 people might be enough. It’s more about how many people, again, this mind space in altruistic futurism, you don’t need very much of that mind space to do it at all, really. Then that’s more the thing I complain that there’s too much of. Again, it comes down to how unusual will the scenarios be that are where the problem starts. Today, cars can have car crashes, but each crash is a pretty small crash, and happens relatively locally, and doesn’t kill that many people. You can wait until you see actual car crashes to think about how to deal with car crashes. \n\n\n\nThen the key question is, “How far do the scenarios we worry about deviate from that?” I mean, most problems in our world today are like that. Most things that go wrong in systems, we have our things that go wrong on a small scale pretty frequently, and therefore you can look at actual pieces of things that have gone wrong to inform your efforts. There are some times where we exceptionally anticipate problems that we never see. Then anticipate even institutional problems that we never see or even worry that by the time the problem gets here, it’ll be too late. \n\n\n\nThose are really unusual scenarios in problems. The big question about AI risk is what fraction of the problems that we will face about AI will be of that form. And then, to what extent can we anticipate those now? Because in the year 1,000, it would’ve been still pretty hard to figure out the unusual scenarios that might bedevil military hardware purchasing or something. Today we might say, “Okay, there’s some kind of military weapons we can build that yes, we can build them, but it might be better once we realize they can be built and then have a treaty with the other guys to have neither of us build them.” \n\n\n\nSometimes that’s good for weapons. Okay. That was not very common 1,000 years ago. That’s a newer thing today, but 1,000 years ago, could people have anticipated that, and then what usefully could they have done other than say, “Yeah, sometimes it might be worse having a treaty about not building a weapon if you figure out it’d be worse for you if you have both.” I’m mostly skeptical that there are sort of these big things that you have to coordinate ahead of time, that you have to anticipate, that if you wait it’s too late, that you won’t see actual concrete signatures of the problems before you have to invent them. \n\n\n\nEven today, large systems, you often tend to have to walk through a failure analysis. You build a large nuclear plant or something, and then you go through and try to ask everything that could go wrong, or every pair of things that could go wrong, and ask, “What scenarios would those produce?,” and try to find the most problematic scenarios. Then ask, “How can we change the design of it to fix those?” \n\n\n\nThat’s the kind of exercise we do today where we imagine problems that most of which never occur. But for that, you need a pretty concrete design to work with. You can’t do that very abstractly with the abstract idea. For that you need a particular plan in front of you, and now you can walk through concrete failure modes of all the combinations of this strut will break, or this pipe will burst, and all those you walk through. It’s definitely true that we often analyze problems that never appear, but it’s almost never in the context of really abstract sparse descriptions of systems. \n\n\n\n**Asya Bergal:** Got you. Yeah. We’ve been asking people a standard question which I think I can maybe guess your answer to. But the question is: what’s your credence that in a world where we didn’t have these additional EA-inspired safety efforts, what’s your credence that in that world AI poses a significant risk of harm? I guess this question doesn’t really get at how much efforts now are useful, it’s just a question about general danger. \n\n\n\n**Robin Hanson:** There’s the crying wolf effect, and I’m particularly worried about it. For example, space colonization is a thing that could happen eventually. And for the last 50 years, there have been enthusiasts who have been saying, “It’s now. It’s now. Now is the time for space colonization.” They’ve been consistently wrong. For the next 50 years, they’ll probably continue to be consistently wrong, but everybody knows there’s these people out there who say, “Space colonization. That’s it. That’s it.” \n\n\n\nWhenever they hear somebody say, “Hey, it’s time for space colonization,” they go, “Aren’t you one of those fan people who always says that?” The field of AI risk kind of has that same problem where again today, but for the last 70 years or even longer, there have been a subset of people who say, “The robots are coming, and it’s all going to be a mess, and it’s now. It’s about to be now, and we better deal with it now.” That creates sort of a skepticism in the wider world that you must be one of those crazies who keep saying that. \n\n\n\nThat can be worse for when there really is, when we really do have the possibility of space colonization, when it is really the right time, we might well wait too long after that, because people just can’t believe it, because they’ve been hearing this for so long. That makes me worried that this isn’t a positive effect. Calling attention to a problem, like a lot of attention to a problem, and then having people experience it as not a problem, when it looks like you didn’t realize that. \n\n\n\nNow, if you just say, “Hey, this nuclear power plant type could break. I’m not saying it will, but it could, and you ought to fix that,” that’s different than saying, “This pipe will break, and that’ll happen soon, and better do something.” Because then you lose credibility when the pipe doesn’t usually break. \n\n\n\n**Robert Long:** Just as a follow-up, I suppose the official line for most people working on AI safety is, as it ought to be, there’s some small chance that this could matter a lot, and so we better work on it. Do you have thoughts on ways of communicating that that’s what you actually think so that you don’t have this crying wolf effect? \n\n\n\n**Robin Hanson:** Well, if there are only the 100 experts, and not the 100,000 fans, this would be much easier. That does happen in other areas. There are areas in the world where there are only 100 experts and there aren’t 100,000 fans screaming about it. Then the experts can be reasonable and people can say, “Okay,” and take their word seriously, although they might not feel too much pressure to listen and do anything. If you can say that about computer security today, for example, the public doesn’t scream a bunch about computer security. \n\n\n\nThe experts say, “Hey, this stuff. You’ve got real computer security problems.” They say it cautiously and with the right degree of caveats that they’re roughly right. Computer security experts are roughly right about those computer security concerns that they warn you about. Most firms say, “Yeah, but I’ve got these business concerns immediately, so I’m just going to ignore you.” So we continue to have computer security problems. But at least from a computer security expert’s point of view, they aren’t suffering from the perception of hyperbole or actual hyperbole. \n\n\n\nBut that’s because there aren’t 100,000 fans of computer security out there yelling with them. But AI risk isn’t like that. AI risk, I mean, it’s got the advantage of all these people pushing and talking which has helped produce money and attention and effort, but it also means you can’t control the message. \n\n\n\n**Robert Long:** Are you worried that this reputation effect or this impression of hyperbole could bleed over and harm other EA causes or EA’s reputation in general, and if so are there ways of mitigating that effect? \n\n\n\n**Robin Hanson:** Well again, the more popular anything is, the harder it is for any center to mitigate whatever effects there are of popular periphery doing whatever they say and do. For example, I think there are really quite reasonable conservatives in the world who are at the moment quite tainted with the alt-right label, and there is an eager population of people who are eager to taint them with that, and they’re kind of stuck. \n\n\n\nAll they can do is use different vocabularies, have a different style and tone when they talk to each other, but they are still at risk for that tainting. A lot depends on the degree to which AI risk is seen as central to EA. The more it’s perceived as a core part of EA, then later on when it’s perceived as having been overblown and exaggerated, then that will taint EA. Not much way around that. I’m not sure that matters that much for EA though. \n\n\n\nI mean I don’t see EA as driven by popularity or popular attention. It seems it’s more a group of people who– it’s driven by the internal dynamics of the group and what they think about each other and whether they’re willing to be part of it. Obviously in the last century or so, we just had these cycles of hype about AI, so that’s … I expect that’s how this AI cycle will be framed– in the context of all the other concern about AI. I doubt most people care enough about EA for that to be part of the story. \n\n\n\nI mean, EA has just a little, low presence in people’s minds in general, that unless it got a lot bigger, it just would not be a very attractive element to put in the story to blame those people. They’re nobody. They don’t exist to most people. The computer people exaggerate. That’s a story that sticks better. That has stuck in the past. \n\n\n\n**Asya Bergal:** Yeah. This is zooming out again, but I’m curious: kind of around AI optimism, but also just in general around any of the things you’ve talked about in this interview, what sort of evidence you think that either we could get now, or might plausibly see in the future would change your views one way or the other? \n\n\n\n**Robin Hanson:** Well, I would like to see much more precise and elaborated data on the lumpiness of algorithm innovations and AI progress. And of course data on whether things are changing different[ly] now. For example, forgetting his name, somebody did a [blog post a few years ago](https://www.milesbrundage.com/blog-posts/alphago-and-ai-progress) right after AlphaGo, saying this Go achievement seemed off trend if you think about it by time, but not if you thought about it by computing resources devoted to the problem. If you looked at past level of Go ability relative to computer resources, then it was on trend, it wasn’t an exception. \n\n\n\nAny case, that’s relevant to the lumpiness issue, right? So the more that we could do a good job of calibrating how unusual things are, the more that we could be able talk about whether we are seeing unusual stuff now. That’s kind of often the way this conversation goes is, “Is this time different? Are we seeing unusual stuff now?” In order to do that, you want us to be able to calibrate these progresses as clearly as possible. \n\n\n\nObviously certainly if you could make some metric for each AI progress being such that you could talk about how important it was by some relative weighting in different fields, and relevant weighting of different kinds of advances, and different kinds of metrics for advances, then you can have some statistics of tracking over time the size of improvements and whether that was changing. \n\n\n\nI mean, I’ll also make a pitch for the data thing that I’ve just been doing for the last few years, which is the data on automation per job in the US, and the determinants of that and how that’s changed over time, and its impact over time. Basically there’s a dataset called O\\*NET and they’re broken into 800 jobs categories and jobs in the US, and for each job in the last 20 years, at some random times, some actual people went and rated each job on a one to five scale of how automated it was. \n\n\n\nNow we have those ratings. We are able to say what predicts which jobs are how automated, and has that changed over time? Then the answer is, we can predict pretty well, just like 25 variables lets us predict half the variance in which jobs are automated, and they’re pretty mundane things, they’re not high-tech, sexy things. It hasn’t changed much in 20 years. In addition, we can ask when jobs get more or less automated, how does that impact the number of employees and their wages. We find almost no impact on those things. \n\n\n\nA data series like that, if you kept tracking it over time, if there were a deviation from trend, you might be able to see it, you might see that the determinants of automation were changing, that the impacts were changing. This is of course just tracking actual AI impacts, not sort of extreme tail possibilities of AI impacts, right? \n\n\n\nOf course, this doesn’t break it down into AI versus other sources of automation. Most automation has nothing to do with AI research. It’s making a machine that whizzes and does something that a person was doing before. But if you could then find a way to break that down by AI versus not, then you could more focus on, “Is AI having much impact on actual business practice?,” and seeing that. \n\n\n\nOf course, that’s not really supporting the early effort scenario. That would be in support of, “Is it time now to actually prepare people for major labor market impacts, or major investment market impacts, or major governance issues that are actually coming up because this is happening now?” But you’ve been asking about, “Well, what about doing stuff early?” Then the question is, “Well, what signs would you have that it’s soon enough?” \n\n\n\nHonestly, again, I think we know enough about how far away we are from where we need to be, and we know we’re not close, and we know that progress is not that lumpy. So we can see, we have a ways to go. It’s just not soon. We’re not close. It’s not time to be doing things you would do when you are close or soon. But the more that you could have these expert judgments of, “for any one problem, how close are we?,” and it could just be a list of problematic aspects of problems and which of them we can handle so far and which we can’t. \n\n\n\nThen you might be able to, again, set up a system that when you are close, you could trigger people and say, “Okay, now it’s time to do field building,” or public motivation, or whatever it is. It’s not time to do it now. Maybe it’s time to set up a tracking system so that you’ll find out when it’s time. \n\n\n\n**Robert Long:** On that cluster of issues surrounding human uniqueness, other general laws of intelligence, is there evidence that could change your mind on that? I don’t know. Maybe it could come from psychology, or maybe it could come from anthropology, new theories of human uniqueness, something like that? \n\n\n\n**Robin Hanson:** The most obvious thing is to show me actual big lumpy, lumpy innovations that made a big difference to the performance of the system. That would be the thing. Like I said, for many years I was an AI researcher, and I noticed that researchers often created systems, and systems have architectures. So their paper would have a box diagram for an architecture, and explain that their system had an architecture and that they were building on that architecture. \n\n\n\nBut it seemed to me that in fact, the architectures didn’t make as much difference as they were pretending. In the performance of the system, most systems that were good, were good because they just did a lot of work to make that whole architecture work. But you could imagine doing counterfactual studies where you vary the effort you go into filling the concept of a system and you vary the architecture. You quantitatively find out how much does architecture matter. \n\n\n\nThere could be even already existing data out there in some form or other that somebody has done the right sort of studies. So it’s obvious that architecture makes some difference. Is it a factor of two? Is it 10%? Is it a factor of 100? Or is it 1%? I mean, that’s really what we’re arguing about. If it’s a factor of 10% then you say, “Okay, it matters. You should do it. You should pay attention to that 10%. It’s well worth putting the effort into getting that 10%.” \n\n\n\nBut it doesn’t make that much of a difference in when this happens and how big it happens. Right? Or if architecture is a factor of 10 or 100, now you can have a scenario where somebody finds a better architecture and suddenly they’re a factor of 100 better than other people. Now that’s a huge thing. That would be a way to ask a question, “How much of an advance can a new system get relative to other systems?,” would be to say, “how much of a difference does a better architecture matter?” \n\n\n\nAnd that’s a thing you can actually study directly by having people make systems with different architectures, put different spots of reference into it, et cetera, and see what difference it makes. \n\n\n\n**Robert Long:** Right. And I suspect that some people think that homo sapiens are such a data point, and that it sounds like you disagree with how they’ve construed that. Do you think there’s empirical evidence waiting to change your mind, or do you think people are just sort of misconstruing it, or are ignorant, or just not thinking correctly about what we should make of the fact of our species dominating the planet? \n\n\n\n**Robin Hanson:** Well, there’s certainly a lot of things we don’t know as well about primate abilities, so again, I’m reflecting what I’ve read about cultural evolution and the difference between humans and primates. But you could do more of that, and maybe the preliminary indications that I’m hearing about are wrong. Maybe you’ll find out that no, there is this really big architectural difference in the brain that they didn’t notice, or that there’s some more fundamental capability introduction. \n\n\n\nFor example, abstraction is something we humans do, and we don’t see animals doing much of it, but this construal-level theory thing I described and standard brain architecture says actually all brains have been organized by abstraction for a long time. That is, we see a dimension of the brain which is the abstract to the concrete, and we see how it’s organized that way. But we humans seem to be able to talk about abstractions in ways that other animals don’t. \n\n\n\nSo a key question is, “Do we have some extra architectural thing that lets us do more with abstraction?” Because again, most brains are organized by abstraction and concrete. That’s just one of the main dimensions of brains. The forebrain versus antebrain is concrete versus abstraction. Then the more we just knew about brain architecture and why it was there, the more we can concretely say whether there was a brain architectural innovation from primates to humans. \n\n\n\nBut everything I’ve heard says it seems to be mostly a matter of relevant emphasis of different parts, rather than some fundamental restructuring. But even small parts can be potent. So one way actually to think about it is that most ordinary programs spend most of the time in just a few lines of code. Then so if you have 100,000 lines of code, it could still only be 100 lines, there’s 100 lines of code where 90% of the time is being spent. That doesn’t mean those 100,000 lines don’t matter. When you think about implementing code on the brain, you realize because the brain is parallel, whatever 90% of the code has been, that’s going to be 90% of the volume of the brain. \n\n\n\nThose other 100,000 lines of code will take up relatively little space, but they’re still really important. A key issue at the brain is you might find out that you understand 90% of the volume as a simple structure following a simple algorithm and you can still hardly understand anything about this total algorithm, because it’s all the other parts that you don’t understand where stuff isn’t executing very often, but it still needs to be there to make the whole thing work. That’s a very problematic thing about understanding brain organization at all. \n\n\n\nYou’re tempted to go by volume and try to understand because volume is visible first, and whatever volume you can opportunistically understand, but you could still be a long way off from understanding. Just like if you had any big piece of code and you understood 100 lines of it, out of 100,000 lines, you might not understand very much at all. Of course, if that was the 100 lines that was being executed most often, you’d understand what it was doing most of the time. You’d definitely have a handle on that, but how much of the system would you really understand? \n\n\n\n**Asya Bergal:** We’ve been interviewing a bunch of people. Are there other people who you think have well-articulated views that you think it would be valuable for us to talk to or interview? \n\n\n\n**Robin Hanson:** My experience is that I’ve just written on this periodically over the years, but I get very little engagement. Seems to me there’s just a lack of a conversation here. Early on, Eliezer Yudkowsky and I were debating, and then as soon as he and other people just got funding and recognition from other people to pursue, then they just stopped engaging critics and went off on pursuing their stuff. \n\n\n\nWhich makes some sense, but these criticisms have just been sitting and waiting. Of course, what happens periodically is they are most eager to engage the highest status people who criticize them. So periodically over the years, some high-status person will make a quip, not very thought out, at some conference panel or whatever, and they’ll be all over responding to that, and sending this guy messages and recruiting people to talk to him saying, “Hey, you don’t understand. There’s all these complications.” \n\n\n\nWhich is different from engaging the people who are the longest, most thoughtful critics. There’s not so much of that going on. You are perhaps serving as an intermediary here. But ideally, what you do would lead to an actual conversation. And maybe you should apply for funding to have an actual event where people come together and talk to each other. Your thing could be a preliminary to get them to explain how they’ve been misunderstood, or why your summary missed something; that’s fine. If it could just be the thing that started that actual conversation it could be well worth the trouble. \n\n\n\n**Asya Bergal:** I guess related to that, is there anything you wish we had asked you, or any other things sort of you would like to be included in this interview? \n\n\n\n**Robin Hanson:** I mean, you sure are relying on me to know what the main arguments are that I’m responding to, hence you’re sort of shy about saying, “And here are the main arguments, what’s your response?” Because you’re shy about putting words in people’s mouths, but it makes it harder to have this conversation. If you were taking a stance and saying, “Here’s my positive argument,” then I could engage you more. \n\n\n\nI would give you a counterargument, you might counter-counter. If you’re just trying to roughly summarize a broad range of views then I’m limited in how far I can go in responding here. \n\n\n\n**Asya Bergal:** Right. Yeah. I mean, I don’t think we were thinking about this as sort of a proxy for a conversation. \n\n\n\n**Robin Hanson:** But it is. \n\n\n\n**Asya Bergal:** But it is. But it is, right? Yeah. I could maybe try to summarize some of the main arguments. I don’t know if that seems like something that’s interesting to you? Again, I’m at risk of really strawmanning some stuff. \n\n\n\n**Robin Hanson:** Well, this is intrinsic to your project. You are talking to people and then attempting to summarize them. \n\n\n\n**Asya Bergal:** That’s right, that’s right. \n\n\n\n**Robin Hanson:** If you thought it was actually feasible to summarize people, then what you would do is produce tentative summaries, and then ask for feedback and go back and forth in rounds of honing and improving the summaries. But if you don’t do that, it’s probably because you think even the first round of summaries will not be to their satisfaction and you won’t be able to improve it much. \n\n\n\nWhich then says you can’t actually summarize that well. But what you can do is attempt to summarize and then use that as an orienting thing to get a lot of people to talk and then just hand people the transcripts and they can get what they can get out of it. This is the nature of summarizing conversation; this is the nature of human conversation. \n\n\n\n**Asya Bergal:** Right. Right. Right. Of course. Yeah. So I’ll go out on a limb. We’ve been talking largely to people who I think are still more pessimistic than you, but not as pessimistic as say, MIRI. I think the main difference between you and the people we’ve been talking to is… I guess two different things. \n\n\n\nThere’s a sort of general issue which is, how much time do we have between now and when AI is coming, and related to that, which I think we also largely discussed, is how useful is it to do work now? So yeah, there’s sort of this field building argument, and then there are arguments that if we think something is 20 years away, maybe we can make more robust claims about what the geopolitical situation is going to look like. \n\n\n\nOr we can pay more attention to the particular organizations that might be making progress on this, and how things are going to be. There’s a lot of work around assuming that maybe AGI’s actually going to look somewhat like current techniques. It’s going to look like deep reinforcement and ML techniques, plus maybe a few new capabilities. Maybe from that perspective we can actually put effort into work like interpretability, like adversarial training, et cetera. \n\n\n\nMaybe we can actually do useful work to progress that. A concrete version of this, Paul Christiano has this approach that I think MIRI is very skeptical of, addressing prosaic –AI that looks very similar to the way AI looks now. I don’t know if you’re familiar with iterated distillation and amplification, but it’s sort of treating this AI system as a black box, which is a lot of what it looks like if they’re in a world that’s close to the one now, because neural nets are sort of black box-y. \n\n\n\nTreating it as a black box, there’s some chance that this approach where we basically take a combination of smart AIs and use that to sort of verify the safety of a slightly smarter AI, and sort of do that process, bootstrapping. And maybe we have some hope of doing that, even if we don’t have access to the internals of the AI itself. Does that make sense? The idea is sort of to have an approach that works even with black box sort of AIs that might look similar to the neural nets we have now. \n\n\n\n**Robin Hanson:** Right. I would just say the whole issue is how plausible is it that within 20 years we’ll have human level, broad human-level AI on the basis of these techniques that we see now? Obviously the higher probability you think that is, then the more you think it’s worth doing that. I don’t have any objection at all with conditional on that assumption, his strategies. It would just be, how likely is that? And not only–it’s okay for him to work on that–it’s just more, how big a fraction of mind space does that take up among the wider space of people worried about AI risk? \n\n\n\n**Asya Bergal:** Yeah. Many of the people that we’ve talked to have actually agreed that it’s taking up too much mind space, or they’ve made arguments of the form, “Well, I am a very technical person, who has a lot of compelling thoughts about AI safety, and for me personally I think it makes sense to work on this. Not as sure that as many resources should be devoted to it.” I think at least a reasonable fraction of people would agree with that. *[Note:* *It’s wrong that many of the people we interviewed said this. This comment was on the basis of non-public conversations that I’ve had.]* \n\n\n\n**Robin Hanson:** Well, then maybe an interesting follow-up conversation topic would be to say, “what concretely could change the percentage of mind space?” That’s different than … The other policy question is like, “How many research slots should be funded?” You’re asking what are the concrete policy actions that could be relevant to what you’re talking about. The most obvious one I would think is people are thinking in terms of how many research slots should be funded of what sort, when. \n\n\n\nBut with respect to the mind space, that’s not the relevant policy question. The policy question might be some sense of how many scenarios should these people be thinking in terms of. Or what other scenarios should get more attention. \n\n\n\n**Asya Bergal:** Yeah, I guess I’m curious on your take on that. If you could just control the mind space in some way, or sort of set what people were thinking about or what directions, what do you think it would look like? \n\n\n\n**Robert Long:** Very quickly, I think one concrete operationalization of “mind space resource” is what 80,000 Hours tells people to do, with young, talented people say. \n\n\n\n**Robin Hanson:** That’s even more plausible. I mean, I would just say, study the future. Study many scenarios in the future other than this scenario. Go actually generate scenarios, explore them, tell us what you found. What are the things that could go wrong there? What are the opportunities? What are the uncertainties? Just explore a bunch of future scenarios and report. That’s just a thing that needs to happen. \n\n\n\nOther than AI risk. I mean, AI risk is focused on one relatively narrow set of scenarios, and there’s a lot of other scenarios to explore, so that would be a sense of mind space and career work is just say, “There’s 10 or 100 people working in this other area, I’m not going to be that …” \n\n\n\nThen you might just say, concretely, the world needs more futurists. If under these … the future is a very important place, but we’re not sure how much leverage we have about it. We just need more scenarios explored, including for each scenario asking what leverage there might be. \n\n\n\nThen I might say we’ve had a half-dozen books in the last few years about AI risks. How about a book that has a whole bunch of other scenarios, one of which is AI risk which takes one chapter out of 20, and 19 other chapters on other scenarios? And then if people talked about that and said it was a cool book and recommended it, and had keynote speakers about that sort of thing, then it would shift the mind space. People would say, “Yeah. AI risk is definitely one thing, people should be looking at it, but here’s a whole bunch of other scenarios.” \n\n\n\n**Asya Bergal:** Right. I guess I could also try a little bit to zero in… I think a lot of the differences in terms of people’s estimates for numbers of years are modeling differences. I think you have this more outside view model of what’s going on, looking at lumpiness. \n\n\n\nI think one other common modeling choice is to say something like, “We think progress in this field is powered by compute; here’s some extrapolation that we’ve made about how compute is going to grow,” and maybe our estimates of how much compute is needed to do some set of powerful things. I feel like with those estimates, then you might think things are going to happen sooner? I don’t know how familiar you are with that space of arguments or what your take is like. \n\n\n\n**Robin Hanson:** I have read most all of the AI Impacts blog posts over the years, just to be clear. \n\n\n\n**Asya Bergal:** Great. Great. \n\n\n\n**Robin Hanson:** You have a set of posts on that. So the most obvious data point is maybe we’re near the human equivalent compute level now, but not quite there. We passed the mice level a while ago, right? Well, we don’t have machines remotely capable of doing what mice do. So it’s clear that merely having the computing-power equivalent is not enough. We have machines that went past the cockroach far long ago. We certainly don’t have machines that can do all the things cockroaches can do. \n\n\n\nIt’s just really obvious I think, looking at examples like that, that computing power is not enough. We might hit a point where we have so much computing power that you can do some sort of fast search. I mean, that’s sort of the difference between machine learning and AI as ways to think about this stuff. When you thought about AI you just thought about, “Well, you have to do a lot of work to make the system,” and it was computing. And then it was kind of obvious, well, duh, well you need software, hardware’s not enough. \n\n\n\nWhen you say machine learning people tend to have more hope– Well, we just need some general machine learning algorithm and then you turn that on and then you find the right system and then the right system is much cheaper to execute computationally. The threshold you need is a lot more computing power than the human brain has to execute the search, but it won’t be that long necessarily before we have a lot more. \n\n\n\nThen now it’s an issue of how simple is this thing you’re searching for and how close are current machine learning systems to what you need? The more you think that a machine learning system like we have now could basically do everything, if only it were big enough and had enough data and computing power, it’s a different perspective than if you think we’re not even close to having the right machine learning techniques. There’s just a bunch of machine learning problems that we know we’ve solved that these systems just don’t solve. \n\n\n\n**Asya Bergal:** Right. \n\n\n\n**Robert Long:** So on that question, I can’t pull up the exact quote quickly enough, but I may insert it in the transcript, with permission. Paul Christiano has said more or less, in an 80,000 Hours interview, that he’s very unsure, but he suspects that we might be at insect-level capabilities if we devoted, if we wanted to, if people took it upon themselves to take the compute we have and the resources that we have, we could do what insects do.[1](https://aiimpacts.org/conversation-with-robin-hanson/#easy-footnote-bottom-1-2121 \"The actual quote is, “Things like, right now we’re kind of at the stage where AI systems are … the sophistication is probably somewhere in the range of insect abilities. That’s my current best guess. And I’m very uncertain about that. … One should really be diving into the comparison to insects now and say, can we really do this? It’s plausible to me that that’s the kind of … If we’re in this world where our procedures are similar to evolution, it’s plausible to me the insect thing should be a good indication, or one of the better indications, that we’ll be able to get in advance.” from his podcast with 80,000 Hours.\") \n\n\n\nHe’s interested in maybe concretely testing this hypothesis that you just mentioned, humans and cockroaches. But it sounds like you’re just very skeptical of it. It sounds like you’re already quite confident that we are not at insect level. Can you just say a little bit more about why you think that? \n\n\n\n**Robin Hanson:** Well, there’s doing something a lot like what insects do, and then there’s doing exactly what insects do. And those are really quite different tasks, and the difference is in part how forgiving you are about a bunch of details. I mean, there’s some who may say an image recognition or something, or even Go… Cockroaches are actually managing a particular cockroach body in a particular environment. They’re pretty damn good at that. \n\n\n\nIf you wanted to make an artificial cockroach that was as good as cockroaches at the thing that the cockroach does, I think we’re a long way off from that. But you might think most of those little details aren’t that important. They’re just a lot of work and that maybe you could make a system that did what you think of as the essential core problems similarly. \n\n\n\nNow we’re back to this key issue of the division between a few essential core problems and a lot of small messy problems. I basically think the game is in doing them all. Do it until you do them all. When doing them all, include a lot of the small messy things. So that’s the idea that your brain is 100,000 lines of code, and 90% of the brain volume is 100 of those lines, and then there’s all these little small, swirly structures in your brain that manage the small little swirly tasks that don’t happen very often, but when they do, that part needs to be there. \n\n\n\nWhat percentage of your brain volume would be enough to replicate before you thought you were essentially doing what a human does? I mean, that is sort of an essential issue. If you thought there were just 100 key algorithms and once you got 100 of them then you were done, that’s different than thinking, “Sure, there’s 100 main central algorithms, plus there’s another 100,000 lines of code that just is there to deal with very, very specific things that happen sometimes.” \n\n\n\nAnd that evolution has spent a long time searching in the space of writing that code and found these things and there’s no easy learning algorithm that will find it that isn’t in the environment that you were in. This is a key question about the nature of intelligence, really. \n\n\n\n**Robert Long:** Right. I’m now hijacking this interview to be about this insect project that AI Impacts is also doing, so apologies for that. We were thinking maybe you can isolate some key cognitive tasks that bees can do, and then in simulation have something roughly analogous to that. But it sounds like you’re not quite satisfied with this as a test of the hypothesis, where you can do all the little bee things and control bee body and wiggle around just like bees do and so forth? \n\n\n\n**Robin Hanson:** I mean, if you could attach it to an artificial bee body and put it in a hive and see what happens, then I’m much more satisfied. If you say it does the bee dance, it does the bee smell, it does the bee touch, I’ll go, “That’s cute, but it’s not doing the bee.” \n\n\n\n**Robert Long:** Then again, it just sounds like how satisfied you are with these abstractions, depends on your views of intelligence and how much can be abstracted away– \n\n\n\n**Robin Hanson:** It depends on your view of the nature of the actual problems that most animals and humans face. They’re a mixture of some structures with relative uniformity across a wide range; that’s when abstraction is useful. Plus, a whole bunch of messy details that you just have to get right. \n\n\n\nIn some sense I’d be more impressed if you could just make an artificial insect that in a complex environment can just be an insect, and manage the insect colonies, right? I’m happy to give you a simulated house and some simulated dog food, and simulated predators, who are going to eat the insects, and I’m happy to let you do it all in simulation. But you’ve got to show me a complicated world, with all the main actual obstacles that insects have to surviving and existing, including parasites and all sorts of things, right? \n\n\n\nAnd just show me that you can have something that robustly works in an environment like that. I’m much more impressed by that than I would be by you showing an actual physical device that does a bee dance. \n\n\n\n**Asya Bergal**: Yeah. I mean, to be clear, I think the project is more about actually finding a counterexample. If we could find a simple case where we can’t even do this with neural networks then it’s fairly … there’s a persuasive case there. \n\n\n\n**Robin Hanson:** But then of course people might a month later say, “Oh, yeah?” And then they work on it and they come up with a way to do that, and there will never be an end to that game. The moment you put up this challenge and they haven’t done it yet– \n\n\n\n**Asya Bergal:** Yeah. I mean, that’s certainly a possibility. \n\n\n\n**Robert Long:** Cool. I guess I’m done for now hijacking this interview to be about bees, but that’s just been something I’ve been thinking about lately. \n\n\n\n**Asya Bergal:** I would love to sort of engage with you on your disagreements, but I think a lot of them are sort of like … I think a lot of it is in this question of how close are we? And I think I only know in the vaguest terms people’s models for this. \n\n\n\nI feel like I’m not sure how good in an interview I could be at trying to figure out which of those models is more compelling. Though I do think it’s sort of an interesting project because it seems like lots of people just have vastly different sorts of timelines models, which they use to produce some kind of number. \n\n\n\n**Robin Hanson:** Sure. I suppose you might want to ask people you ask after me sort of the relative status of inside and outside arguments. And who sort of has the burden of proof with respect to which audiences. \n\n\n\n**Asya Bergal:** Right. Right. I think that’s a great question. \n\n\n\n**Robin Hanson:** If we’ve agreed that the outside view doesn’t support short time scales of things happening, and we say, “But yes, some experts think they see something different in their expert views of things with an inside view,” then we can say, “Well, how often does that happen?” We can make the outside view of that. We can say, “Well, how often do inside experts think they see radical potential that they are then inviting other people to fund and support, and how often are they right?” \n\n\n\n**Asya Bergal:** Right. I mean, I don’t think it’s just inside/outside view. I think there are just some outside view arguments that make different modeling choices that come to different conclusions. \n\n\n\n**Robin Hanson:** I’d be most willing to engage those. I think a lot of people are sort of making an inside/outside argument where they’re saying, “Sure, from the outside this doesn’t look good, but here’s how I see it from the inside.” That’s what I’ve heard from a lot of people. \n\n\n\n**Asya Bergal:** Yeah. Honestly my impression is that I think not a lot of people have spent … a lot of people when they give us numbers are like, “this is really a total guess.” So I think a lot of the argument is either from people who have very specific compute-based models for things that are short [timelines], and then there’s also people who I think haven’t spent that much time creating precise models, but sort of have models that are compelling enough. They’re like, “Oh, maybe I should work on this slash the chance of this is scary enough.” I haven’t seen a lot of very concrete models. Partially I think that’s because there’s an opinion in the community that if you have concrete models, especially if they argue for things being very soon, maybe you shouldn’t publish those. \n\n\n\n**Robin Hanson:** Right, but you could still ask the question, “Set aside everything you know except what this looks like from the outside. Looking at that, would you still predict stuff happening soon?” \n\n\n\n**Asya Bergal:** Yeah, I think that’s a good question to ask. We can’t really go back and add that to what we’ve asked people, but yeah. \n\n\n\n**Robin Hanson:** I think more people, even most, would say, “Yeah, from the outside, this doesn’t look so compelling.” That’s my judgement, but again, they might say, “Well, the usual way of looking at it from the outside doesn’t, but then, here’s this other way of looking at it from the outside that other people don’t use.” That would be a compromise sort of view. And again, I guess there’s this larger meta-question really of who should reasonably be moved by these things? That is, if there are people out there who specialize in chemistry or business ethics or something else, and they hear these people in AI risk saying there’s these big issues, you know, can the evidence that’s being offered by these insiders– is it the sort of thing that they think should be compelling to these outsiders? \n\n\n\n**Asya Bergal:** Yeah, I think I have a question about that too. Especially, I think–we’ve been interviewing largely AI safety researchers, but I think the arguments around why they think AI might be soon or far, look much more like economic arguments. They don’t necessarily look like arguments from an inside, very technical perspective on the subject. So it’s very plausible to me that there’s no particular reason to weigh the opinions of people working on this, other than that they’ve thought about it a little bit more than other people have. *[Note: I say ‘soon or far’ here, but I mean to say ‘more or less likely to be harmful’.]* \n\n\n\n**Robin Hanson:** Well, as a professional economist, I would say, if you have good economic arguments, shouldn’t you bring them to the attention of economists and have us critique them? Wouldn’t that be the way this should go? I mean, not all economics arguments should start with economists, but wouldn’t it make sense to have them be part of the critique evaluation cycle? \n\n\n\n**Asya Bergal:** Yeah, I think the real answer is that these all exist vaguely in people’s heads, and they don’t even make claims to having super-articulated and written-down models. \n\n\n\n**Robin Hanson:** Well, even that is an interesting thing if people agree on it. You could say, “You know a lot of people who agree with you that AI risk is big and that we should deal with something soon. Do you know anybody who agrees with you for the same reasons?” \n\n\n\nIt’s interesting, so I did a poll, I’ve done some Twitter polls lately, and I did one on “Why democracy?” And I gave four different reasons why democracy is good. And I noticed that there was very little agreement, that is, relatively equal spread across these four reasons. And so, I mean that’s an interesting fact to know about any claim that many people agree on, whether they agree on it for the same reasons. And it would be interesting if you just asked people, “Whatever your reason is, what percentage of people interested in AI risk agree with your claim about it for the reason that you do?” Or, “Do you think your reason is unusual?” \n\n\n\nBecause if most everybody thinks their reason is unusual, then basically there isn’t something they can all share with the world to convince the world of it. There’s just the shared belief in this conclusion, based on very different reasons. And then it’s more on their authority of who they are and why they as a collective are people who should be listened to or something. \n\n\n\n**Asya Bergal:** Yeah, I agree that that is an interesting question. I don’t know if I have other stuff, Rob, do you? \n\n\n\n**Robert Long:** I don’t think I do at this time. \n\n\n\n**Robin Hanson:** Well I perhaps, compared to other people, am happy to do a second round should you have questions you generate. \n\n\n\n**Asya Bergal:** Yeah, I think it’s very possible, thanks so much. Thanks so much for talking to us in general. \n\n\n\n**Robin Hanson:** You’re welcome. It’s a fun topic, especially talking with reasonable people. \n\n\n\n**Robert Long:** Oh thank you, I’m glad we were reasonable. \n\n\n\n**Asya Bergal:** Yeah, I’m flattered. \n\n\n\n**Robin Hanson:** You might think that’s a low bar, but it’s not. \n\n\n\n**Robert Long:** Great, we’re going to include that in the transcript. Thank you for talking to us. Have a good rest of your afternoon. \n\n\n\n**Robin Hanson:** Take care, nice talking to you.\n\n\n", "url": "https://aiimpacts.org/conversation-with-robin-hanson/", "title": "Conversation with Robin Hanson", "source": "aiimpacts.org", "source_type": "wordpress", "date_published": "2019-11-13T21:40:05+00:00", "paged_url": "https://aiimpacts.org/feed?paged=10", "authors": ["Asya Bergal"], "id": "b4f61c418d8f0cb2266b8f5fe6c260cb", "summary": ["The main theme of this conversation is that AI safety does not look particularly compelling on an outside view. Progress in most areas is relatively incremental and continuous; we should expect the same to be true for AI, suggesting that timelines should be quite long, on the order of centuries. The current AI boom looks similar to previous AI booms, which didn't amount to much in the past.\n\nTimelines could be short if progress in AI were \"lumpy\", as in a FOOM scenario. This could happen if intelligence was one simple thing that just has to be discovered, but Robin expects that intelligence is actually a bunch of not-very-general tools that together let us do many things, and we simply have to find all of these tools, which will presumably not be lumpy. Most of the value from tools comes from more specific, narrow tools, and intelligence should be similar. In addition, the literature on human uniqueness suggests that it wasn't \"raw intelligence\" or small changes to brain architecture that makes humans unique, it's our ability to process culture (communicating via language, learning from others, etc).\n\nIn any case, many researchers are now distancing themselves from the FOOM scenario, and are instead arguing that AI risk occurs due to standard principal-agency problems, in the situation where the agent (AI) is much smarter than the principal (human). Robin thinks that this doesn't agree with the existing literature on principal-agent problems, in which losses from principal-agent problems tend to be bounded, even when the agent is smarter than the principal.\n\nYou might think that since the stakes are so high, it's worth working on it anyway. Robin agrees that it's worth having a few people (say a hundred) pay attention to the problem, but doesn't think it's worth spending a lot of effort on it right now. Effort is much more effective and useful once the problem becomes clear, or once you are working with a concrete design; we have neither of these right now and so we should expect that most effort ends up being ineffective. It would be better if we saved our resources for the future, or if we spent time thinking about other ways that the future could go (as in his book, Age of Em).\n\nIt's especially bad that AI safety has thousands of \"fans\", because this leads to a \"crying wolf\" effect -- even if the researchers have subtle, nuanced beliefs, they cannot control the message that the fans convey, which will not be nuanced and will instead confidently predict doom. Then when doom doesn't happen, people will learn not to believe arguments about AI risk."]}
{"text": "Etzioni 2016 survey\n\nOren Etzioni surveyed 193 AAAI fellows in 2016 and found that 67% of them expected that ‘we will achieve Superintelligence’ someday, but in more than 25 years. \n\n\nDetails\n=======\n\n\nOren Etzioni, CEO of the Allen Institute for AI,[1](https://aiimpacts.org/etzioni-2016-survey/#easy-footnote-bottom-1-2111 \"“Oren Etzioni.” Accessed November 6, 2019. allenai.org/team/orene/.\") reported on a survey in an MIT Tech Review article published on 20 Sep 2016.[2](https://aiimpacts.org/etzioni-2016-survey/#easy-footnote-bottom-2-2111 \"Etzioni, Oren. “Most Experts Say AI Isn’t as Much of a Threat as You Might Think.” MIT Technology Review. Accessed November 6, 2019. https://www.technologyreview.com/s/602410/no-the-experts-dont-think-superintelligent-ai-is-a-threat-to-humanity/.\") The rest of this article summarizes information from that source, except where noted.\n\n\nIn March 2016, on behalf of Etzioni, the American Association for AI (AAAI) sent out an anonymous survey to 193 of their Fellows (“individuals who have made significant, sustained contributions — usually over at least a ten-year period — to the field of artificial intelligence.”[3](https://aiimpacts.org/etzioni-2016-survey/#easy-footnote-bottom-3-2111 \"“Elected AAAI Fellows.” Accessed November 6, 2019. https://www.aaai.org/Awards/fellows-list.php.\")).\n\n\nThe survey contained one question:\n\n\n\n> “In his book, Nick Bostrom has defined Superintelligence as ‘an intellect that is much smarter than the best human brains in practically every field, including scientific creativity, general wisdom and social skills.’ When do you think we will achieve Superintelligence?”\n> \n> \n\n\nIt seems that responses were entered by selecting one of four categories[4](https://aiimpacts.org/etzioni-2016-survey/#easy-footnote-bottom-4-2111 \"“One of us (Russell) responded to Etzioni’s survey with ‘more than 25 years,’…”
Russell, Allan Dafoe and Stuart. “Yes, the Experts Are Worried about the Existential Risk of Artificial Intelligence.” MIT Technology Review. Accessed November 6, 2019. https://www.technologyreview.com/s/602776/yes-we-are-worried-about-the-existential-risk-of-artificial-intelligence/.
\") although it is possible that they were entered as real numbers and then grouped. \n\n\nThere were 80 responses, for a response rate of 41%. They were:\n\n\n* “In the next 10 years”: 0%\n* “In the next 10-25 years”: 7.5%\n* “In more than 25 years”: 67.5%\n* “Never.”: 25%\n\n\n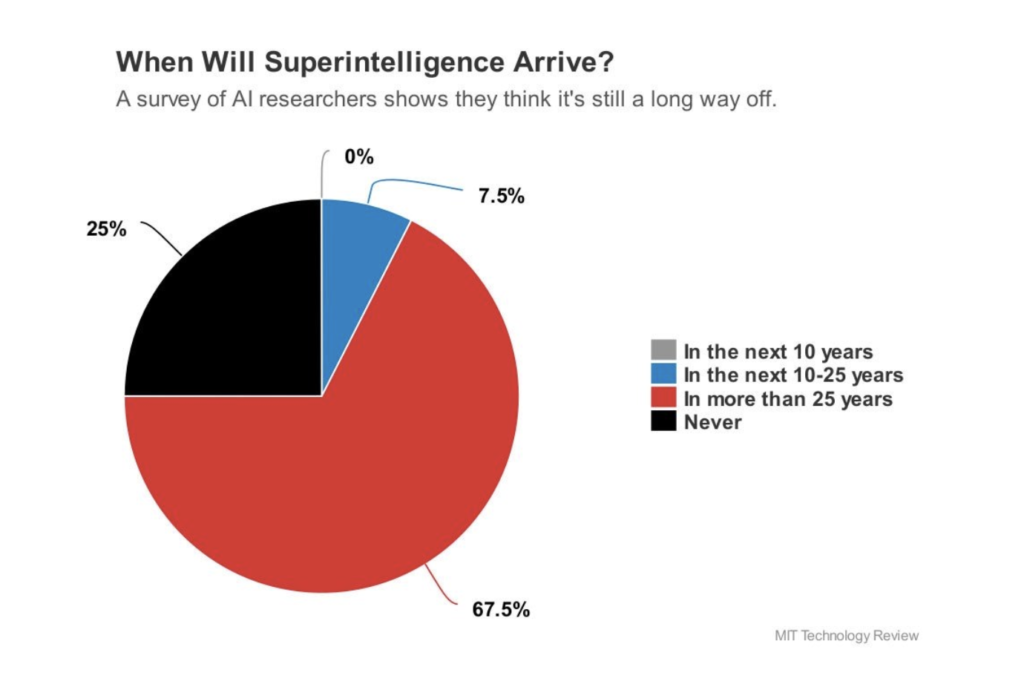Figure 1: graph of responses from Etzioni’s article.\nNotes\n-----\n\n", "url": "https://aiimpacts.org/etzioni-2016-survey/", "title": "Etzioni 2016 survey", "source": "aiimpacts.org", "source_type": "wordpress", "date_published": "2019-11-06T18:41:19+00:00", "paged_url": "https://aiimpacts.org/feed?paged=10", "authors": ["Katja Grace"], "id": "884c1b440387c4832a2d2eb05a44c8e9", "summary": ["Oren Etzioni surveyed 193 AAAI fellows in 2016 and found that 67.5% of them expected that ‘we will achieve Superintelligence’ someday, but in more than 25 years. Only 7.5% thought we would achieve it sooner than that."]}
{"text": "Rohin Shah on reasons for AI optimism\n\n*By Asya Bergal, 31 October 2019*\n\n\n[](http://aiimpacts.org/wp-content/uploads/2019/10/rohin_shah.jpg)Rohin Shah\nI along with several AI Impacts researchers recently talked to Rohin Shah about why he is relatively optimistic about AI systems being developed safely. Rohin Shah is a 5th year PhD student at the [Center for Human-Compatible AI](https://humancompatible.ai/) (CHAI) at Berkeley, and a prominent member of the Effective Altruism community.\n\n\nRohin reported an unusually large (90%) chance that AI systems will be safe without additional intervention. His optimism was largely based on his belief that AI development will be relatively gradual and AI researchers will correct safety issues that come up.\n\n\nHe reported two other beliefs that I found unusual: He thinks that as AI systems get more powerful, they will actually become *more* interpretable because they will use features that humans also tend to use. He also said that intuitions from AI/ML make him skeptical of claims that evolution baked a lot into the human brain, and he thinks there’s a ~50% chance that we will get AGI within two decades via a broad training process that mimics the way human babies learn.\n\n\nA full transcript of our conversation, lightly edited for concision and clarity, can be found [here](https://aiimpacts.org/conversation-with-rohin-shah/).\n\n", "url": "https://aiimpacts.org/rohin-shah-on-reasons-for-ai-optimism/", "title": "Rohin Shah on reasons for AI optimism", "source": "aiimpacts.org", "source_type": "wordpress", "date_published": "2019-10-31T12:02:46+00:00", "paged_url": "https://aiimpacts.org/feed?paged=10", "authors": ["Asya Bergal"], "id": "97b8a3bf001039a614c61d4ef93d2ab9", "summary": []}
{"text": "Conversation with Rohin Shah\n\nAI Impacts talked to AI safety researcher Rohin Shah about his views on AI risk. With his permission, we have transcribed this interview.\n\n\n**Participants**\n----------------\n\n\n* [Rohin Shah](https://rohinshah.com/) — PhD student at the Center for Human-Compatible AI, UC Berkeley\n* Asya Bergal – AI Impacts\n* [Robert Long](http://robertlong.online/) – AI Impacts\n* Sara Haxhia — Independent researcher\n\n\n**Summary**\n-----------\n\n\nWe spoke with Rohin Shah on August 6, 2019. Here is a brief summary of that conversation:\n\n\n* Before taking into account other researchers’ opinions, Shah guesses an extremely rough~90% chance that even without any additional intervention from current longtermists, advanced AI systems will not cause human extinction by adversarially optimizing against humans. He gives the following reasons, ordered by how heavily they weigh in his consideration:\n\t+ Gradual development and take-off of AI systems is likely to allow for correcting the AI system online, and AI researchers will in fact correct safety issues rather than hacking around them and redeploying.\n\t\t- Shah thinks that institutions developing AI are likely to be careful because human extinction would be just as bad for them as for everyone else.\n\t+ As AI systems get more powerful, they will likely become more interpretable and easier to understand because they will use features that humans also tend to use.\n\t+ Many arguments for AI risk go through an intuition that AI systems can be decomposed into an objective function and a world model, and Shah thinks this isn’t likely to be a good way to model future AI systems.\n* Shah believes that conditional on misaligned AI leading to extinction, it almost certainly goes through deception.\n* Shah very uncertainly guesses that there’s a ~50% that we will get AGI within two decades:\n\t+ He gives a ~30% – 40% chance that it will be via essentially current techniques.\n\t+ He gives a ~70% that conditional on the two previous claims, it will be a mesa optimizer.\n\t+ Shah’s model for how we get to AGI soon has the following features:\n\t\t- AI will be trained on a huge variety of tasks, addressing the usual difficulty of generalization in ML systems\n\t\t- AI will learn the same kinds of useful features that humans have learned.\n\t\t- This process of research and training the AI will mimic the ways that evolution produced humans who learn.\n\t\t- Gradient descent is simple and inefficient, so in order to do sophisticated learning, the outer optimization algorithm used in training will have to produce a mesa optimizer.\n* Shah is skeptical of more ‘nativist’ theories where human babies are born with a lot of inductive biases, rather than learning almost everything from their experiences in the world.\n* Shah thinks there are several things that could change his beliefs, including:\n\t+ If he learned that evolution actually baked a lot into humans (‘nativism’), he would lengthen the amount of time he thinks there will be before AGI.\n\t+ Information from historical case studies or analyses of AI researchers could change his mind around how the AI community would by default handle problems that arise.\n\t+ Having a better understanding of the disagreements he has with MIRI:\n\t\t- Shah believes that slow takeoff is much more likely than fast takeoff.\n\t\t- Shah doesn’t believe that any sufficiently powerful AI system will look like an expected utility maximizer.\n\t\t- Shah believes less in crisp formalizations of intelligence than MIRi does.\n\t\t- Shah has more faith in AI researchers fixing problems as they come up.\n\t\t- Shah has less faith than MIRI in our ability to write proofs of the safety of our AI systems.\n\n\nThis transcript has been lightly edited for concision and clarity. \n\n\nTranscript\n----------\n\n\n**Asya Bergal:** We haven’t really planned out how we’re going to talk to people in general, so if any of these questions seem bad or not useful, just give us feedback. I think we’re particularly interested in skepticism arguments, or safe by default style arguments– I wasn’t sure from our conversation whether you partially endorse that, or you just are familiar with the argumentation style and think you could give it well or something like that.\n\n\n**Rohin Shah:** I think I partially endorse it.\n\n\n**Asya Bergal:** Okay, great. If you can, it would be useful if you gave us the short version of your take on the AI risk argument and the place where you feel you and people who are more convinced of things disagree. Does that make sense?\n\n\n**Robert Long:** Just to clarify, maybe for my own… What’s ‘convinced of things’? I’m thinking of the target proposition as something like “it’s extremely high value for people to be doing work that aims to make AGI more safe or beneficial”.\n\n\n**Asya Bergal:** Even that statement seems a little imprecise because I think people have differing opinions about what the high value work is. But that seems like approximately the right proposition.\n\n\n**Rohin Shah:** Okay. So there are some very obvious ones which are not the ones that I endorse, but things like, do you believe in longtermism? Do you buy into the total view of population ethics? And if your answer is no, and you take a more standard version, you’re going to drastically reduce how much you care about AI safety. But let’s see, the ones that I would endorse-\n\n\n**Robert Long:** Maybe we should work on this set of questions. I think this will only come up with people who are into rationalism. I think we’re primarily focused just on empirical sources of disagreement, whereas these would be ethical.\n\n\n**Rohin Shah:** Yup.\n\n\n**Robert Long:** Which again, you’re completely right to mention these things.\n\n\n**Rohin Shah:** So, there’s… okay. The first one I had listed is that continual or gradual or slow takeoff, whatever you want to call it, allows you to correct the AI system online. And also it means that AI systems are likely to fail in not extinction-level ways before they fail in extinction-level ways, and presumably we will learn from that and not just hack around it and fix it and redeploy it. I think I feel fairly confident that there are several people who will disagree with exactly the last thing I said, which is that people won’t just hack around it and deploy it– like fix the surface-level problem and then just redeploy it and hope that everything’s fine.\n\n\nI am not sure what drives the difference between those intuitions. I think they would point to neural architecture search and things like that as examples of, “Let’s just throw compute at the problem and let the compute figure out a bunch of heuristics that seem to work.” And I would point at, “Look, we noticed that… or, someone noticed that AI systems are not particularly fair and now there’s just a ton of research into fairness.”\n\n\nAnd it’s true that we didn’t stop deploying AI systems because of fairness concerns, but I think that is actually just the correct decision from a societal perspective. The benefits from AI systems are in fact– they do in fact outweigh the cons of them not being fair, and so it doesn’t require you to not deploy the AI system while it’s being fixed.\n\n\n**Asya Bergal:** That makes sense. I feel like another common thing, which is not just “hack around and fix it”, is that people think that it will fail in ways that we don’t recognize and then we’ll redeploy some bigger cooler version of it that will be deceptively aligned (or whatever the problem is). How do you feel about arguments of that form: that we just won’t realize all the ways in which the thing is bad?\n\n\n**Rohin Shah:** So I’m thinking: the AI system tries to deceive us, so I guess the argument would be, we don’t realize that the AI system was trying to deceive us and instead we’re like, “Oh, the AI system just failed because it was off distribution or something.”\n\n\nIt seems strange that we wouldn’t see an AI system deliberately hide information from us. And then we look at this and we’re like, “Why the hell didn’t this information come up? This seems like a clear problem.” And then do some sort of investigation into this.\n\n\nI suppose it’s possible we wouldn’t be able to tell it’s intentionally doing this because it thinks it could get better reward by doing so. But that doesn’t… I mean, I don’t have a particular argument why that couldn’t happen but it doesn’t feel like…\n\n\n**Asya Bergal:** Yeah, to be fair I’m not sure that one is what you should expect… that’s just a thing that I commonly hear.\n\n\n**Rohin Shah:** Yes. I also hear that.\n\n\n**Robert Long:** I was surprised at your deception comment… You were talking about, “What about scenarios where nothing seems wrong until you reach a certain level?”\n\n\n**Asya Bergal:** Right. Sorry, that doesn’t have to be deception. I think maybe I mentioned deception because I feel like I often commonly also see it.\n\n\n**Rohin Shah:** I guess if I imagine “How did AI lead to extinction?”, I don’t really imagine a scenario that doesn’t involve deception. And then I claim that conditional on that scenario having happened, I am very surprised by the fact that we did not know this deception in any earlier scenario that didn’t lead to extinction. And I don’t really get people’s intuitions for why that would be the case. I haven’t tried to figure that one out though.\n\n\n**Sara Haxhia:** So do you have no model of how people’s intuitions differ? You can’t see it going wrong aside from if it was deceptively aligned? Why?\n\n\n**Rohin Shah:** Oh, I feel like most people have the intuition that conditional on extinction, it happened by the AI deceiving us. *[Note: In this interview, Rohin was only considering risks arising because of AI systems that try to optimize for goals that are not our own, not other forms of existential risks from AI.]*\n\n\n**Asya Bergal:** I think there’s another class of things which is something not necessarily deceiving us, as in it has a model of our goals and intentionally presents us with deceptive output, and just like… it has some notion of utility function and optimizes for that poorly. It doesn’t necessarily have a model of us, it just optimizes the paperclips or something like that, and we didn’t realize before that it is optimizing. I think when I hear deceptive, I think “it has a model of human behavior that is intentionally trying to do things that subvert our expectations”. And I think there’s also a version where it just has goals unaligned with ours and doesn’t spend any resources in modeling our behavior.\n\n\n**Rohin Shah:** I think in that scenario, usually as an instrumental goal, you need to deceive humans, because if you don’t have a model of human behavior– if you don’t model the fact that humans are going to interfere with your plans– humans just turn you off and nothing, there’s no extinction.\n\n\n**Robert Long:** Because we’d notice. You’re thinking in the non-deception cases, as with the deception cases, in this scenario we’d probably notice.\n\n\n**Sara Haxhia:** That clarifies my question. Great.\n\n\n**Rohin Shah:** As far as I know, this is an accepted thing among people who think about AI x-risk.\n\n\n**Asya Bergal:**The accepted thing is like, “If things go badly, it’s because it’s actually deceiving us on some level”?\n\n\n**Rohin Shah:** Yup. There are some other scenarios which could lead to us not being deceived and bad things still happen. These tend to be things like, we build an economy of AI systems and then slowly humans get pushed out of the economy of AI systems and… \n\n\nThey’re still modeling us. I just can’t really imagine the scenario in which they’re not modeling us. I guess you could imagine one where we slowly cede power to AI systems that are doing things better than we could. And at no point are they actively trying to deceive us, but at some point they’re just like… they’re running the entire economy and we don’t really have much say in it.\n\n\nAnd perhaps this could get to a point where we’re like, “Okay, we have lost control of the future and this is effectively an x-risk, but at no point was there really any deception.”\n\n\n**Asya Bergal:** Right. I’m happy to move on to other stuff.\n\n\n**Rohin Shah:** Cool. Let’s see. What’s the next one I have? All right. This one’s a lot sketchier-\n\n\n**Asya Bergal:** So sorry, what is the thing that we’re listing just so-\n\n\n**Rohin Shah:** Oh, reasons why AI safety will be fine by default.\n\n\n**Asya Bergal:** Right. Gotcha, great.\n\n\n**Rohin Shah:** Okay. These two points were both really one point. So then the next one was… I claimed that as AI systems get more powerful, they will become more interpretable and easier to understand, just because they’re using– they will probably be able to get and learn features that humans also tend to use.\n\n\nI don’t think this has really been debated in the community very much and– sorry, I don’t mean that there’s agreement on it. I think it is just not a hypothesis that has been promoted to attention in the community. And it’s not totally clear what the safety implications are. It suggests that we could understand AI systems more easily and sort of in combination with the previous point it says, “Oh, we’ll notice things– we’ll be more able to notice things than today where we’re like, ‘Here’s this image classifier. Does it do good things? Who the hell knows? We tried it on a bunch of inputs and it seemed like it was doing the right stuff, but who knows what it’s doing inside.'”\n\n\n**Asya Bergal:** I’m curious why you think it’s likely to use features that humans tend to use. It’s possible the answer is some intuition that’s hard to describe.\n\n\n**Rohin Shah:** Intuition that I hope to describe in a year. Partly it’s that in the very toy straw model, there are just a bunch of features in the world that an AI system can pay attention to in order to make good predictions. When you limit the AI system to make predictions on a very small narrow distribution, which is like all AI systems today, there are lots of features that the AI system can use for that task that we humans don’t use because they’re just not very good for the rest of the distribution.\n\n\n**Asya Bergal:** I see. It seems like implicitly in this argument is that when humans are running their own classifiers, they have some like natural optimal set of features that they use for that distribution?\n\n\n**Rohin Shah:** I don’t know if I’d say optimal, but yeah. Better than the features that the AI system is using.\n\n\n**Robert Long:** In the space of better features, why aren’t they going past us or into some other optimal space of feature world?\n\n\n**Rohin Shah:** I think they would eventually.\n\n\n**Robert Long:** I see, but they might have to go through ours first?\n\n\n**Rohin Shah:** So A) I think they would go through ours, B) I think my intuition is something like the features– and this one seems like more just raw intuition and I don’t really have an argument for it– but the features… things like agency, optimization, want, deception, manipulation seem like things that are useful for modeling the world.\n\n\nI would be surprised if an AI system went so far beyond that those features didn’t even enter into its calculations. Or, I’d be surprised if that happened very quickly, maybe. I don’t want to make claims about how far past those AI systems could go, but I do think that… I guess I’m also saying that we should be aiming for AI systems that are like… This is a terrible way to operationalize it, but AI systems that are 10X as intelligent as humans, what do we have to do for them? And then once we’ve got AI systems that are 10 x smarter than us, then we’re like, “All right, what more problems could arise in the future?” And ask the AI systems to help us with that as well.\n\n\n**Asya Bergal:** To clarify, the thing you’re saying is… By the time AI systems are good and more powerful, they will have some conception of the kind of features that humans use, and be able to describe their decisions in terms of those features? Or do you think inherently, there’ll be a point where AI systems use the exact same features that humans use?\n\n\n**Rohin Shah:** Not the exact same features, but broadly similar features to the ones that humans use.\n\n\n**Robert Long:** Where examples of those features would be like objects, cause, agent, the things that we want interpreted in deep nets but usually can’t.\n\n\n**Rohin Shah:** Yes, exactly.\n\n\n**Asya Bergal:** Again, so you think in some sense that that’s a natural way to describe things? Or there’s only one path through getting better at describing things, and that has to go through the way that humans describe things? Does that sound right?\n\n\n**Rohin Shah:** Yes.\n\n\n**Asya Bergal:** Okay. Does that also feel like an intuition?\n\n\n**Rohin Shah:** Yes.\n\n\n**Robert Long:** Sorry, I think I did a bad interviewer thing where I started listing things, I should have just asked you to list some of the features which I think-\n\n\n**Rohin Shah:** Well I listed them, like, optimization, want, motivation before, but I agree causality would be another one. But yeah, I was thinking more the things that safety researchers often talk about. I don’t know, what other features do we tend to use a lot? Object’s a good one… the conception of 3D space is one that I don’t think these classifiers have and that we definitely have.\n\n\nAnd the concept of 3D space seems like it’s probably going to be useful for an AI system no matter how smart it gets. Currently, they might have a concept of 3D space, but it’s not obvious that they do. And I wouldn’t be surprised if they don’t.\n\n\nAt some point, I want to take this intuition and run with it and see where it goes. And try to argue for it more.\n\n\n**Robert Long:** But I think for the purposes of this interview, I think we do understand how this is something that would make things safe by default. At least, in as much as interpretability conduces to safety. Because we could be able to interpret them in and still fuck shit up.\n\n\n**Rohin Shah:** Yep. Agreed. Cool.\n\n\n**Sara Haxhia:** I guess I’m a little bit confused about how it makes the code more interpretable. I can see how if it uses human brains, we can model it better because we can just say, “These are human things and this means we can make predictions better.” But if you’re looking at a neural net or something, it doesn’t make it more interpretable.\n\n\n**Rohin Shah:** If you mean the code, I agree with that.\n\n\n**Sara Haxhia:** Okay. So, is this kind of like external, like you being able to model that thing?\n\n\n**Rohin Shah:** I think you could look at the… you take a particular input to neural net, you pass it through layers, you see what the activations are. I don’t think if you just look directly at the activations, you’re going to get anything sensible, in the same way that if you look at electrical signals in my brain you’re not going to be able to understand them.\n\n\n**Sara Haxhia:** So, is your point that the reason it becomes more interpretable is something more like, you understand its motivations?\n\n\n**Rohin Shah:** What I mean is… Are you familiar with Chris Olah’s work?\n\n\n**Sara Haxhia:** I’m not.\n\n\n**Rohin Shah:** Okay. So Chris Olah does interpretability work with image classifiers. One technique that he uses is: Take a particular neuron in the neural net, say, “I want to maximize the activation of this neuron,” and then do gradient descent on your input image to see what image maximally activates that neuron. And this gives you some insight into what that neuron is detecting. I think things like that will be easier as time goes on.\n\n\n**Robert Long:** Even if it’s not just that particular technique, right? Just the general task?\n\n\n**Rohin Shah:** Yes.\n\n\n**Sara Haxhia:** How does that relate to the human values thing? It felt like you were saying something like it’s going to model the world in a similar way to the way we do, and that’s going to make it more interpretable. And I just don’t really see the link.\n\n\n**Rohin Shah:** A straw version of this, which isn’t exactly what I mean but sort of is the right intuition, would be like maybe if you run the same… What’s the input that maximizes the output of this neuron? You’ll see that this particular neuron is a deception classifier. It looks at the input and then based on something, does some computation with the input, maybe the input’s like a dialogue between two people and then this neuron is telling you, “Hey, is person A trying to deceive person B right now?” That’s an example of the sort of thing I am imagining.\n\n\n**Asya Bergal:** I’m going to do the bad interviewer thing where I put words in your mouth. I think one problem right now is you can go a few layers into a neural network and the first few layers correspond to things you can easily tell… Like, the first layer is clearly looking at all the different pixel values, and maybe the second layer is finding lines or something like that. But then there’s this worry that later on, the neurons will correspond to concepts that we have no human interpretation for, so it won’t even make sense to interpret them. Whereas Rohin is saying, “No, actually the neurons will correspond to, or the architecture will correspond to some human understandable concept that it makes sense to interpret.” Does that seem right?\n\n\n**Rohin Shah:** Yeah, that seems right. I am maybe not sure that I tie it necessarily to the architecture, but actually probably I’d have to one day.\n\n\n**Asya Bergal:** Definitely, you don’t need to. Yeah. \n\n\n\n**Rohin Shah:** Anyway, I haven’t thought about that enough, but that’s basically that. If you look at current late layers in image classifiers they are often like, “Oh look, this is a detector for lemon tennis balls,” and you’re just like, “That’s a strange concept you’ve got there, neural net, but sure.” \n\n\n\n**Robert Long:** Alright, cool. Next way of being safe? \n\n\n\n**Rohin Shah:** They’re getting more and more sketchy. I have an intuition that… I should rephrase this. I have an intuition that AI systems are not well-modeled as, “Here’s the objective function and here is the world model.” Most of the classic arguments are: Suppose you’ve got an incorrect objective function, and you’ve got this AI system with this really, really good intelligence, which maybe we’ll call it a world model or just general intelligence. And this intelligence can take in any utility function, and optimize it, and you plug in the incorrect utility function, and catastrophe happens. \n\n\n\nThis does not seem to be the way that current AI systems work. It is the case that you have a reward function, and then you sort of train a policy that optimizes that reward function, but… I explained this the wrong way around. But the policy that’s learned isn’t really… It’s not really performing an optimization that says, “What is going to get me the most reward? Let me do that thing.” \n\n\n\nIt has been given a bunch of heuristics by gradient descent that tend to correlate well with getting high reward and then it just executes those heuristics. It’s kind of similar to… If any of you are fans of the sequences… Eliezer wrote a sequence on evolution and said… What was it? Humans are not fitness maximizers, they are adaptation executors, something like this. And that is how I view neural nets today that are trained by RL. They don’t really seem like expected utility maximizers the way that it’s usually talked about by MIRI or on LessWrong. \n\n\n\nI mostly expect this to continue, I think conditional on AGI being developed soon-ish, like in the next decade or two, with something kind of like current techniques. I think it would be… AGI would be a mesa optimizer or inner optimizer, whichever term you prefer. And that that inner optimizer will just sort of have a mishmash of all of these heuristics that point in a particular direction but can’t really be decomposed into ‘here are the objectives, and here is the intelligence’, in the same way that you can’t really decompose humans very well into ‘here are the objectives and here is the intelligence’. \n\n\n\n**Robert Long:** And why does that lead to better safety? \n\n\n\n**Rohin Shah:** I don’t know that it does, but it leads to not being as confident in the original arguments. It feels like this should be pushing in the direction of ‘it will be easier to correct or modify or change the AI system’. Many of the arguments for risk are ‘if you have a utility maximizer, it has all of these convergent instrumental sub-goals’ and, I don’t know, if I look at humans they kind of sort of pursued convergent instrumental sub-goals, but not really. \n\n\n\nYou can definitely convince them that they should have different goals. They change the thing they are pursuing reasonably often. Mostly this just reduces my confidence in existing arguments rather than gives me an argument for safety. \n\n\n\n**Robert Long:** It’s like a defeater for AI safety arguments that rely on a clean separation between utility… \n\n\n\n**Rohin Shah:** Yeah, which seems like all of them. All of the most crisp ones. Not all of them. I keep forgetting about the… I keep not taking into account the one where your god-like AI slowly replace humans and humans lose control of the future. That one still seems totally possible in this world. \n\n\n\n**Robert Long:** If AGI is through current techniques, it’s likely to have systems that don’t have this clean separation. \n\n\n\n**Rohin Shah:** Yep. A separate claim that I would argue for separately– I don’t think they interact very much– is that I would also claim that we will get AGI via essentially current techniques. I don’t know if I should put a timeline on it, but two decades seems plausible. Not saying it’s likely, maybe 50% or something. And that the resulting AGI will look like mesa optimizer. \n\n\n\n**Asya Bergal:** Yeah. I’d be very curious to delve into why you think that. \n\n\n\n**Robert Long:** Yeah, me too. Let’s just do that because that’s fast. Also your… What do you mean by current techniques, and what’s your credence in that being what happens? \n\n\n\n**Sara Haxhia:** And like what’s your model for how… where is this coming from? \n\n\n\n**Rohin Shah:** So on the meta questions, first, the current techniques would be like deep learning, gradient descent broadly, maybe RL, maybe meta-learning, maybe things sort of like it, but back propagation or something like that is still involved. \n\n\n\nI don’t think there’s a clean line here. Something like, we don’t look back and say: That. That was where the ML field just totally did a U-turn and did something else entirely. \n\n\n\n**Robert Long:** Right. Everything that’s involved in the building of the AGI is something you can roughly find in current textbooks or like conference proceedings or something. Maybe combined in new cool ways. \n\n\n\n**Rohin Shah:** Yeah. Maybe, yeah. Yup. And also you throw a bunch of compute at it. That is part of my model. So that was the first one. What is current techniques? Then you asked credence. \n\n\n\nCredence in AGI developed in two decades by current-ish techniques… Depends on the definition of current-ish techniques, but something like 30, 40%. Credence that it will be a mesa optimizer, maybe conditional on this being… The previous thing being true, the credence on it being a mesa optimizer, 60, 70%. Yeah, maybe 70%. \n\n\n\nAnd then the actual model for why this is… it’s sort of related to the previous points about features wherein there are lots and lots of features and humans have settled on the ones that are broadly useful across a wide variety of contexts. I think that in that world, what you want to do to get AGI is train an AI system on a very broad… train an AI system maybe by RL or something else, I don’t know. Probably RL. \n\n\n\nOn a very large distribution of tasks or a large distribution of something, maybe they’re tasks, maybe they’re not like, I don’t know… Human babies aren’t really training on some particular task. Maybe it’s just a bunch of unsupervised learning. And in doing so over a lot of time and a lot of compute, it will converge on the same sorts of features that humans use. \n\n\n\nI think the nice part of this story is that it doesn’t require that you explain how the AI system generalizes– generalization in general is just a very difficult property to get out of ML systems if you want to generalize outside of the training distribution. You mostly don’t require that here because, A) it’s being trained on a very wide variety of tasks and B) it’s sort of mimicking the same sort of procedure that was used to create humans. Where, with humans you’ve also got the sort of… evolution did a lot of optimization in order to create creatures that were able to work effectively in the environment, the environment’s super complicated, especially because there are other creatures that are trying to use the same resources. \n\n\n\nAnd so that’s where you get the wide variety or, the very like broad distribution of things. Okay. What have I not said yet? \n\n\n\n**Robert Long:**That was your model. Are you done with the model of how that sort of thing happens or- \n\n\n\n**Rohin Shah:** I feel like I’ve forgotten aspects, forgotten to say aspects of the model, but maybe I did say all of it. \n\n\n\n**Robert Long:** Well, just to recap: One thing you really want is a generalization, but this is in some sense taken care of because you’re just training on a huge bunch of tasks. Secondly, you’re likely to get them learning useful features. And one- \n\n\n\n**Rohin Shah:** And thirdly, it’s mimicking what evolution did, which is the one example we have of a process that created general intelligence. \n\n\n\n**Asya Bergal:** It feels like implicit in this sort of claim for why it’s soon is that compute will grow sufficiently to accommodate this process, which is similar to evolution. It feels like there’s implicit there, a claim that compute will grow and a claim that however compute will grow, that’s going to be enough to do this thing. \n\n\n\n**Rohin Shah:** Yeah, that’s fair. I think actually I don’t have good reasons for believing that, maybe I should reduce my credences on these a bit, but… That’s basically right. So, it feels like for the first time I’m like, “Wow, I can actually use estimates of human brain computation and it actually makes sense with my model.” \n\n\n\nI’m like, “Yeah, existing AI systems seem more expensive to run than the human brain… Sorry, if you compare dollars per hour of human brain equivalent. Hiring a human is what? Maybe we call it $20 an hour or something if we’re talking about relatively simple tasks. And then, I don’t think you could get an equivalent amount of compute for $20 for a while, but maybe I forget what number it came out to, I got to recently. Yeah, actually the compute question feels like a thing I don’t actually know the answer to. \n\n\n\n**Asya Bergal:** A related question– this is just to clarify for me– it feels like maybe the relevant thing to compare to is not the amount of compute it takes to run a human brain, but like- \n\n\n\n**Rohin Shah:** Evolution also matters. \n\n\n\n**Asya Bergal:** Yeah, the amount of compute to get to the human brain or something like that. \n\n\n\n**Rohin Shah:** Yes, I agree with that, that that is a relevant thing. I do think we can be way more efficient than evolution. \n\n\n\n**Asya Bergal:** That sounds right. But it does feel like that’s… that does seem like that’s the right sort of quantity to be looking at? Or does it feel like- \n\n\n\n**Rohin Shah:** For training, yes. \n\n\n\n**Asya Bergal:** I’m curious if it feels like the training is going to be more expensive than the running in your model. \n\n\n\n**Rohin Shah:** I think the… It’s a good question. It feels like we will need a bunch of experimentation, figuring out how to build essentially the equivalent of the human brain. And I don’t know how expensive that process will be, but I don’t think it has to be a single program that you run. I think it can be like… The research process itself is part of that. \n\n\n\nAt some point I think we build a system that is initially trained by gradient descent, and then the training by gradient descent is comparable to humans going out in the world and acting and learning based on that. A pretty big uncertainty here is: How much has evolution put in a bunch of important priors into human brains? Versus how much are human brains actually just learning most things from scratch? Well, scratch or learning from their parents. \n\n\n\nPeople would claim that babies have lots of inductive biases, I don’t know that I buy it. It seems like you can learn a lot with a month of just looking at the world and exploring it, especially when you get way more data than current AI systems get. For one thing, you can just move around in the world and notice that it’s three dimensional. \n\n\n\nAnother thing is you can actually interact with stuff and see what the response is. So you can get causal intervention data, and that’s probably where causality becomes such an ingrained part of us. So I could imagine that these things that we see as core to human reasoning, things like having a notion of causality or having a notion, I think apparently we’re also supposed to have as babies an intuition about statistics and like counterfactuals and pragmatics. \n\n\n\nBut all of these are done with brains that have been in the world for a long time, relatively speaking, relative to AI systems. I’m not actually sure if I buy that this is because we have really good priors. \n\n\n\n**Asya Bergal:** I recently heard… Someone was talking to me about an argument that went like: Humans, in addition to having priors, built-ins from evolution and learning things in the same way that neural nets do, learn things through… you go to school and you’re taught certain concepts and algorithms and stuff like that. And that seems distinct from learning things in a gradient descenty way. Does that seem right? \n\n\n\n**Rohin Shah:** I definitely agree with that. \n\n\n\n**Asya Bergal:** I see. And does that seem like a plausible thing that might not be encompassed by some gradient descenty thing? \n\n\n\n**Rohin Shah:** I think the idea there would be, you do the gradient descenty thing for some time. That gets you in the AI system that now has inside of it a way to learn. That’s sort of what it means to be a mesa optimizer. And then that mesa optimizer can go and do its own thing to do better learning. And maybe at some point you just say, “To hell with this gradient descent, I’ll turn it off.” Probably humans don’t do that. Maybe humans do that, I don’t know. \n\n\n\n**Asya Bergal:** Right. So you do gradient descent to get to some place. And then from there you can learn in the same way– where you just read articles on the internet or something? \n\n\n\n**Rohin Shah:** Yeah. Oh, another reason that I think this… Another part of my model for why this is more likely– I knew there was more– is that, exactly that point, which is that learning probably requires some more deliberate active process than gradient descent. Gradient design feels really relatively dumb, not as dumb as evolution, but close. And the only plausible way I’ve seen so far for how that could happen is by mesa optimization. And it also seems to be how it happened with humans. I guess you could imagine the meta-learning system that’s explicitly trying to develop this learning algorithm. \n\n\n\nAnd then… okay, by the definition of mesa optimizers, that would not be a mesa optimizer, it would be an inner optimizer. So maybe it’s an inner optimizer instead if we use- \n\n\n\n**Asya Bergal:** I think I don’t quite understand what it means that learning requires, or that the only way to do learning is through mesa optimization \n\n\n\n**Rohin Shah:** I can give you a brief explanation of what it means to me in a minute or two. I’m going to go and open my summary because that says it better than I can. \n\n\n\nLearned optimization, that’s what it was called. All right. Suppose you’re searching over a space of programs to find one that plays tic-tac-toe well. And initially you find a program that says, “If the board is empty, put something in the center square,” or rather, “If the center square is empty, put something there. If there’s two in a row somewhere of yours, put something to complete it. If your opponent has two in a row somewhere, make sure to block it,” and you learn a bunch of these heuristics. Those are some nice, interpretable heuristics but maybe you’ve got some uninterpretable ones too. \n\n\n\nBut as you search more and more, eventually someday you stumble upon the minimax algorithm, which just says, “Play out the game all the way until the end. See whether in all possible moves that you could make, and all possible moves your opponent could make, and search for the path where you are guaranteed to win.” \n\n\n\nAnd then you’re like, “Wow, this algorithm, it just always wins. No one can ever beat it. It’s amazing.” And so basically you have this outer optimization loop that was searching over a space of programs, and then it found a program, so one element of the space, that was itself performing optimization, because it was searching through possible moves or possible paths in the game tree to find the actual policy it should play. \n\n\n\nAnd so your outer optimization algorithm found an inner optimization algorithm that is good, or it solves the task well. And the main claim I will make, and I’m not sure if… I don’t think the paper makes it, but the claim I will make is that for many tasks if you’re using gradient descent as your optimizer, because gradient descent is so annoyingly slow and simple and inefficient, the best way to actually achieve the task will be to find a mesa optimizer. So gradient descent finds parameters that themselves take an input, do some sort of optimization, and then figure out an output. \n\n\n\n**Asya Bergal:** Got you. So I guess part of it is dividing into sub-problems that need to be optimized and then running… Does that seem right? \n\n\n\n**Rohin Shah:** I don’t know that there’s necessarily a division into sub problems, but it’s a specific kind of optimization that’s tailored for the task at hand. Maybe another example would be… I don’t know, that’s a bad example. I think the analogy to humans is one I lean on a lot, where evolution is the outer optimizer and it needs to build things that replicate a bunch. \n\n\n\nIt turns out having things replicate a bunch is not something you can really get by heuristics. What you need to do is to create humans who can themselves optimize and figure out how to… Well, not replicate a bunch, but do things that are very correlated with replicating a bunch. And that’s how you get very good replicators. \n\n\n\n**Asya Bergal:** So I guess you’re saying… often the gradient descent process will– it turns out that having an optimizer as part of the process is often a good thing. Yeah, that makes sense. I remember them in the mesa optimization stuff. \n\n\n\n**Rohin Shah:** Yeah. So that intuition is one of the reasons I think that… It’s part of my model for why AGI will be a mesa optimizer. Though I do– in the world where we’re not using current ML techniques I’m like, “Oh, anything can happen.” \n\n\n\n**Asya Bergal:** That makes sense. Yeah, I was going to ask about that. Okay. So conditioned on current ML techniques leading to it, it’ll probably go through mesa optimizers? \n\n\n\n**Rohin Shah:** Yeah. I might endorse the claim with much weaker confidence even without current ML techniques, but I’d have to think a lot more about that. There are arguments for why mesa optimization is the thing you want– is the thing that happens– that are separate from deep learning. In fact, the whole paper doesn’t really talk about deep learning very much. \n\n\n\n**Robert Long:** Cool. So that was digging into the model of why and how confident we should be on current technique AGI, prosaic AI I guess people call it? And seems like the major sources of uncertainty there are: does compute actually go up, considerations about evolution and its relation to human intelligence and learning and stuff? \n\n\n\n**Rohin Shah:** Yup. So the Median Group, for example, will agree with most of this analysis… Actually no. The Median Group will agree with some of this analysis but then say, and therefore, AGI is extremely far away, because evolution threw in some horrifying amount of computation and there’s no way we can ever match that. \n\n\n\n**Asya Bergal:** I’m curious if you still have things on your list of like safety by default arguments, I’m curious to go back to that. Maybe you covered them. \n\n\n\n**Rohin Shah:** I think I have covered them. The way I’ve listed this last one is ‘AI systems will be optimizers in the same way that humans are optimizers, not like Eliezer-style EU maximizers’… which is basically what I’ve just been saying. \n\n\n\n**Sara Haxhia:** But it seems like it still feels dangerous.. if a human had loads of power, it could do things that… even if they aren’t maximizing some utility. \n\n\n\n**Rohin Shah:** Yeah, I agree, this is not an argument for complete safety. I forget where I was initially going with this point. I think my main point here is that mesa optimizers don’t nice… Oh, right, they don’t nicely factor into utility function and intelligence. And that reduces my credence in existing arguments, and there are still issues which are like, with a mesa optimizer, your capabilities generalize with distributional shift, but your objective doesn’t. \n\n\n\nHumans are not really optimizing for reproductive success. And arguably, if someone had wanted to create things that were really good at reproducing, they might have used evolution as a way to do it. And then humans showed up and were like, “Oh, whoops, I guess we’re not doing that anymore.” \n\n\n\nI mean, the mesa optimizers paper is a very pessimistic paper. In their view, mesa optimization is a bad thing that leads to danger and that’s… I agree that all of the reasons they point out for mesa optimization being dangerous are in fact reasons that we should be worried about mesa optimization. \n\n\n\nI think mostly I see this as… convergent instrumental sub-goals are less likely to be obviously a thing that this pursues. And that just feels more important to me. I don’t really have a strong argument for why that consideration dominates- \n\n\n\n**Robert Long:** The convergent instrumental sub-goals consideration? \n\n\n\n**Rohin Shah:** Yeah. \n\n\n\n**Asya Bergal:** I have a meta credence question, maybe two layers of them. The first being, do you consider yourself optimistic about AI for some random qualitative definition of optimistic? And the follow-up is, what do you think is the credence that by default things go well, without additional intervention by us doing safety research or something like that? \n\n\n\n**Rohin Shah:** I would say relative to AI alignment researchers, I’m optimistic. Relative to the general public or something like that, I might be pessimistic. It’s hard to tell. I don’t know, credence that things go well? That’s a hard one. Intuitively, it feels like 80 to 90%, 90%, maybe. 90 feels like I’m being way too confident and like, “What? You only assign 10%, even though you have literally no… you can’t predict the future and no one can predict the future, why are you trying to do it?” It still does feel more like 90%. \n\n\n\n**Asya Bergal:** I think that’s fine. I guess the follow-up is sort of like, between the sort of things that you gave, which were like: Slow takeoff allows for correcting things, things that are more powerful will be more interpretable, and I think the third one being, AI systems not actually being… I’m curious how much do you feel like your actual belief in this leans on these arguments? Does that make sense? \n\n\n\n**Rohin Shah:** Yeah. I think the slow takeoff one is the biggest one. If I believe that at some point we would build an AI system that within the span of a week was just way smarter than any human, and before that the most powerful AI system was below human level, I’m just like, “Shit, we’re doomed.” \n\n\n\n**Robert Long:** Because there it doesn’t matter if it goes through interpretable features particularly. \n\n\n\n**Rohin Shah:** There I’m like, “Okay, once we get to something that’s super intelligent, it feels like the human ant analogy is basically right.” And unless we… Maybe we could still be fine because people thought about it and put in… Maybe I’m still like, “Oh, AI researchers would have been able to predict that this would’ve happened and so were careful.” \n\n\n\nI don’t know, in a world where fast takeoff is true, lots of things are weird about the world, and I don’t really understand the world. So I’m like, “Shit, it’s quite likely something goes wrong.” I think the slow takeoff is definitely a crux. Also, we keep calling it slow takeoff and I want to emphasize that it’s not necessarily slow in calendar time. It’s more like gradual. \n\n\n\n**Asya Bergal:** Right, like ‘enough time for us to correct things’ takeoff. \n\n\n\n**Rohin Shah:** Yeah. And there’s no discontinuity between… you’re not like, “Here’s a 2X human AI,” and a couple of seconds later it’s now… Not a couple of seconds later, but like, “Yeah, we’ve got 2X AI,” for a few months and then suddenly someone deploys a 10,000X human AI. If that happened, I would also be pretty worried. \n\n\n\nIt’s more like there’s a 2X human AI, then there’s like a 3X human AI and then a 4X human AI. Maybe this happens from the same AI getting better and learning more over time. Maybe it happens from it designing a new AI system that learns faster, but starts out lower and so then overtakes it sort of continuously, stuff like that. \n\n\n\nSo that I think, yeah, without… I don’t really know what the alternative to it is, but in the one where it’s not human level, and then 10,000X human in a week and it just sort of happened, that I’m like, I don’t know, 70% of doom or something, maybe more. That feels like I’m… I endorse that credence even less than most just because I feel like I don’t know what that world looks like. Whereas on the other ones I at least have a plausible world in my head. \n\n\n\n**Asya Bergal:** Yeah, that makes sense. I think you’ve mentioned, in a slow takeoff scenario that… Some people would disagree that in a world where you notice something was wrong, you wouldn’t just hack around it, and keep going. \n\n\n\n**Asya Bergal:** I have a suggestion which it feels like maybe is a difference and I’m very curious for your take on whether that seems right or seems wrong. It seems like people believe there’s going to be some kind of pressure for performance or competitiveness that pushes people to try to make more powerful AI in spite of safety failures. Does that seem untrue to you or like you’re unsure about it? \n\n\n\n**Rohin Shah:** It seems somewhat untrue to me. I recently made a comment about this on the Alignment Forum. People make this analogy between AI x-risk and risk of nuclear war, on mutually assured destruction. That particular analogy seems off to me because with nuclear war, you need the threat of being able to hurt the other side whereas with AI x-risk, if the destruction happens, that affects you too. So there’s no mutually assured destruction type dynamic. \n\n\n\nYou could imagine a situation where for some reason the US and China are like, “Whoever gets to AGI first just wins the universe.” And I think in that scenario maybe I’m a bit worried, but even then, it seems like extinction is just worse, and as a result, you get significantly less risky behavior? But I don’t think you get to the point where people are just literally racing ahead with no thought to safety for the sake of winning. \n\n\n\nI also don’t think that you would… I don’t think that differences in who gets to AGI first are going to lead to you win the universe or not. I think it leads to pretty continuous changes in power balance between the two. \n\n\n\nI also don’t think there’s a discrete point at which you can say, “I’ve won the race.” I think it’s just like capabilities keep improving and you can have more capabilities than the other guy, but at no point can you say, “Now I have won the race.” I suppose if you could get a decisive strategic advantage, then you could do it. And that has nothing to do with what your AI capability… If you’ve got a decisive strategic advantage that could happen. \n\n\n\nI would be surprised if the first human-level AI allowed you to get anything close to a decisive strategic advantage. Maybe when you’re at 1000X human level AI, perhaps. Maybe not a thousand. I don’t know. Given slow takeoff, I’d be surprised if you could knowably be like, “Oh yes, if I develop this piece of technology faster than my opponent, I will get a decisive strategic advantage.” \n\n\n\n**Asya Bergal:** That makes sense. We discussed a lot of cruxes you have. Do you feel like there’s evidence that you already have pre-computed that you think could move you in one direction or another on this? Obviously, if you’ve got evidence that X was true, that would move you, but are there concrete things where you’re like, “I’m interested to see how this will turn out, and that will affect my views on the thing?” \n\n\n\n**Rohin Shah:** So I think I mentioned the… On the question of timelines, they are like the… How much did evolution actually bake in to humans? It seems like a question that could put… I don’t know if it could be answered, but maybe you could answer that one. That would affect it… I lean on the side of not really, but it’s possible that the answer is yes, actually quite a lot. If that was true, I just lengthen my timelines basically. \n\n\n\n**Sara Haxhia:** Can you also explain how this would change your behavior with respect to what research you’re doing, or would it not change that at all? \n\n\n\n**Rohin Shah:** That’s a good question. I think I would have to think about that one for longer than two minutes. \n\n\n\nAs background on that, a lot of my current research is more trying to get AI researchers to be thinking about what happens when you deploy, when you have AI systems working with humans, as opposed to solving alignment. Mostly because I for a while couldn’t see research that felt useful to me for solving alignment. I think I’m now seeing more things that I can do that seem more relevant and I will probably switch to doing them possibly after graduating because thesis, and needing to graduate, and stuff like that. \n\n\n\n**Rohin Shah:** Yes, but you were asking evidence that would change my mind- \n\n\n\n**Asya Bergal:** I think it’s also reasonable to be not sure exactly about concrete things. I don’t have a good answer to this question off the top of my head. \n\n\n\n**Rohin Shah:** It’s worth at least thinking about for a couple of minutes. I think I could imagine getting more information from either historical case studies of how people have dealt with new technologies, or analyses of how AI researchers currently think about things or deal with stuff, could change my mind about whether I think the AI community would by default handle problems that arise, which feels like an important crux between me and others. \n\n\n\nI think currently my sense is if the like… You asked me this, I never answered it. If the AI safety field just sort of vanished, but the work we’ve done so far remained and conscientious AI researchers remained, or people who are already AI researchers and already doing this sort of stuff without being influenced by EA or rationality, then I think we’re still fine because people will notice failures and correct them. \n\n\n\nI did answer that question. I said something like 90%. This was a scenario I was saying 90% for. And yeah, that one feels like a thing that I could get evidence on that would change my mind. \n\n\n\nI can’t really imagine what would cause me to believe that AI systems will actually do a treacherous turn without ever trying to deceive us before that. But there might be something there. I don’t really know what evidence would move me, any sort of plausible evidence I could see that would move me in that direction. \n\n\n\nSlow takeoff versus fast takeoff…. I feel like MIRI still apparently believes in fast takeoff. I don’t have a clear picture of these reasons, I expect those reasons would move me towards fast takeoff. \n\n\n\nOh, on the expected utility max or the… my perception of MIRI, or of Eliezer and also maybe MIRI, is that they have this position that any AI system, any sufficiently powerful AI system, will look to us like an expected utility maximizer, therefore convergent instrumental sub-goals and so on. I don’t buy this. I wrote a [post](https://www.alignmentforum.org/s/4dHMdK5TLN6xcqtyc/p/NxF5G6CJiof6cemTw) explaining why I don’t buy this. \n\n\n\nYeah, there’s a lot of just like.. MIRI could say their reasons for believing things and that would probably cause me to update. Actually, I have enough disagreements with MIRI that they may not update me, but it could in theory update me. \n\n\n\n**Asya Bergal:** Yeah, that’s right. What are some disagreements you have with MIRI? \n\n\n\n**Rohin Shah:** Well, the ones I just mentioned. There is this great post from maybe not a year ago, but in 2018, called ‘Realism about Rationality’, which is basically this perspective that there is the one true learning algorithm or the one correct way of doing exploration, or just, there is a platonic ideal of intelligence. We could in principle find it, code it up, and then we would have this extremely good AI algorithm. \n\n\n\nThen there is like, to the extent that this was a disagreement back in 2008, Robin Hanson would have been on the other side saying, “No, intelligence is just like a broad… just like conglomerate of a bunch of different heuristics that are all task specific, and you can’t just take one and apply it on the other space. It is just messy and complicated and doesn’t have a nice crisp formalization.” \n\n\n\nAnd, I fall not exactly on Robin Hanson’s side, but much more on Robin Hanson’s side than the ‘rationality is a real formalizable natural thing in the world’. \n\n\n\n**Sara Haxhia:** Do you have any idea where the cruxes of disagreement are at all? \n\n\n\n**Rohin Shah:** No, that one has proved very difficult to… \n\n\n\n**Robert Long:** I think that’s an AI Impacts project, or like a dissertation or something. I feel like there’s just this general domain specificity debate, how general is rationality debate… \n\n\n\nI think there are these very crucial considerations about the nature of intelligence and how domain specific it is and they were an issue between Robin and Eliezer and no one… It’s hard to know what evidence, what the evidence is in this case. \n\n\n\n**Rohin Shah:** Yeah. But I basically agree with this and that it feels like a very deep disagreement that I have never had any success in coming to a resolution to, and I read arguments by people who believe this and I’m like, “No.” \n\n\n\n**Sara Haxhia:** Have you spoken to people? \n\n\n\n**Rohin Shah:** I have spoken to people at CHAI, I don’t know that they would really be on board this train. Hold on, Daniel probably would be. And that hasn’t helped that much. Yeah. This disagreement feels like one where I would predict that conversations are not going to help very much. \n\n\n\n**Robert Long:** So, the general question here was disagreements with MIRI, and then there’s… And you’ve mentioned fast takeoff and maybe relatedly, the Yudkowsky-Hanson– \n\n\n\n**Rohin Shah:** Realism about Rationality is how I’d phrase it. There’s also the– are AI researchers conscientious? Well, actually I don’t know that they would say they are not conscientious. Maybe they’d say they’re not paying attention or they have motivated reasoning for ignoring the issues… lots of things like that. \n\n\n\n**Robert Long:** And this issue of do advanced intelligences look enough like EU maximizers… \n\n\n\n**Rohin Shah:** Oh, yes. That one too. Yeah, sorry. That’s one of the major ones. Not sure how I forgot that. \n\n\n\n**Robert Long:** I remember it because I’m writing it all down, so… again, you’ve been talking about very complicated things. \n\n\n\n**Rohin Shah:** Yeah. Related to the Realism about Rationality point is the use of formalism and proof. Nor formalism, but proof at least. I don’t know that MIRI actually believes that what we need to do is write a bunch of proofs about our AI system, but it sure sounds like it, and that seems like a too difficult, and basically impossible task to me, if the proofs that we’re trying to write are about alignment or beneficialness or something like that. \n\n\n\nThey also seem to… No, maybe all the other disagreements can be traced back to these disagreements. I’m not sure. \n\n\n", "url": "https://aiimpacts.org/conversation-with-rohin-shah/", "title": "Conversation with Rohin Shah", "source": "aiimpacts.org", "source_type": "wordpress", "date_published": "2019-10-31T12:02:15+00:00", "paged_url": "https://aiimpacts.org/feed?paged=10", "authors": ["Asya Bergal"], "id": "040ee44766105b3f22e6324b13c35d36", "summary": ["The main reason I am optimistic about AI safety is that we will see problems in advance, and we will solve them, because nobody wants to build unaligned AI. A likely crux is that I think that the ML community will actually solve the problems, as opposed to applying a bandaid fix that doesn't scale. I don't know why there are different underlying intuitions here.\n\nIn addition, many of the classic arguments for AI safety involve a system that can be decomposed into an objective function and a world model, which I suspect will not be a good way to model future AI systems. In particular, current systems trained by RL look like a grab bag of heuristics that correlate well with obtaining high reward. I think that as AI systems become more powerful, the heuristics will become more and more general, but they still won't decompose naturally into an objective function, a world model, and search. In addition, we can look at humans as an example: we don't fully pursue convergent instrumental subgoals; for example, humans can be convinced to pursue different goals. This makes me more skeptical of traditional arguments.\n\nI would guess that AI systems will become _more_ interpretable in the future, as they start using the features / concepts / abstractions that humans are using. Eventually, sufficiently intelligent AI systems will probably find even better concepts that are alien to us, but if we only consider AI systems that are (say) 10x more intelligent than us, they will probably still be using human-understandable concepts. This should make alignment and oversight of these systems significantly easier. For significantly stronger systems, we should be delegating the problem to the AI systems that are 10x more intelligent than us. (This is very similar to the picture painted in <@Chris Olah’s views on AGI safety@>, but that had not been published and I was not aware of Chris's views at the time of this conversation.)\n\nI'm also less worried about race dynamics increasing _accident_ risk than the median researcher. The benefit of racing a little bit faster is to have a little bit more power / control over the future, while also increasing the risk of extinction a little bit. This seems like a bad trade from each agent's perspective. (That is, the Nash equilibrium is for all agents to be cautious, because the potential upside of racing is small and the potential downside is large.) I'd be more worried if [AI risk is real AND not everyone agrees AI risk is real when we have powerful AI systems], or if the potential upside was larger (e.g. if racing a little more made it much more likely that you could achieve a decisive strategic advantage).\n\nOverall, it feels like there's around 90% chance that AI would not cause x-risk without additional intervention by longtermists. The biggest disagreement between me and more pessimistic researchers is that I think gradual takeoff is much more likely than discontinuous takeoff (and in fact, the first, third and fourth paragraphs above are quite weak if there's a discontinuous takeoff). If I condition on discontinuous takeoff, then I mostly get very confused about what the world looks like, but I also get a lot more worried about AI risk, especially because the \"AI is to humans as humans are to ants\" analogy starts looking more accurate. In the interview I said 70% chance of doom in this world, but with _way_ more uncertainty than any of the other credences, because I'm really confused about what that world looks like. Two other disagreements, besides the ones above: I don't buy <@Realism about rationality@>, whereas I expect many pessimistic researchers do. I may also be more pessimistic about our ability to write proofs about fuzzy concepts like those that arise in alignment.\n\nOn timelines, I estimated a very rough 50% chance of AGI within 20 years, and 30-40% chance that it would be using \"essentially current techniques\" (which is obnoxiously hard to define). Conditional on both of those, I estimated 70% chance that it would be something like a mesa optimizer; mostly because optimization is a very useful instrumental strategy for solving many tasks, especially because gradient descent and other current algorithms are very weak optimization algorithms (relative to e.g. humans), and so learned optimization algorithms will be necessary to reach human levels of sample efficiency."]}
{"text": "The unexpected difficulty of comparing AlphaStar to humans\n\n*By Rick Korzekwa, 17 September 2019*\n\n\n Artificial intelligence defeated a pair of professional Starcraft II players for the first time in December 2018. Although this was generally regarded as an impressive achievement, it quickly became clear that not everybody was satisfied with how the AI agent, called AlphaStar, interacted with the game, or how its creator, DeepMind, presented it. Many observers complained that, in spite of DeepMind’s claims that it performed at similar speeds to humans, AlphaStar was able to control the game with greater speed and accuracy than any human, and that this was the reason why it prevailed.\n\n\nAlthough I think this story is mostly correct, I think it is harder than it looks to compare AlphaStar’s interaction with the game to that of humans, and to determine to what extent this mattered for the outcome of the matches. Merely comparing raw numbers for actions taken per minute (the usual metric for a player’s speed) does not tell the whole story, and appropriately taking into account mouse accuracy, the differences between combat actions and non-combat actions, and the control of the game’s “camera” turns out to be quite difficult.\n\n\nHere, I begin with an overview of Starcraft II as a platform for AI research, a timeline of events leading up to AlphaStar’s success, and a brief description of how AlphaStar works. Next, I explain why measuring performance in Starcraft II is hard, show some analysis on the speed of both human and AI players, and offer some preliminary conclusions on how AlphaStar’s speed compares to humans. After this, I discuss the differences in how humans and AlphaStar “see” the game and the impact this has on performance. Finally, I give an update on DeepMind’s current experiments with Starcraft II and explain why I expect we will encounter similar difficulties when comparing human and AI performance in the future. \n\n\n Why Starcraft is a Target for AI Research\n------------------------------------------\n\n\n Starcraft II has been a target for AI for several years, and some readers will recall that Starcraft II appeared on our [2016 expert survey](https://aiimpacts.org/2016-expert-survey-on-progress-in-ai/). But there are many games and many AIs that play them, so it may not be obvious why Starcraft II is a target for research or why it is of interest to those of us that are trying to understand what is happening with AI. \n\n\nFor the most part, Starcraft II was chosen because it is popular, and it is difficult for AI. Starcraft II is a real time strategy game, and like similar games, it requires a variety of tasks: harvesting resources, constructing bases, researching technology, building armies, and attempting to destroy the opponent’s base are all part of the game. Playing it well requires balancing attention between many things at once: planning ahead, ensuring that one’s units[1](https://aiimpacts.org/the-unexpected-difficulty-of-comparing-alphastar-to-humans/#easy-footnote-bottom-1-1980 \"“Units” in Starcraft are the diverse elements that make up a player’s army. For example, in the December matches, AlphaStar preferred a combination of units called Stalkers that walk on the ground and shoot projectiles and flying units which are strong against other flying units, which have a special ability against ground units.\") are good counters for the enemy’s units, predicting opponents’ moves, and changing plans in response to new information. There are other aspects that make it difficult for AI in particular: it has imperfect information[2](https://aiimpacts.org/the-unexpected-difficulty-of-comparing-alphastar-to-humans/#easy-footnote-bottom-2-1980 \"Imperfect information means that players can’t see everything that’s going on in the game; chess, for example, has perfect information because both players see the whole board. Starcraft has imperfect information because you only have access to information about what your units and what they can “see”.\"), an extremely large action space, and takes place in real time. When humans play, they engage in long term planning, making the best use of their limited capacity for attention, and crafting ploys to deceive the other players.\n\n\nThe game’s popularity is important because it makes it a good source of extremely high human talent and increases the number of people that will intuitively understand how difficult the task is for a computer. Additionally, as a game that is designed to be suitable for high-level competition, the game is carefully balanced so that competition is fair, does not favor just one strategy[3](https://aiimpacts.org/the-unexpected-difficulty-of-comparing-alphastar-to-humans/#easy-footnote-bottom-3-1980 \"https://deepmind.com/blog/article/alphastar-mastering-real-time-strategy-game-starcraft-ii “StarCraft is a game where, just like rock-paper-scissors, there is no single best strategy.”\"), and does not rely too heavily on luck. \n\n\n Timeline of Events\n-------------------\n\n\n To put AlphaStar’s performance in context, it helps to understand the timeline of events over the past few years:\n\n\n**November 2016:** Blizzard and DeepMind [announce](https://deepmind.com/blog/deepmind-and-blizzard-release-starcraft-ii-ai-research-environment/) they are launching a new project in Starcraft II AI\n\n\n**August 2017:** DeepMind [releases](https://deepmind.com/blog/deepmind-and-blizzard-open-starcraft-ii-ai-research-environment/) the Starcraft II API, a set of tools for interfacing AI with the game\n\n\n**March 2018:** Oriol Vinyals gives an [update](https://news.blizzard.com/en-us/starcraft2/21509421/checking-in-with-the-deepmind-starcraft-ii-team), saying they’re making progress, but he doesn’t know if their agent will be able to beat the best human players\n\n\n**November 3, 2018:** Oriol Vinyals gives another update at a Blizzcon panel, and shares a sequence of videos demonstrating AlphaStar’s progress in learning the game, including leaning to win against the hardest built-in AI. When asked if they could play against it that day, he says “For us, it’s still a bit early in the research.”\n\n\n**December 12, 2018:** AlphaStar wins five straight matches against TLO, a professional Starcraft II player, who was playing as Protoss[4](https://aiimpacts.org/the-unexpected-difficulty-of-comparing-alphastar-to-humans/#easy-footnote-bottom-4-1980 \"Protoss is one of the three “races” that a player can choose in Starcraft II, each of which requires different strategies to play well\"), which is off-race for him. DeepMind keeps the matches secret.\n\n\n**December 19, 2018:** AlphaStar, given an additional week of training time[5](https://aiimpacts.org/the-unexpected-difficulty-of-comparing-alphastar-to-humans/#easy-footnote-bottom-5-1980 \"DeepMind says this was “after training our agents for an additional week”, though it is unclear how much of the week in between the matches was spent training\"), wins five consecutive Protoss vs Protoss matches vs MaNa, a pro Starcraft II player who is higher ranked than TLO and specializes in Protoss. DeepMind continues to keep the victories a secret.\n\n\n**January 24, 2019:** DeepMind [announces](https://deepmind.com/blog/alphastar-mastering-real-time-strategy-game-starcraft-ii/) the successful test matches vs TLO and MaNa in a live video feed. MaNa plays a live match against a version of AlphaStar which had more constraints on how it “saw” the map, forcing it to interact with the game in a way more similar to humans[6](https://aiimpacts.org/the-unexpected-difficulty-of-comparing-alphastar-to-humans/#easy-footnote-bottom-6-1980 \"More on this in the section titled The Camera\"). AlphaStar loses when MaNa finds a way to exploit a blatant failure of the AI to manage its units sensibly. The replays of all the matches are released, and people start arguing[7](https://aiimpacts.org/the-unexpected-difficulty-of-comparing-alphastar-to-humans/#easy-footnote-bottom-7-1980 \"Many of these arguments can be found on reddit. See, for example: https://www.reddit.com/r/pcgaming/comments/ajo1rd/alphastar_ai_beats_starcraft_pros_by_deepmind/\") about how (un)fair the matches were, whether AlphaStar is any good at making decisions, and how honest DeepMind was in presenting the results of the matches.\n\n\n**July 10, 2019:** DeepMind and Blizzard announce that they will allow an experimental version of AlphaStar to play on the European ladder[8](https://aiimpacts.org/the-unexpected-difficulty-of-comparing-alphastar-to-humans/#easy-footnote-bottom-8-1980 \"A ladder in online gaming is a competitive league in which players “climb” a series of ranks by winning matches against increasingly skilled players\"), for players who opt in. The agent will play anonymously, so that most players will not know that they are playing against a computer. Over the following weeks, players attempt to discern whether they played against the agent, and some post replays of matches in which they believe they were matched with the agent. \n\n\n How AlphaStar works\n--------------------\n\n\n The best place to learn about AlphaStar is from [DeepMind’s page](https://deepmind.com/blog/article/alphastar-mastering-real-time-strategy-game-starcraft-ii) about it. There are a few particular aspects of the AI that are worth keeping in mind:\n\n\n**It does not interact with the game like a human does:** Humans interact with the game by looking at a screen, listening through headphones or speakers, and giving commands through a mouse and keyboard. AlphaStar is given a list of units or buildings and their attributes, which includes things like their location, how much damage they’ve taken, and which actions they’re able to take, and gives commands directly, using coordinates and unit identifiers. For most of the matches, it had access to information about anything that wouldn’t normally be hidden from a human player, without needing to control a “camera” that focuses on only one part of the map at a time. For the final match, it had a camera restriction similar to humans, though it still was not given screen pixels as input. Because it gives commands directly through the game, it does not need to use a mouse accurately or worry about tapping the wrong key by accident.\n\n\n**It is trained first by watching human matches, and then through self-play:** The neural network is trained first on a large database of matches between humans, and then by playing against versions of itself.\n\n\n**It is a set of agents selected from a tournament:** Hundreds of versions of the AI play against each other, and the ones that perform best are selected to play against human players. Each one has its own set of units that it is incentivized to use via reinforcement learning, so that they each play with different strategies. TLO and MaNa played against a total of 11 agents, all of which were selected from the same tournament, except the last one, which had been substantially modified. The agents that defeated MaNa had each played for hundreds of years in the virtual tournament[9](https://aiimpacts.org/the-unexpected-difficulty-of-comparing-alphastar-to-humans/#easy-footnote-bottom-9-1980 \"https://www.reddit.com/r/MachineLearning/comments/ajgzoc/we_are_oriol_vinyals_and_david_silver_from/eexstlo/ “At an average duration of 10 minutes per game, this amounts to about 10 million games. Note, however, that not all agents were trained for as long as 200 years, that was the maximum amongst all the agents in the league.”\"). \n\n\n January/February Impressions Survey\n------------------------------------\n\n\n Before deciding to focus my investigation on a comparison between human and AI performance in Starcraft II, I conducted an informal survey with my Facebook friends, my colleagues at AI Impacts, and a few people from an effective altruism Facebook group. I wanted to know what they were thinking about the matches in general, with an emphasis on which factors most contributed to the outcome of the matches. I’ve put details about my analysis and the full results of the survey in the appendix at the end of this article, but I’ll summarize a few major results here. \n\n\n#### **Forecasts**\n\n\nThe timing and nature of AlphaStar’s success seems to have been mostly in line with people’s expectations, at least at the time of the announcement. Some respondents did not expect to see it for a year or two, but on average, AlphaStar was less than a year earlier than expected. It is probable that some respondents had been expecting it to take longer, but updated their predictions in 2016 after finding out that DeepMind was working on it. For future expectations, a majority of respondents expect to see an agent (not necessarily AlphaStar) that can beat the best humans without any of the current caveats within two years. In general, I do not think that I worded the forecasting questions carefully enough to infer very much from the answers given by survey respondents.\n\n\nSome readers may be wondering how these survey results compare to those of our more careful 2016 survey, or how we should view the earlier survey results in light of MaNa and TLOs defeat at the hands of AlphaStar. The 2016 survey specified an agent that only receives a video of the screen, so that prediction has not yet resolved. But the median respondent assigned 50% probability of seeing such an agent that can defeat the top human players at least 50% of the time by 2021[10](https://aiimpacts.org/the-unexpected-difficulty-of-comparing-alphastar-to-humans/#easy-footnote-bottom-10-1980 \"See “years by probability” at https://aiimpacts.org/2016-expert-survey-on-progress-in-ai/\"). I don’t personally know how hard it is to add in that capability, but my impression from speaking to people with greater machine learning expertise than mine is that this is not out of reach, so these predictions still seem reasonable, and are not generally in disagreement with the results from my informal survey.\n\n\n#### **Speed**\n\n\nNearly everyone thought that AlphaStar was able to give commands faster and more accurately than humans, and that this advantage was an important factor in the outcome of the matches. I looked into this in more detail, and wrote about it in the next section.\n\n\n#### **Camera**\n\n\nAs I mentioned in the description of AlphaStar, it does not see the game the same way that humans do. Its visual field covered the entire map, though its vision was still affected by the usual fog of war[11](https://aiimpacts.org/the-unexpected-difficulty-of-comparing-alphastar-to-humans/#easy-footnote-bottom-11-1980 \"In Starcraft II, players can only see the parts of the map that are within visual range of its units and buildings, with a few exceptions.\"). Survey respondents ranked this as an important factor in the outcome of the matches.\n\n\nGiven these results, I decided to look into the speed and camera issues in more detail. \n\n\n The Speed Controversy\n----------------------\n\n\n Starcraft is a game that rewards the ability to micromanage many things at once and give many commands in a short period of time. Players must simultaneously build their bases, manage resource collection, scout the map, research better technology, build individual units to create an army, and fight battles against other players. The combat is sufficiently fine grained that a player who is outnumbered or outgunned can often come out ahead by exerting better control over the units that make up their military forces, both on a group level and an individual level. For years, there have been simple Starcraft II bots that, although they cannot win a match against a highly-skilled human player, can do [amazing things](https://tl.net/forum/starcraft-2/497826-micro-ai-bot) that humans can’t do, by controlling dozens of units individually during combat. In practice, human players are limited by how many actions they can take in a given amount of time, usually measured in actions per minute (APM). Although DeepMind imposed restrictions on how quickly AlphaStar could react to the game and how many actions it could take in a given amount of time, many people believe that the agent was sometimes able to act with superhuman speed and precision. \n\n\n Here is a graph[12](https://aiimpacts.org/the-unexpected-difficulty-of-comparing-alphastar-to-humans/#easy-footnote-bottom-12-1980 \"This and all of the following data come from Starcraft II replay files. Replay files are lists of commands given by each player, which can then be run through the full Starcraft II client to reproduce the entire match. These files can also be analyzed using software like Scelight (https://sites.google.com/site/scelight/) to extract metrics like actions per minute or fraction of resources spent, and to create graphs\") of the APM for MaNa (red) and AlphaStar (blue), through the second match, with five-second bins: \n\n\n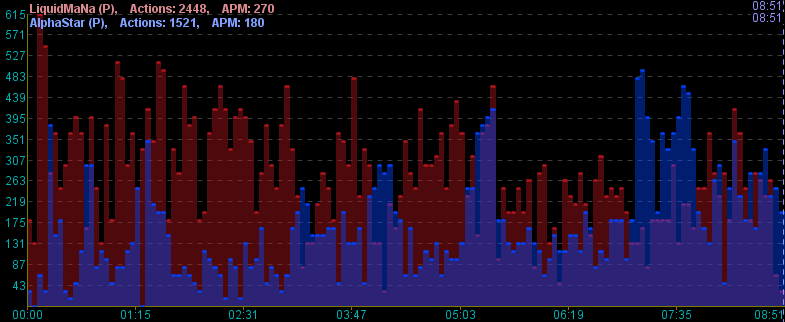 Actions per minute for MaNa (red) and AlphaStar (blue) in their second game. The horizontal axis is time, and the vertical axis is 5 second average APM. \nAt first glance, this looks reasonably even. AlphaStar has both a lower average APM (180 vs MaNa’s 270) for the whole match, and a lower peak 5 second APM (495 vs Mana’s 615). This seems consistent with DeepMind’s claim that AlphaStar was restricted to human-level speed. But a more detailed look at which actions are actually taken during these peaks reveals some crucial differences. Here’s a sample of actions taken by each player during their peaks:\n\n\n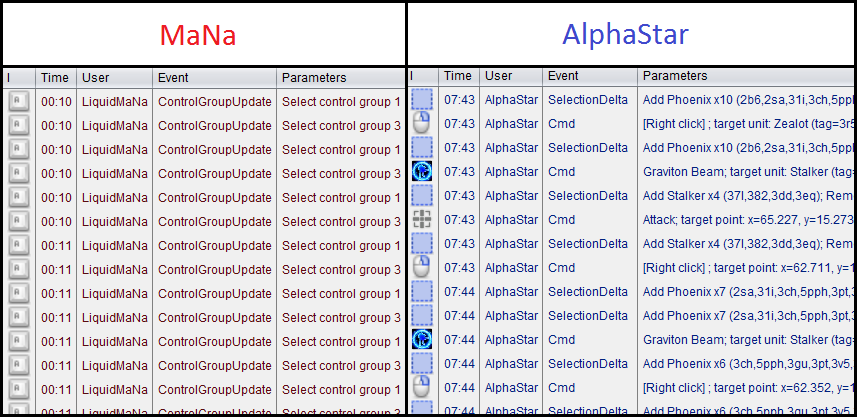Lists of commands for MaNa and AlphaStar during each player’s peak APM for game 2\n MaNa hit his APM peaks early in the game by using hot keys to twitchily switch back and forth between control groups[13](https://aiimpacts.org/the-unexpected-difficulty-of-comparing-alphastar-to-humans/#easy-footnote-bottom-13-1980 \" Starcraft II allows players to assign hot-keys to groups of units and buildings, called control groups, so that they can select the right units more quickly\") for his workers and the main building in his base. I don’t know why he’s doing this: maybe to warm up his fingers (which apparently is a thing), as a way to watch two things at once, to keep himself occupied during the slow parts of the early game, or some other reason understood only by the kinds of people that can produce Starcraft commands faster than I can type. But it drives up his peak APM, and probably is not very important to how the game unfolds[14](https://aiimpacts.org/the-unexpected-difficulty-of-comparing-alphastar-to-humans/#easy-footnote-bottom-14-1980 \"As a quick experiment, I tried playing a match against Starcraft II’s built-in AI in which I attempted to add in a lot of extraneous actions, like spam-clicking commands and rapidly switching back-and-forth between control groups when I didn’t need to. Then I compared it to a match I’d played vs the built-in AI earlier that same day, shortly before I thought to do the experiment. The spam-filled match had an average APM of 130, while the non-spam match had an average of 50 APM (yeah, I’m not very good at Starcraft). I’d say the two matches went about as well as each other, but this is partly because I did not try to keep the spam going during combat.\"). Here’s what MaNa’s peak APM looked like at the beginning of Game 2 (if you look at the bottom of the screen, you can see that the units he has selected switches back-and-forth between his workers and the building that he uses to make more workers): \n\n\nMaNa’s play during his peak APM for match 2. Most of his actions consist of switching between control groups without giving new commands to any units or buildings\n AlphaStar hit peak APM in combat. The agent seems to reserve a substantial portion of its limited actions budget until the critical moment when it can cash them in to eliminate enemy forces and gain an advantage. Here’s what that looked like near the end of game 2, when it won the engagement that probably won it the match (while still taking a few actions back at its base to keep its production going): \n\n\nAlphaStar’s play during its peak APM in match 2. Most of its actions are related to combat, and require precise timing.\n It may be hard to see what exactly is happening here for people who have not played the game. AlphaStar (blue) is using extremely fine-grained control of its units to defeat MaNa’s army (red) in an efficient way. This involves several different actions: Commanding units to move to different locations so they can make their way into his base while keeping them bunched up and avoiding spots that make them vulnerable, focusing fire on MaNa’s units to eliminate the most vulnerable ones first, using special abilities to lift MaNa’s units off the ground and disable them, and redirecting units to attack MaNa’s workers once a majority of MaNa’s military units are taken care of. \n\n\n Given these differences between how MaNa and AlphaStar play, it seems clear that we can’t just use raw match-wide APM to compare the two, which most people paying attention seem to have noticed fairly quickly after the matches. The more difficult question is whether AlphaStar won primarily by playing with a level of speed and accuracy that humans are incapable of, or by playing better in other ways. Though based on the analysis that I am about to present I think the answer is probably that AlphaStar won through speed, I also think the question is harder to answer definitively than many critics of DeepMind are making it out to be. \n\n\n A [very fast human](https://www.youtube.com/watch?v=HRsDAX8DfBw&t=611) can average well over 300 APM for several minutes, with 5 second bursts at over 600 APM. Although these bursts are not always throwaway commands like those from the MaNa vs AlphaStar matches, they tend not to be commands that require highly accurate clicking, or rapid movement across the map. Take, for example, this 10 second, 600 APM peak from current top player Serral: \n\n\nSerral’s play during a 10 second, 600 APM peak\n Here, Serral has just finished focusing on a pair of battles with the other player, and is taking care of business in his base, while still picking up some pieces on the battlefield. It might not be obvious why he is issuing so many commands during this time, so let’s look at the list of commands: \n\n\n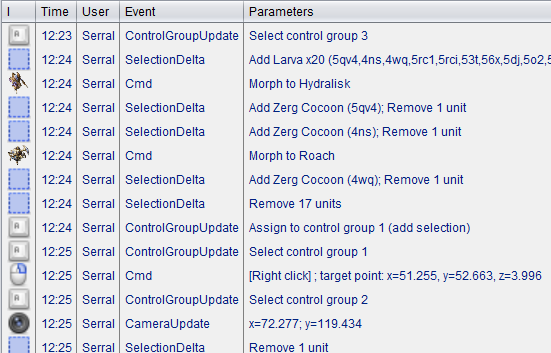\n The lines that say “Morph to Hydralisk” and “Morph to Roach” represent a series of repeats of that command. For a human player, this is a matter of pressing the same hotkey many times, or even just holding down the key to give the command very rapidly[15](https://aiimpacts.org/the-unexpected-difficulty-of-comparing-alphastar-to-humans/#easy-footnote-bottom-15-1980 \"This can be done extremely quickly, if you modify the settings of your OS and hardware, with 100+ key repeats per second (which corresponds to 6000 APM)\"). You can see this in the gif by looking at the bottom center of the screen where he selects a bunch of worm-looking things and turns them all into a bunch of egg-looking things (it happens very quickly, so it can be easy to miss).\n\n\nWhat Serral is doing here is difficult, and the ability to do it only comes with years of practice. But the raw numbers don’t tell the whole story. Taking 100 actions in 10 seconds is much easier when a third of those actions come from holding down a key for a few hundred milliseconds than when they each require a press of a different key or a precise mouse click. And this is without all the extraneous actions that humans often take (as we saw with MaNa).\n\n\nBecause it seems to be the case that peak human APM happens outside of combat, while AlphaStar’s wins happened during combat APM peaks, we need to do a more detailed analysis to determine the highest APM a human player can achieve during combat. To try to answer this question, I looked at approximately ten APM for each of the 5 games between AlphaStar and MaNa, as well as each of another 15 replays between professional Starcraft II players. The peaks were chosen so that roughly half were the largest peak at any time during the match and the rest were strictly during combat. My methodology for this is given in the appendix. Here are the results for just the human vs human matches:\n\n\n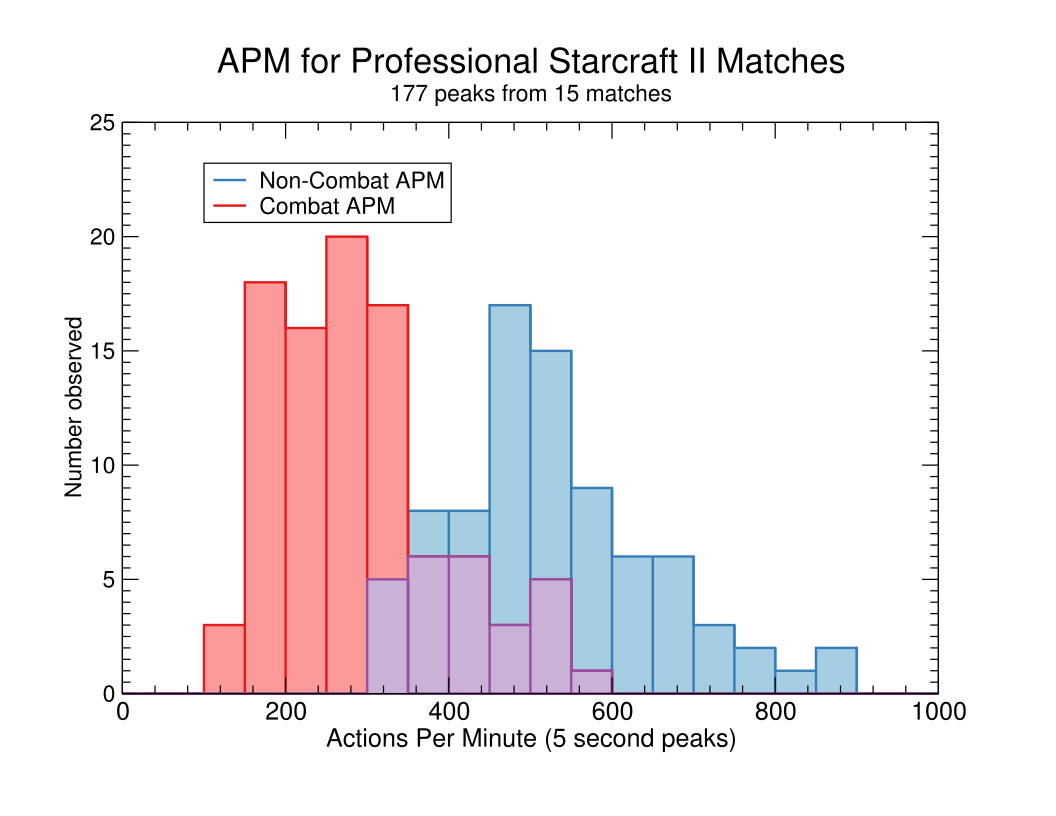Histogram of 5-second APM peaks from analyzed matches between human professional players in a tournament setting The blue bars are peaks achieved outside of combat, while the red bars are those achieved during combat.\n Provisionally, it looks like pro players frequently hit approximately 550 to 600 APM outside of combat before the distribution starts to fall off, and they peak at around 200-350 during combat, with a long right tail. As I was doing this, however, I found that all of the highest APM peaks had one thing in common with each other that they did not have in common with all of the lower APM peaks, which is that it was difficult to tell when a player’s actions are primarily combat-oriented commands, and when they are mixed in with bursts of commands for things like training units. In particular, I found that the combat situations with high APM tended to be similar to the Serral gif above, in that they involve spam clicking and actions related to the player’s economy and production, which was probably driving up the numbers. I give more details in the appendix, but I don’t think I can say with confidence that any players were achieving greater than 400-450 APM in combat, in the absence of spurious actions or macromanagement commands. \n\n\n The more pertinent question might what the lowest APM is that a player can have while still succeeding at the highest level. Since we know that humans can succeed without exceeding this APM, it is not an unreasonable limitation to put on AlphaStar. The lowest peak APM in combat I saw for a winning player in my analysis was 215, though it could be that I missed a higher peak during combat in that same match. \n\n\n Here is a histogram of AlphaStar’s combat APM: \n\n\n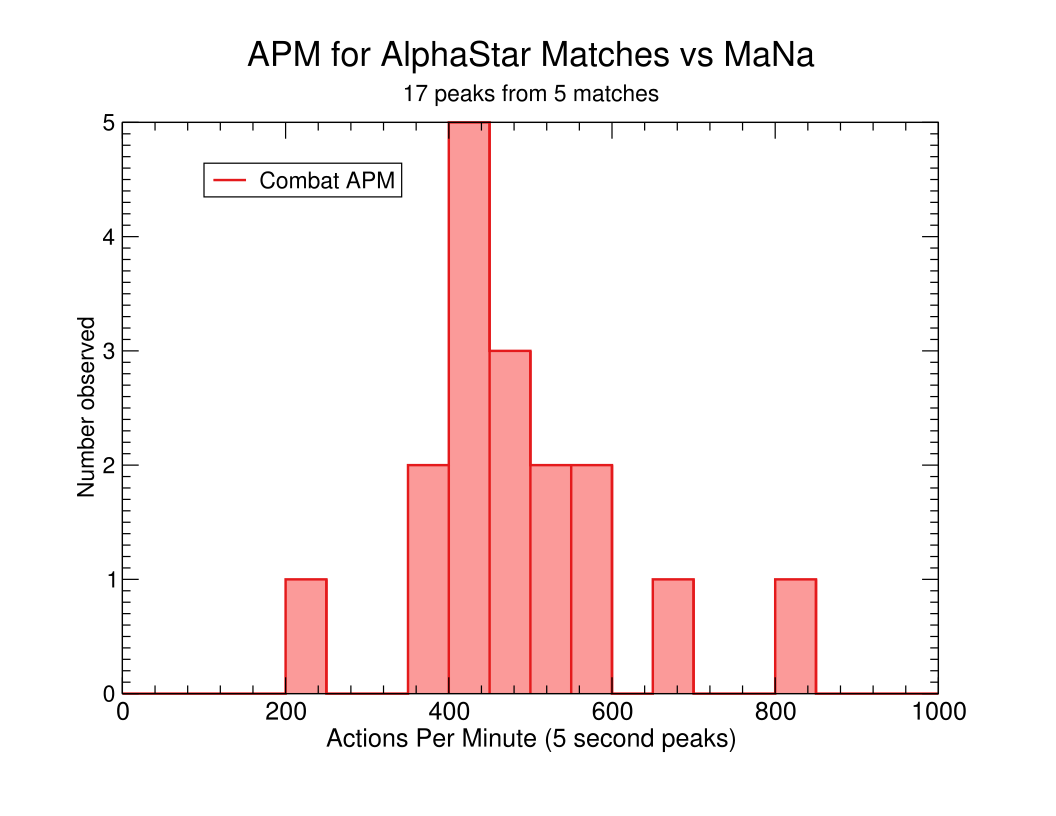\n The smallest 5-second APM that AlphaStar needed to win a match against MaNa was just shy of 500. I found 14 cases in which the agent was able to average over 400 APM for 5 seconds in combat, and six times when the agent averaged over 500 APM for more than 5 seconds. This was done with perfect accuracy and no spam clicking or control group switching, so I think we can safely say that its play was faster than is required for a human to win a match in a professional tournament. Given that I found no cases where a human was clearly achieving this speed in combat, I think I can comfortably say that AlphaStar had a large enough speed advantage over MaNa to have substantially influenced the match.\n\n\nIt’s easy to get lost in numbers, so it’s good to take a step back and remind ourselves of the insane level of skill required to play Starcraft II professionally. The top professional players already play with what looks to me like superhuman speed, precision, and multitasking, so it is not surprising that the agent that can beat them is so fast. Some observers, especially those in the Starcraft community, have indicated that they will not be impressed until AI can beat humans at Starcraft II at sub-human APM. There is some extent to which speed can make up for poor strategy and good strategy can make up for a lack of speed, but it is not clear what the limits are on this trade-off. It may be very difficult to make an agent that can beat professional Starcraft II players while restricting its speed to an undisputedly human or sub-human level, or it may simply be a matter of a couple more weeks of training time.\n\n\n The Camera\n-----------\n\n\n As I explained earlier, the agent interacts with the game differently than humans. As with other games, humans look at a screen to know what’s happening, use a mouse and keyboard to give commands, and need to move the game’s ‘camera’ to see different parts of the play area. With the exception of the final exhibition match against MaNa, AlphaStar was able to see the entire map at once (though much of it is concealed by the fog of war most of the time), and had no need to select units to get information about them. It’s unclear just how much of an advantage this was for the agent, but it seems likely that it was significant, if nothing else because it did not suffer from the APM overhead just to look around and get information from the game. Furthermore, seeing the entire map makes it easier to simultaneously control units across the map, which AlphaStar used to great effect in the first five matches against MaNa.\n\n\nFor the exhibition match in January, DeepMind trained a version of AlphaStar that had similar camera control to human players. Although the agent still saw the game in a way that was abstracted from the screen pixels that humans see, it only had access to about one screen’s worth of information at a time, and it needed to spend actions to look at different parts of the map. A further disadvantage was that this version of the agent only had half as much training time as the agents that beat MaNa.\n\n\nHere are three factors that may have contributed to AlphaStar’s loss:\n\n\n1. The agent was unable to deal effectively with the added complication of controlling the camera\n2. The agent had insufficient training time\n3. The agent had easily exploitable flaws the whole time, and MaNa figured out how to use them in match 6\n\n\nFor the third factor, I mean that the agent had sufficiently many exploitable flaws that were obvious enough to human players that any skilled human player could find at least one during a small number of games. The best humans do not have a sufficient number of such flaws to influence the game with any regularity. Matches in professional tournaments are not won by causing the other player to make the same obvious-to-humans mistake over and over again. \nI suspect that AlphaStar’s loss in January is mainly due to the first two factors. In support of 1, AlphaStar seemed less able to simultaneously deal with things happening on opposite sides of the map, and less willing to split its forces, which could plausibly be related to an inability to simultaneously look at distant parts of the map. It’s not just that the agent had to move the camera to give commands on other parts of the map. The agent had to remember what was going on globally, rather than being able to see it all the time. In support of 2, the agent that MaNa defeated had only as much training time as the agents that went up against TLO, and those agents lost to the agents that defeated MaNa 94% of the time during training[16](https://aiimpacts.org/the-unexpected-difficulty-of-comparing-alphastar-to-humans/#easy-footnote-bottom-16-1980 \"This is based on the chart “AlphaStar League Strategy Map” from https://deepmind.com/blog/article/alphastar-mastering-real-time-strategy-game-starcraft-ii I have compiled the win/loss statistics into a spreadsheet here: https://docs.google.com/spreadsheets/d/1l15n-eDoHBzWXMwpv3Lb-mHHB9jS5Jk_4AsZuq2TB6w/edit?usp=sharing\").\n\n\nStill, it is hard to dismiss the third factor. One way in which an agent can improve through training is to encounter tactics that it has not seen before, so that it can react well if it sees it in the future. But the tactics that it encounters are only those that another agent employed, and without seeing the agents during training, it is hard to know if any of them learned the harassment tactics that MaNa used in game 6, so it is hard to know if the agents that defeated MaNa were susceptible to the exploit that he used to defeat the last agent. So far, the evidence from DeepMind’s more recent experiment pitting AlphaStar against the broader Starcraft community (which I will go into in the next section) suggests that the agents do not tend to learn defenses to these types of exploits, though it is hard to say if this is a general problem or just one associated with low training time or particular kinds of training data. \n\n\n AlphaStar on the Ladder\n------------------------\n\n\n For the past couple months, as of this writing, skilled European players have had the opportunity to play against AlphaStar as part of the usual system for matching players with those of similar skill. For the version of AlphaStar that plays on the European ladder, DeepMind claims to have made changes that address the camera and action speed complaints from the January matches. The agent needs to control the camera, and [they say](https://news.blizzard.com/en-us/starcraft2/22933138/deepmind-research-on-ladder) they have placed restrictions on AlphaStar’s performance in consultation with pro players, particularly the maximum actions per minute and per second that the agent can make. I will be curious to see what numbers they arrive at for this. If this was done in an iterative way, such that pro players were allowed to see the agent play or to play against it, I expect they were able to arrive at a good constraint. Given the difficulty that I had with arriving at a good value for a combat APM restriction, I’m less confident that they would get a good value just by thinking about it, though if they were sufficiently conservative, they probably did alright.\n\n\nAnother reason to expect a realistic APM constraint is that DeepMind wanted to run the European ladder matches as a blind study, in which the human players did not know they were playing against an AI. If the agent were to play with the superhuman speed and accuracy that AlphaStar did in January, it would likely give it away and spoil the experiment.\n\n\nAlthough it is unclear that any players were able to tell they were playing against an AI during their match, it does seem that some were able to figure it out after the fact. One example comes from Lowko, who is a Dutch player who streams and does commentary for games. During a stream of a ladder match in Starcraft II, he noticed the player was doing some strange things near the end of the match, like lifting their buildings[17](https://aiimpacts.org/the-unexpected-difficulty-of-comparing-alphastar-to-humans/#easy-footnote-bottom-17-1980 \"One of the races in Starcraft II has the ability to lift many of their buildings off the ground, so that they can move them to a new location or get them out of reach of units that can only attack things on the ground\") when the match had clearly been lost, and air-dropping workers into Lowko’s base to kill units. Lowko did eventually win the match. Afterward, he was able to view the replay from the match and see that the player he had defeated did some very strange things throughout the entire match, the most notable of which was how the player controlled their units. The player used no control groups at all, which is, as far as I know, not something anybody does at high-level play[18](https://aiimpacts.org/the-unexpected-difficulty-of-comparing-alphastar-to-humans/#easy-footnote-bottom-18-1980 \"Lowko plays in the Master League, which is restricted to the top 2% of players\"). There were many other quirks, which he describes [in his entertaining video](https://www.youtube.com/watch?v=3HqwCrDBdTE), which I highly recommend to anyone who is interested.\n\n\nOther players have released replay files from matches against players they believed were AlphaStar, and they show the same lack of control groups. This is great, because it means we can get a sense of what the new APM restriction is on AlphaStar. There are now dozens of replay files from players who claim to have played against the AI. Although I have not done the level of analysis that I did with the matches in the APM section, it seems clear that they have drastically lowered the APM cap, with the matches I have looked at topping out at 380 APM peaks, which did not even occur in combat.\n\n\nIt seems to be the case that DeepMind has brought the agent’s interaction with the game more in line with human capability, but we will probably need to wait until they release the details of the experiment before we can say for sure.\n\n\nAnother notable aspect of the matches that people are sharing is that their opponent will do strange things that human players, especially skilled human players almost never do, most of which are detrimental to their success. For example, they will construct buildings that block them into their own base, crowd their units into a dangerous bottleneck to get to a cleverly-placed enemy unit, and fail to change tactics when their current strategy is not working. These are all the types of flaws that are well-known to exist in game-playing AI going back to much older games, including the original Starcraft, and they are similar to the flaw that MaNa exploited to defeat AlphaStar in game 6.\n\n\nAll in all, the agents that humans are uncovering seem to be capable, but not superhuman. Early on, the accounts that were identified as likely candidates for being AlphaStar were winning about 90-95% of their matches on the ladder, achieving Grandmaster rank, which is reserved for only the top 200 players in each region. I have not been able to conduct a careful investigation to determine the win rate or Elo rating for the agents. However, based on the videos and replays that have been released, plausible claims from reddit users, and my own recollection of the records for the players that seemed likely to be AlphaStar[19](https://aiimpacts.org/the-unexpected-difficulty-of-comparing-alphastar-to-humans/#easy-footnote-bottom-19-1980 \"Unfortunately, the pages for these accounts are no longer showing any results\"), a good estimate is that they were winning a majority of matches among Grandmaster players, but did not achieve an Elo rating that would suggest a favorable outcome in a rematch vs TLO[20](https://aiimpacts.org/the-unexpected-difficulty-of-comparing-alphastar-to-humans/#easy-footnote-bottom-20-1980 \"See https://www.reddit.com/r/starcraft/comments/cq9v0v/did_anyone_keep_up_with_what_mmrs_the_alphastar/ and https://starcraft2.com/en-us/ladder/grandmaster/1 The MMR ratings are Blizzard’s implementation of an Elo system. Take the estimates on that reddit post with a grain of salt.\").\n\n\nAs with AlphaStar’s January loss, it is hard to say if this is the result of insufficient training time, additional restrictions on camera control and APM, or if the flaws are a deeper, harder to solve problem for AI. It may seem unreasonable to chalk this up to insufficient training time given that it has been several months since the matches in December and January, but it helps to keep in mind that we do not yet know what DeepMind’s research goals are. It is not hard to imagine that their goals are based around sample efficiency or some other aspect of AI research that requires such restrictions. As with the APM restrictions, we should learn more when we get results published by DeepMind. \n\n\n Discussion\n-----------\n\n\n I have been focusing on what many onlookers have been calling a lack of “fairness” of the matches, which seems to come from a sentiment that the AI did not defeat the best humans on human terms. I think this is a reasonable concern; if we’re trying to understand how AI is progressing, one of our main interests is when it will catch up with us, so we want to compare its performance to ours. Since we already know that computers can do the things they’re able to do faster than we can do them, we should be less interested in artificial intelligence that can do things better than we can by being faster or by keeping track of more things at once. We are more interested in AI that can make better decisions than we can. \n\n\nGoing into this project, I thought that the disagreements surrounding the fairness of the matches were due to a lack of careful analysis, and I expected it to be very easy to evaluate AlphaStar’s performance in comparison to human-level performance. After all, the replay files are just lists of commands, and when we run them through the game engine, we can easily see the outcome of those commands. But it turned out to be harder than I had expected. Separating careful, necessary combat actions (like targeting a particular enemy unit) from important but less precise actions (like training new units) from extraneous, unnecessary actions (like spam clicks) turned out to be surprisingly difficult. I expect if I were to spend a few months learning a lot more about how the game is played and writing my own software tools to analyze replay files, I could get closer to a definitive answer, but I still expect there would be some uncertainty surrounding what actually constitutes human performance.\n\n\nIt is unclear to me where this leaves us. AlphaStar is an impressive achievement, even with the speed and camera advantages. I am excited to see the results of DeepMind’s latest experiment on the ladder, and I expect they will have satisfied most critics, at least in terms of the agent’s speed. But I do not expect it to become any easier to compare humans to AI in the future. If this sort of analysis is hard in the context of a game where we have access to all the inputs and outputs, we should expect it to be even harder once we’re looking at tasks for which success is less clear cut or for which the AI’s output is harder to objectively compare to humans. This includes some of the major targets for AI research in the near future. Driving a car does not have a simple win-loss condition, and novel writing does not have clear metrics for what good performance looks like.\n\n\nThe answer may be that, if we want to learn things from future successes or failures of AI, we need to worry less about making direct comparisons between human performance and AI performance, and keep watching the broad strokes of what’s going on. From AlphaStar, we’ve learned that one of two things is true: Either AI can do long-term planning, solve basic game theory problems, balance different priorities against each other, and develop tactics that work, or that there are tasks which seem at first to require all of these things but did not, at least not at a high level.\n\n\n*By Rick Korzekwa*\n\n\n*This post was edited to correct errors and add the 2018 Blizzcon Panel to the events timeline on September 18, 2019*.\n\n\nAcknowledgements\n----------------\n\n\nThanks to Gillian Ring for lending her expertise in e-sports and for helping me understanding some of the nuances of the game. Thanks to users of the [Starcraft subreddit](https://www.reddit.com/r/starcraft/) for helping me track down some of the fastest players in the world. And thanks to [Blizzard](https://www.blizzard.com/en-us/) and [DeepMind](https://www.deepmind.com/) for making the AlphaStar match replays available to the public. \n \nAll mistakes are my own, and should be pointed out to me via email at rick@aiimpacts.org.\n\n\n\nAppendix I: Survey Results in Detail\n-------------------------------------\n\n\nI received a total of 22 submissions, which wasn’t bad, given its length. Two respondents failed to correctly answer the question designed to filter out people that are goofing off or not paying attention, leaving 20 useful responses. Five people who filled out the survey were affiliated in some way with AI Impacts. Here are the responses for respondents’ self-reported level of expertise in Starcraft II and artificial intelligence:\n\n\n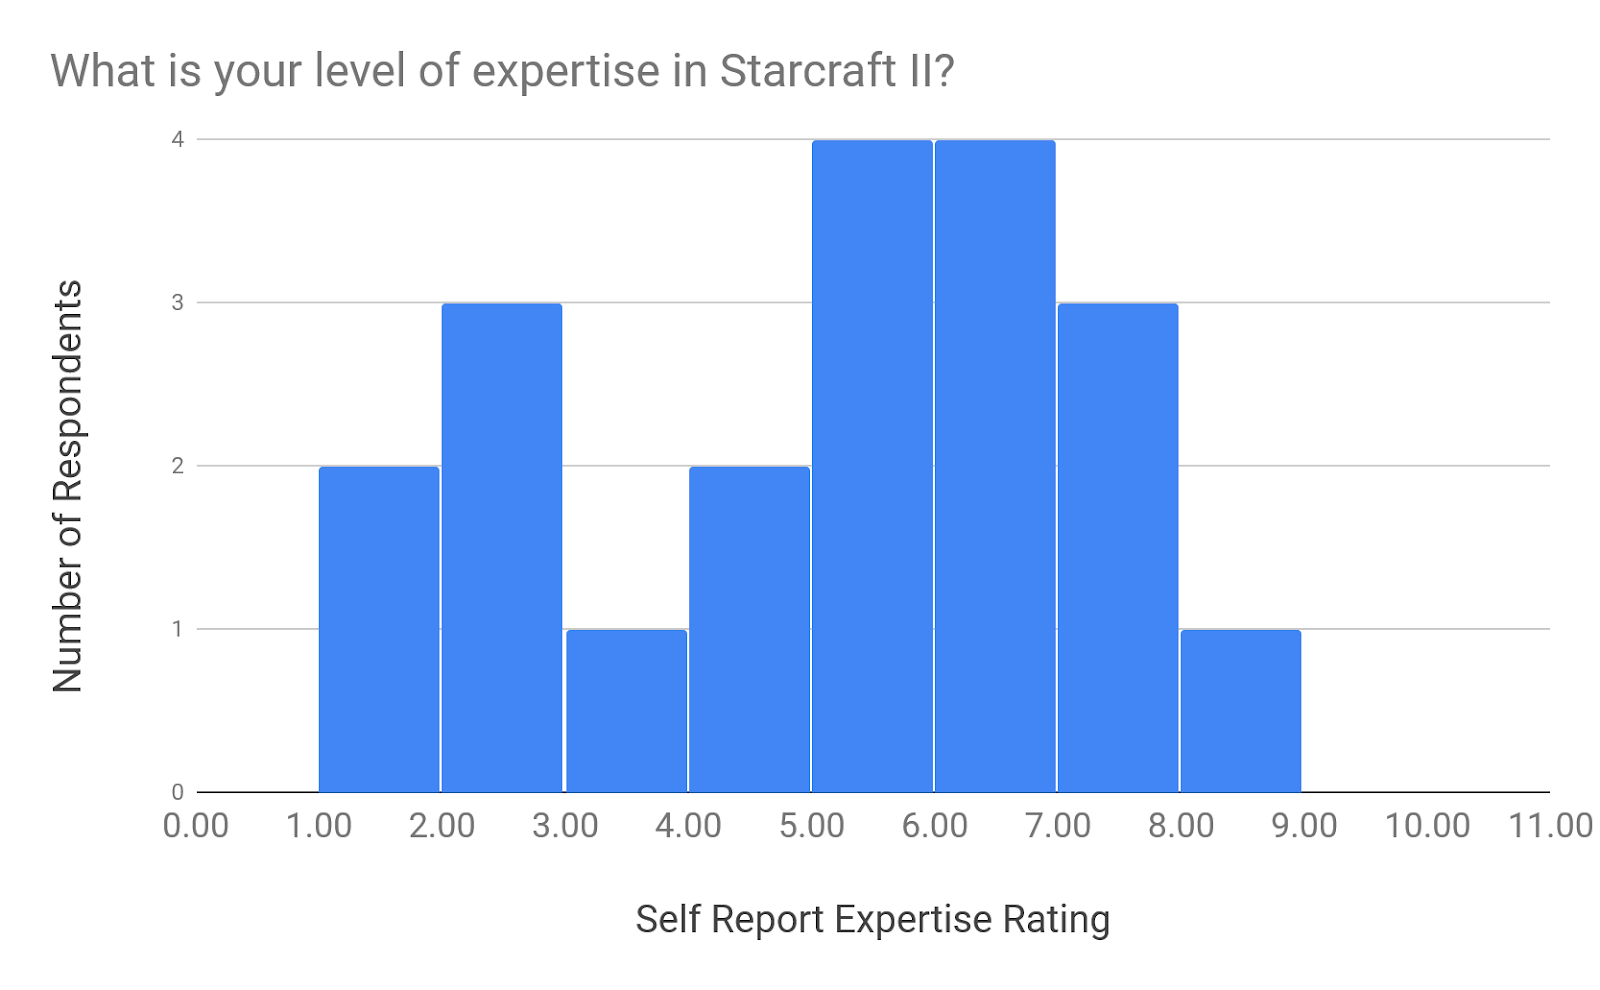\n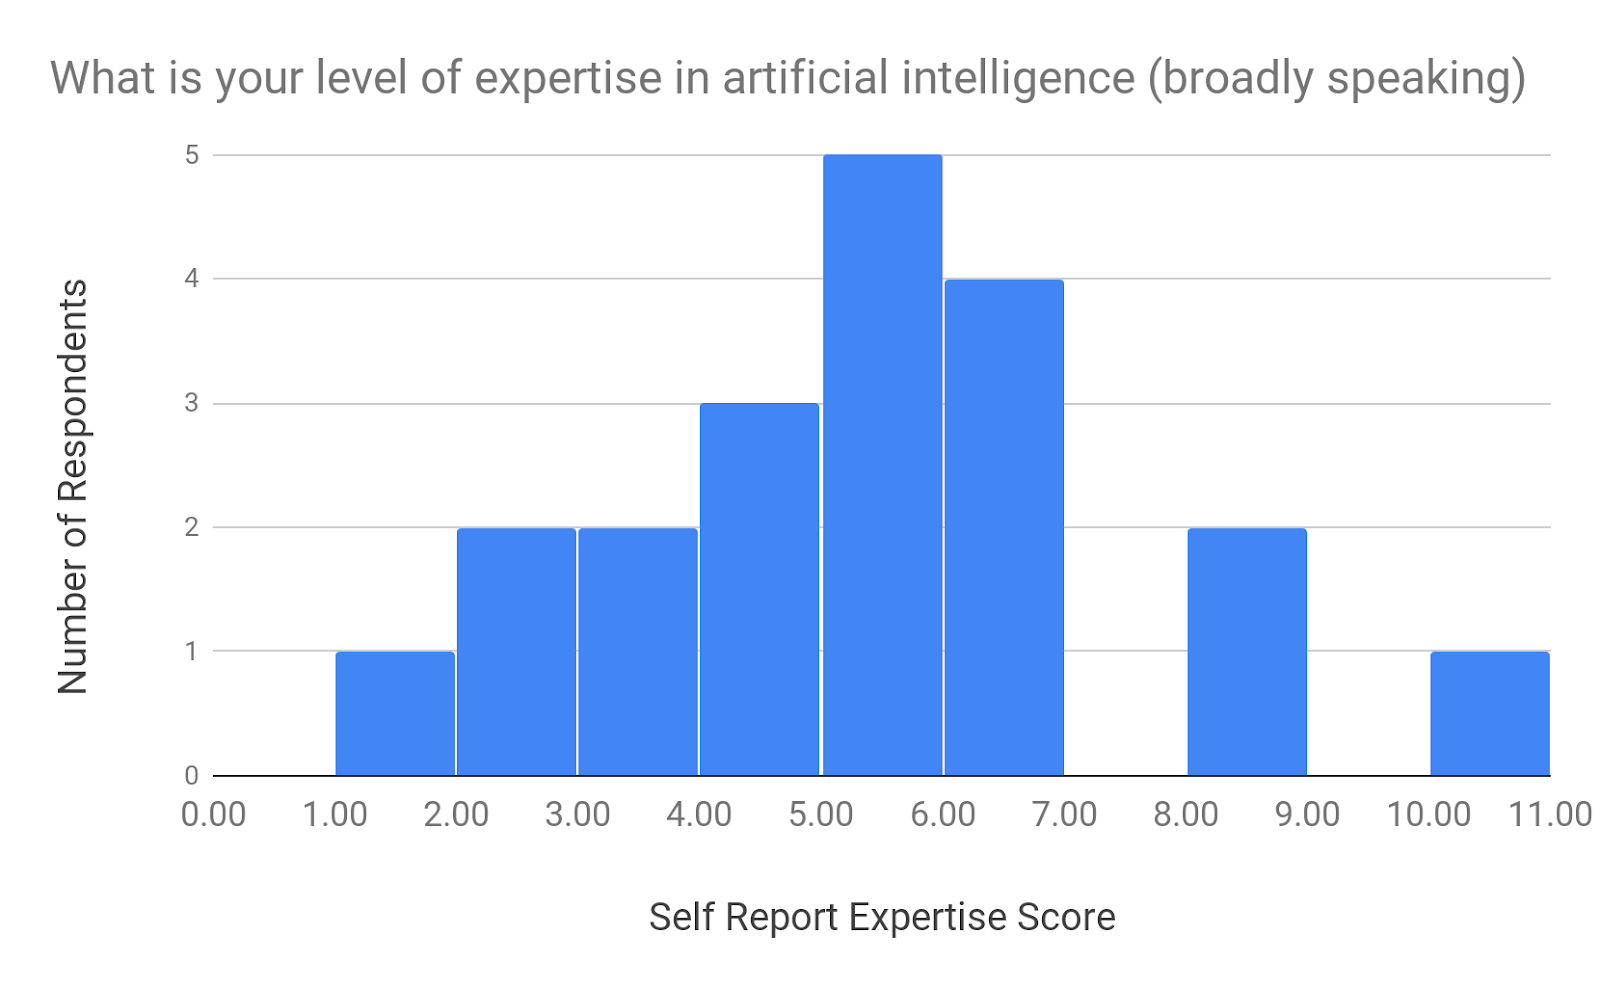\nSurvey respondents’ mean expertise rating was 4.6/10 for Starcraft II and 4.9/10 for AI. \n\n\n\n### Questions About AlphaStar’s Performance\n\n\n#### **How fair were the AlphaStar matches?**\n\n\nFor this one, it seems easiest to show a screenshot from the survey:\n\n\n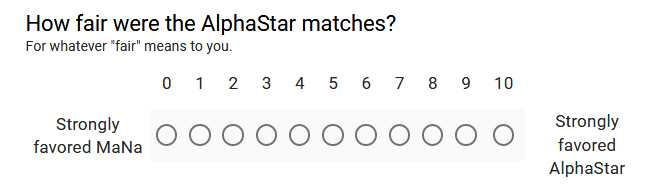\nThe results from this indicated that people thought the match was unfair and favored AlphaStar:\n\n\n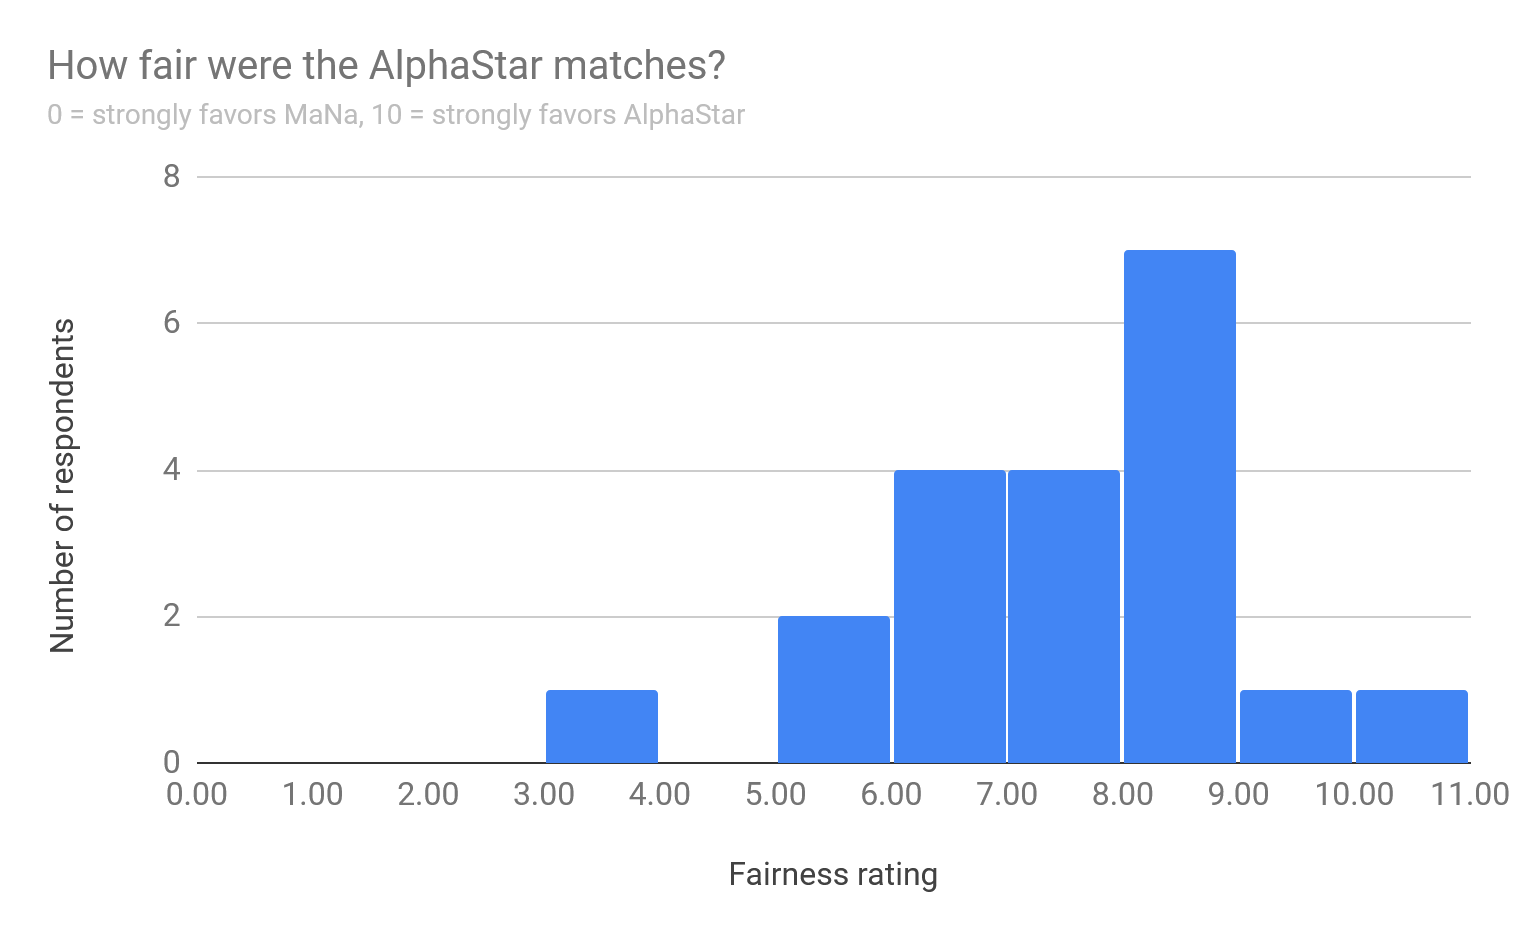\nI asked respondents to rate AlphaStar’s overall performance, as well as its “micro” and “macro”. The term “micro” is used to refer to a player’s ability to control units in combat, and is greatly improved by speed. There seems to have been some misunderstanding about how to use the word “macro”. Based on comments from respondents and looking around to see how people use the term on the Internet, it seems that that there are at least three somewhat distinct ways that people use the phrase, and I did not clarify which I meant, so I’ve discarded the results from that question. \n \nFor the next two questions, the scale ranges from 0 to 10, with 0 labeled “AlphaStar is much worse” and 10 labeled “AlphaStar is much better” \n\n\n\n#### **Overall, how do you think AlphaStar’s performance compares to the best humans?**\n\n\n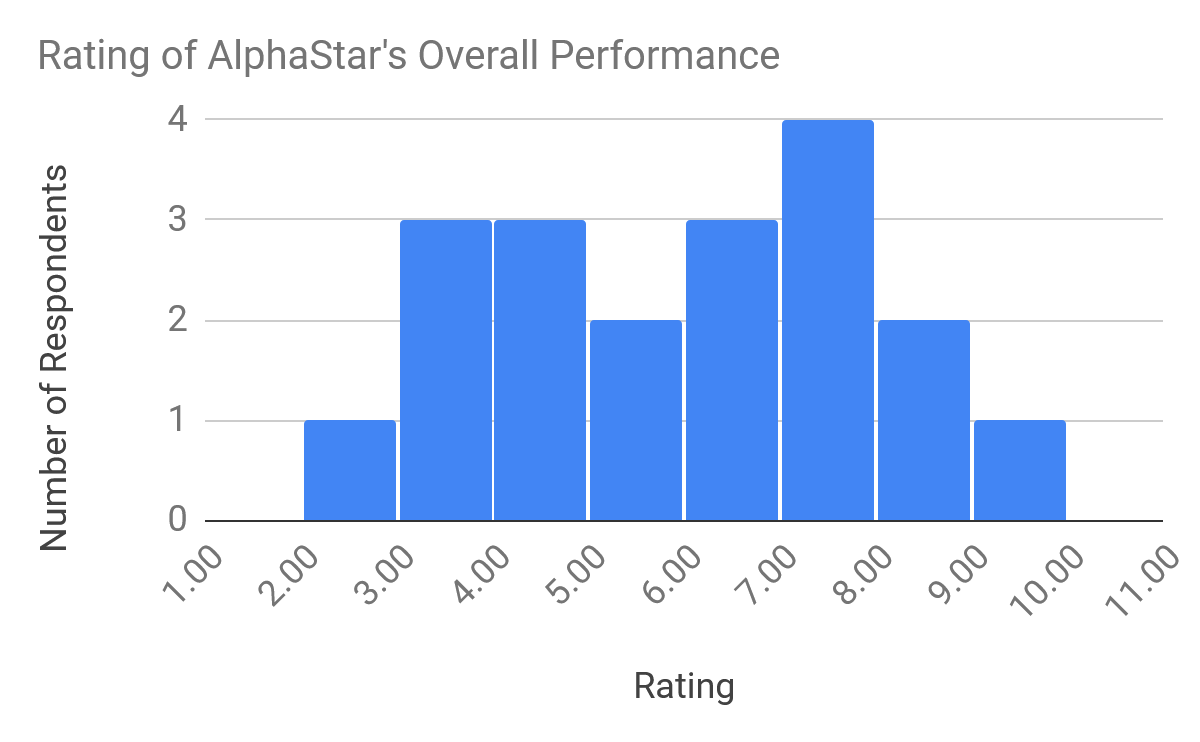\nI found these results interesting, because AlphaStar was able to consistently defeat professional players, so some survey respondents felt the outcome alone was not enough to rate it as at least as good as the best humans.\n\n\n**How do you think AlphaStar’s micro compares to the best humans?**\n\n\n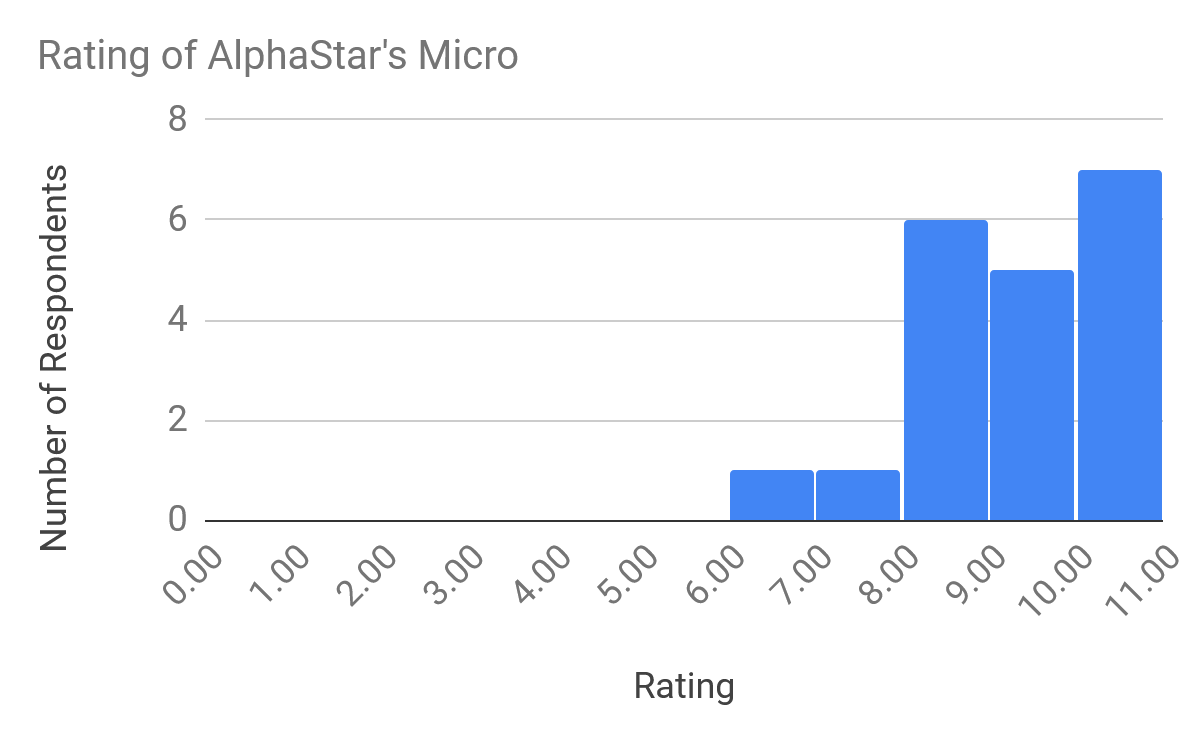\nSurvey respondents unanimously reported that they thought AlphaStar’s combat micromanagement was an important factor in the outcome of the matches.\n\n\n### Forecasting Questions\n\n\nRespondents were split on whether they expected to see AlphaStar’s level of Starcraft II performance by this time:\n\n\n#### **Did you expect to see AlphaStar’s level of performance in a Starcraft II agent:**\n\n\n\n\n| | |\n| --- | --- |\n| Before Now | 1 |\n| Around this time | 8 |\n| Later than now | 7 |\n| I had no expectation either way | 4 |\n\n\nRespondents who indicated that they expected it sooner or later than now were also asked by how many years their expectation differed from reality. If we assign negative numbers to “before now”, positive numbers to “Later than now”, zero to “Around this time”, ignore those with no expectation, and weight responses by level of expertise, we find respondents’ mean expectation was just 9 months later the announcement, and the median respondent expected to see it around this time. Here is a histogram of these results, without expertise weighting:\n\n\n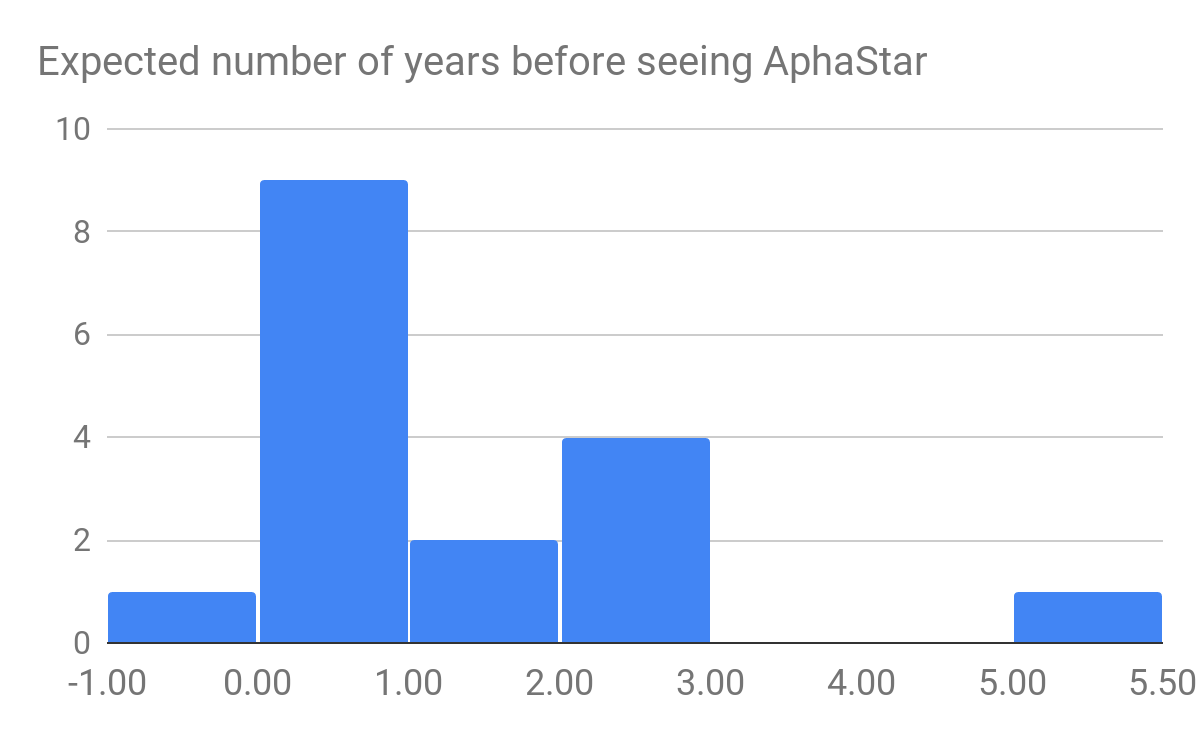\nThese results do not generally indicate too much surprise about seeing a Starcraft II agent of AlphaStar’s ability now. \n\n\n\n#### **How many years do you think it will be until we see (in public) an agent which only gets screen pixels as input, has human-level apm and reaction speed, and is very clearly better than the best humans?**\n\n\nThis question was intended to outline an AI that would satisfy almost anybody that Starcraft II is a solved game, such that AI is clearly better than humans, and not for “boring” reasons like superior speed. Most survey respondents expected to see such an agent in two-ish years, with a few a little longer, and two that expected it to take much longer. Respondents had a median prediction of two years and an expertise-weighted mean prediction of a little less than four years.\n\n\n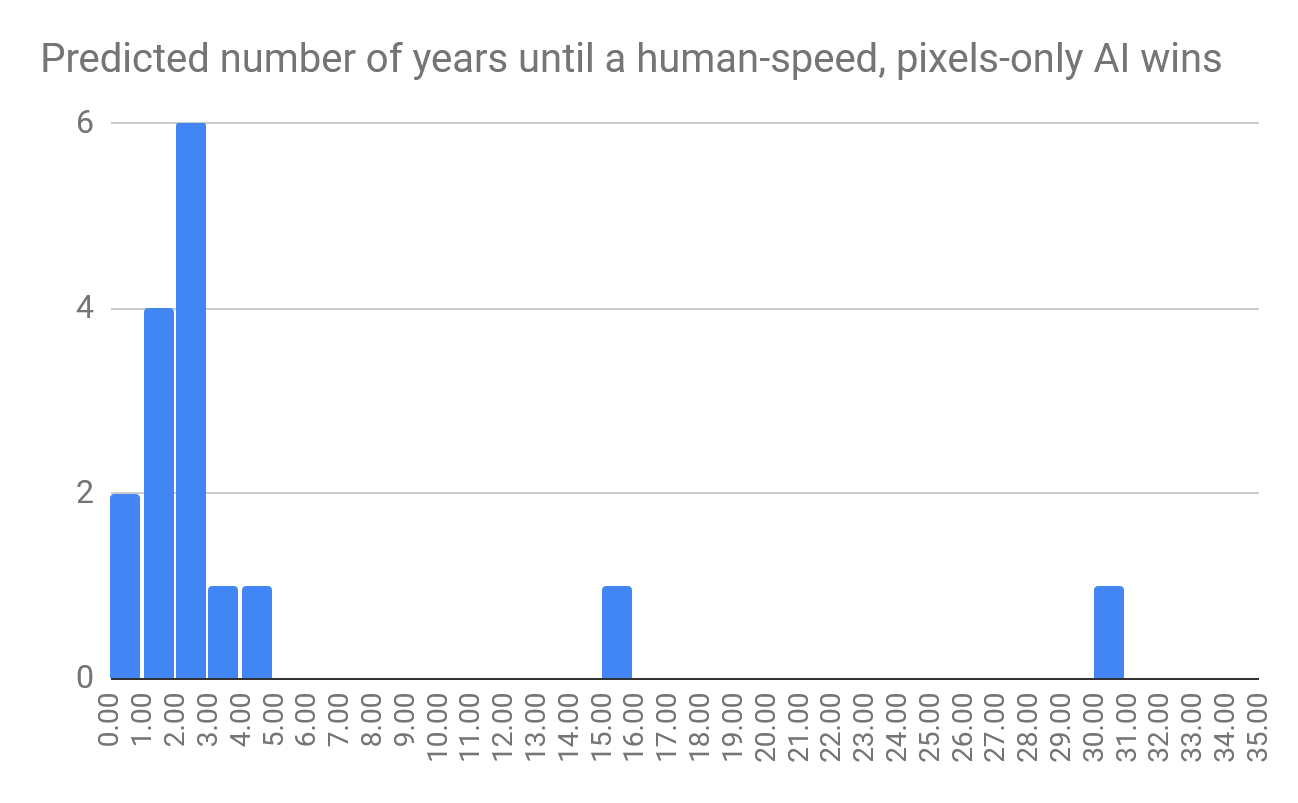\n### Questions About Relevant Considerations\n\n\n#### **How important do you think the following were in determining the outcome of the AlphaStar vs MaNa matches?**\n\n\nI listed 12 possible considerations to be rated in importance, from 1 to 5, with 1 being “not at all important” and 5 being “extremely important”. The expertise weighted mean for each question is given below: \n\n\n\n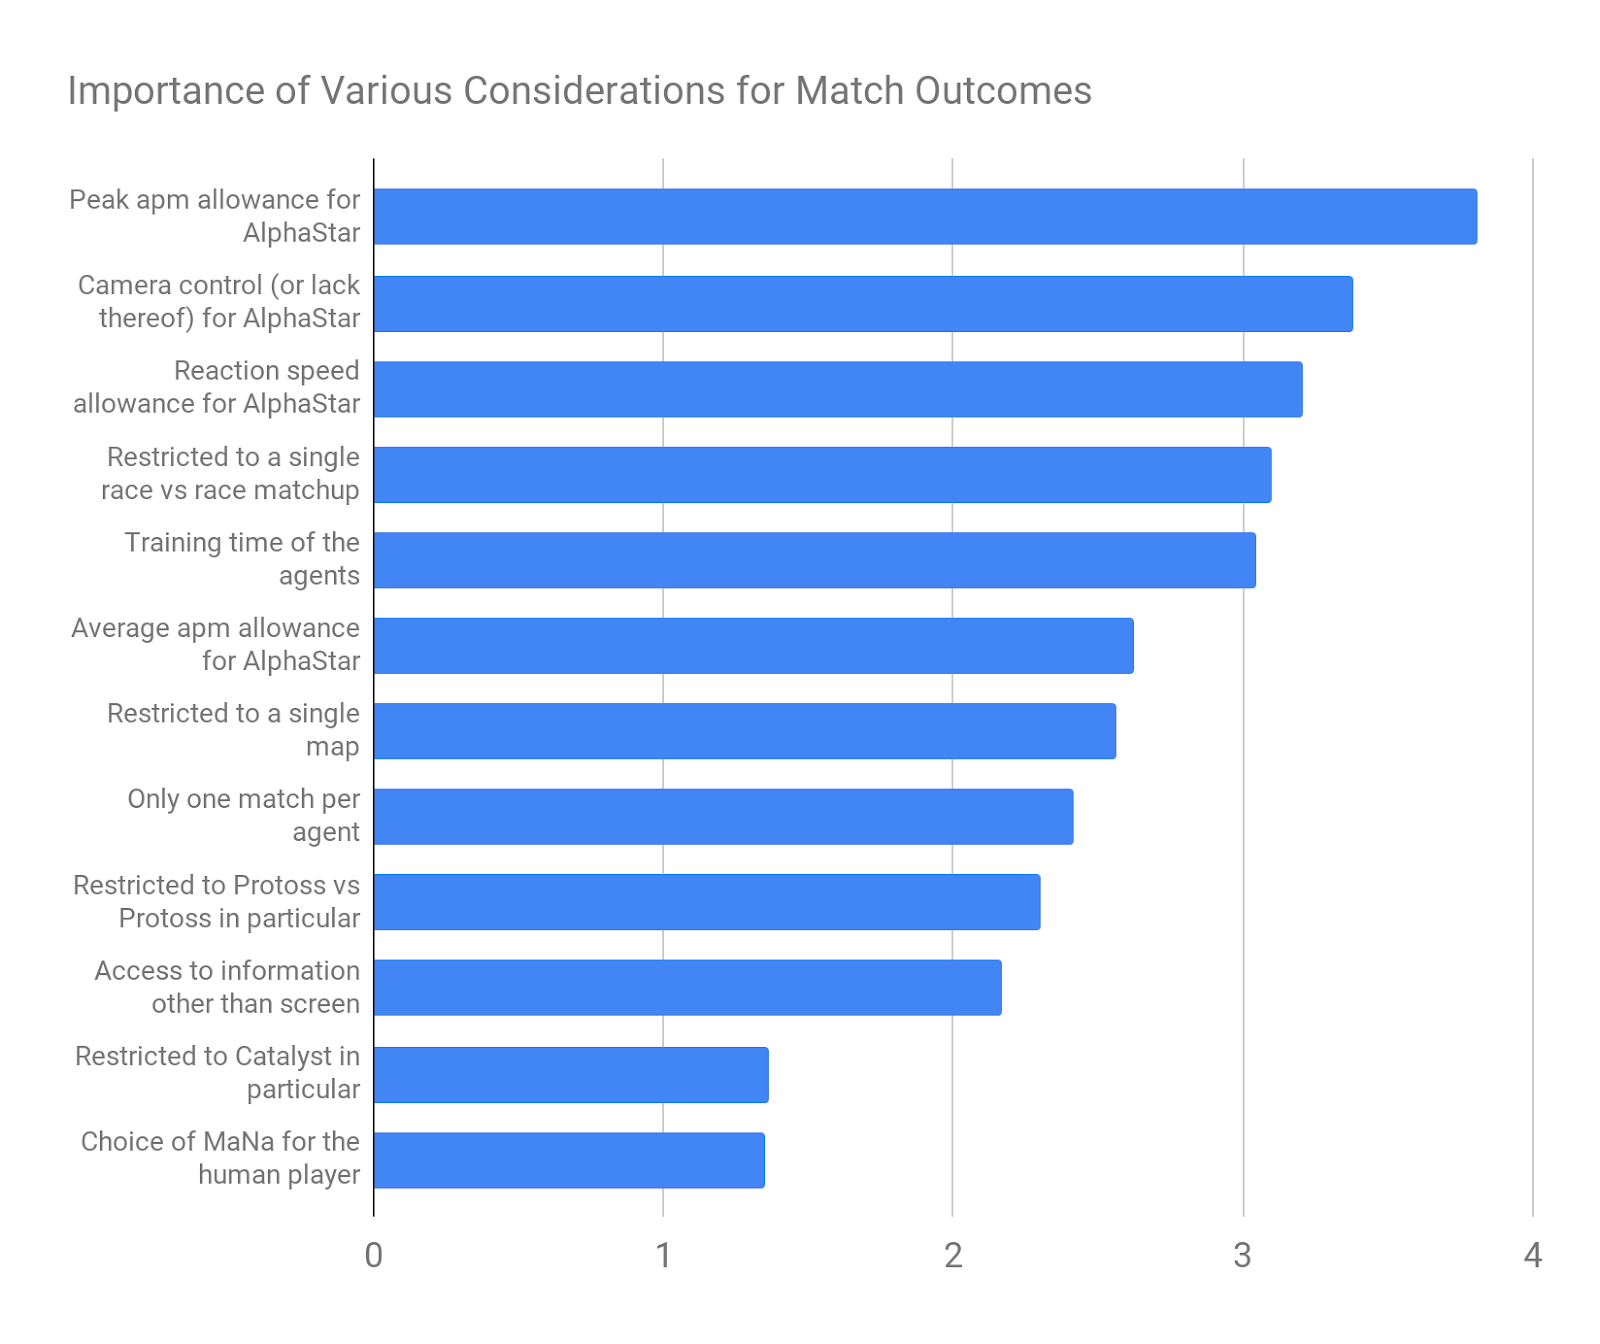\nRespondents rated AlphaStar’s peak APM and camera control as the two most important factors in determining the outcome of the matches, and the particular choice of map and professional player as the two least important considerations. \n\n\n\n#### **When thinking about AlphaStar as a benchmark for AI progress in general, how important do you think the following considerations are?**\n\n\nAgain, respondents rated a series of considerations by importance, this time for thinking about AlphaStar in a broader context. This included all of the considerations from the previous question, plus several others. Here are the results, again with expertise weighted averaging.\n\n\n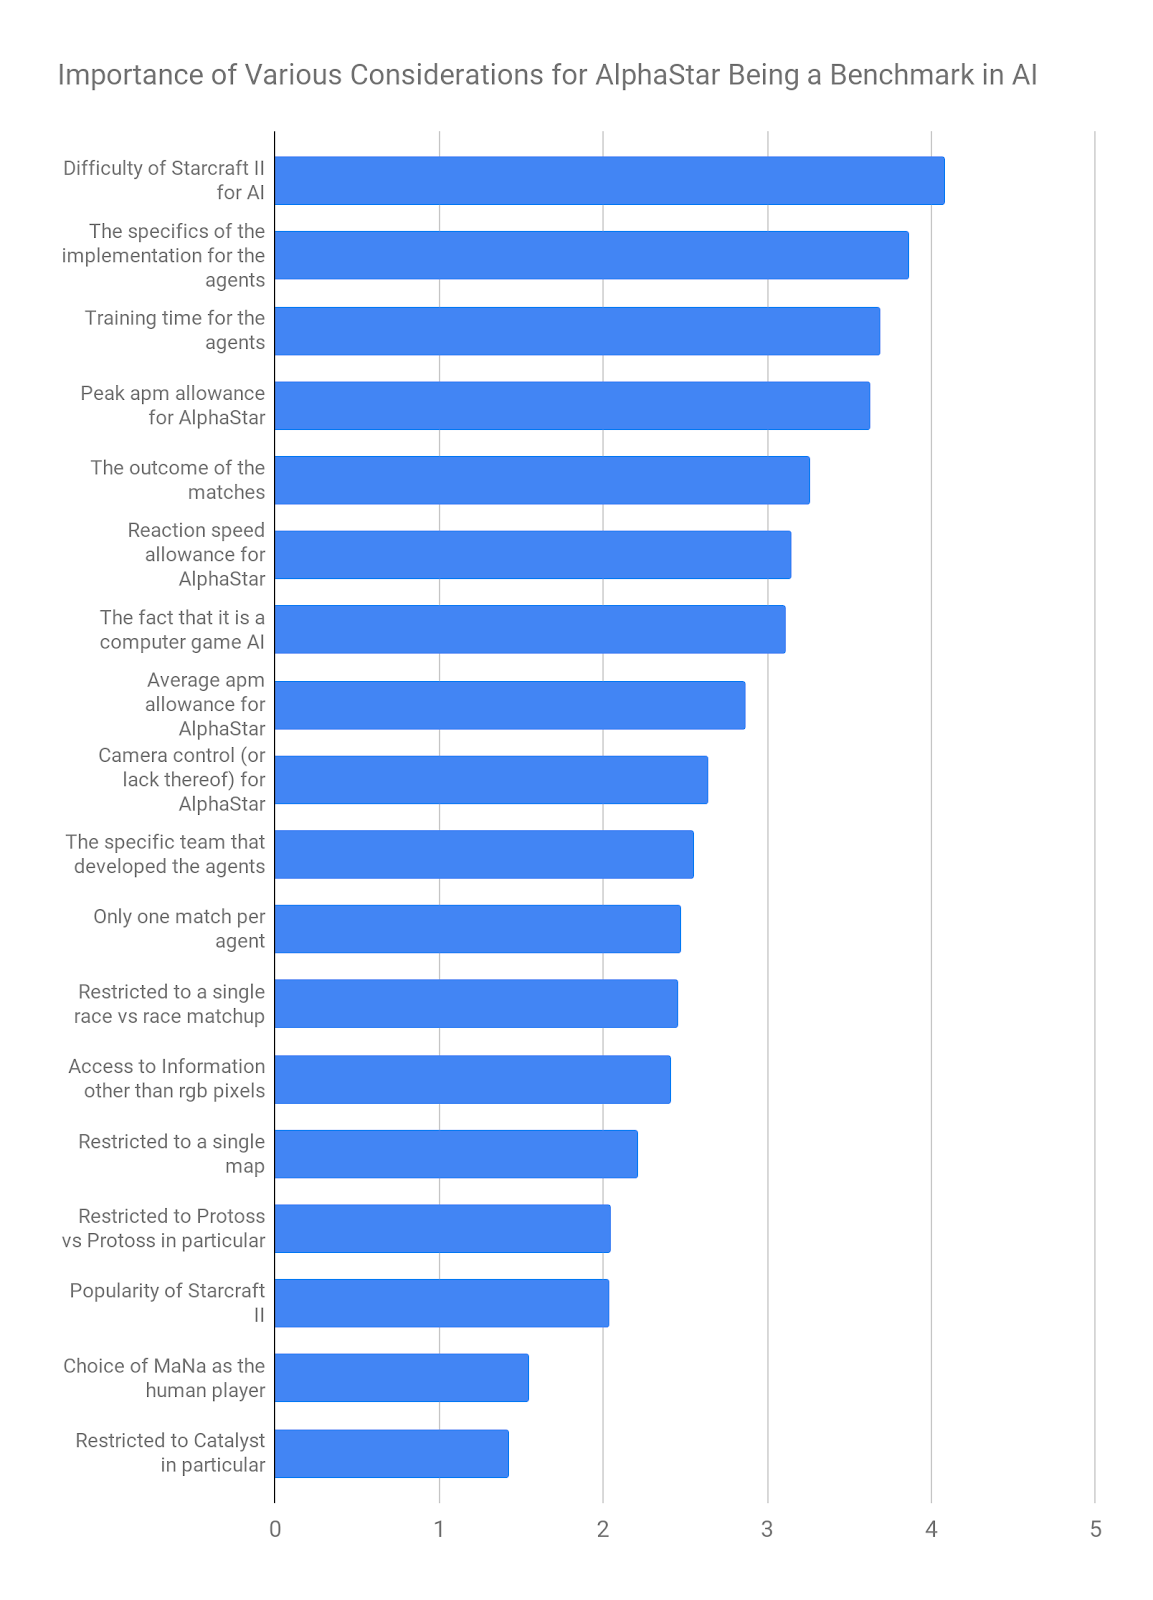\nFor these two sets of questions, there was almost no difference between the mean scores if I used only Starcraft II expertise weighting, only AI expertise weighting, or ignored expertise weighting entirely. \n\n\n\n### **Further questions**\n\n\nThe rest of the questions were free-form to give respondents a chance to tell me anything else that they thought was important. Although these answers were thoughtful and shaped my thinking about AlphaStar, especially early on in the project, I won’t summarize them here. \n\n\n\nAppendix II: APM Measurement Methodology\n----------------------------------------\n\n\nI created a list of professional players by asking users of the [Starcraft subreddit](https://www.reddit.com/r/starcraft/) which players they thought were exceptionally fast. Replays including these players were found by searching [Spawning Tool](https://lotv.spawningtool.com/replays/?pro_only=on) for replays from tournament matches which included at least one player from the list of fast players. This resulted in 51 replay files.\n\n\nSeveral of the replay files were too old, so that they could no longer be opened by the current version of Starcraft II, and I ignored them. Others were ignored because they included players, race matchups, or maps that were already represented in other matches. Some were ignored because we did not get to them before we had collected what seemed to be enough data. This left 15 replays that made it into the analysis.\n\n\nI opened each file using [Scelight](https://sites.google.com/site/scelight/), and the time and APM values were recorded for the top three peaks on the graph of that player’s APM, using 5-second bins. Next, I opened the replay file in Starcraft II, and for each peak recorded earlier, we wrote down whether that player was primarily engaging in combat at the time or not. Additionally, I recorded the time and APM for each player for 2-4 5-second durations of the game in which the players were primarily engaged in combat.\n\n\nAll of the APM values which came from combat and from outside of combat were aggregated into the histogram shown in the ‘Speed Controversy’ section of this article.\n\n\nThere are several potential sources of bias or error in this:\n\n\n1. Our method for choosing players and matches may be biased. We were seeking examples of humans playing with speed and precision, but it’s possible that by relying on input from a relatively small number of Reddit users (as well as some personal friends), we missed something.\n2. This measurement relies entirely on my subjective evaluation of whether the players are mostly engaged in combat. I am not an expert on the game, and it seems likely that I missed some things, at least some of the time.\n3. The tool I used for this seems to mismatch events in the game by a few seconds. Since I was using 5-second bins, and sometimes a player’s APM will change greatly between 5-second bins, it’s possible that this introduced a significant error.\n4. The choice of 5 second bins (as opposed to something shorter or longer) is somewhat arbitrary, but it is what some people in the Starcraft community were using, so I’m using it here.\n5. Some actions are excluded from the analysis automatically. These include camera updates, and this is probably a good thing, but I did not look carefully at the source code for the tool, so it may be doing something I don’t know about.\n\n\nFootnotes\n---------\n\n", "url": "https://aiimpacts.org/the-unexpected-difficulty-of-comparing-alphastar-to-humans/", "title": "The unexpected difficulty of comparing AlphaStar to humans", "source": "aiimpacts.org", "source_type": "wordpress", "date_published": "2019-09-18T02:11:55+00:00", "paged_url": "https://aiimpacts.org/feed?paged=11", "authors": ["richardkorzekwa"], "id": "738f477069df8c3cdcdfe975aeeb4c3b", "summary": []}
{"text": "Conversation with Paul Christiano\n\nAI Impacts talked to AI safety researcher Paul Christiano about his views on AI risk. With his permission, we have transcribed this interview.\n\n\n**Participants**\n----------------\n\n\n* [Paul Christiano](https://paulfchristiano.com/) — OpenAI safety team\n* Asya Bergal – AI Impacts\n* Ronny Fernandez – AI Impacts\n* [Robert Long](http://robertlong.online/) – AI Impacts\n\n\n**Summary**\n-----------\n\n\nWe spoke with Paul Christiano on August 13, 2019. Here is a brief summary of that conversation: \n\n\n\n* AI safety is worth working on because AI poses a large risk and AI safety is neglected, and tractable.\n* Christiano is more optimistic about the likely social consequences of advanced AI than some others in AI safety, in particular researchers at the Machine Intelligence Research Institute (MIRI), for the following reasons:\n\t+ The prior on any given problem reducing the expected value of the future by 10% should be low.\n\t+ There are several ‘saving throws’–ways in which, even if one thing turns out badly, something else can turn out well, such that AI is not catastrophic.\n\t+ Many algorithmic problems are either solvable within 100 years, or provably impossible; this inclines Christiano to think that AI safety problems are reasonably likely to be easy.\n\t+ MIRI thinks success is guaranteeing that unaligned intelligences are never created, whereas Christiano just wants to leave the next generation of intelligences in at least as good of a place as humans were when building them.\n\t+ ‘Prosaic AI’ that looks like current AI systems will be less hard to align than MIRI thinks:\n\t\t- Christiano thinks there’s at least a one-in-three chance that we’ll be able to solve AI safety on paper in advance.\n\t\t- A common view within ML is that that we’ll successfully solve problems as they come up.\n\t+ Christiano has relatively less confidence in several inside view arguments for high levels of risk:\n\t\t- Building safe AI requires hitting a small target in the space of programs, but building any AI also requires hitting a small target.\n\t\t- Because Christiano thinks that the state of evidence is less clear-cut than MIRI does, Christiano also has a higher probability that people will become more worried in the future.\n\t\t- Just because we haven’t solved many problems in AI safety yet doesn’t mean they’re intractably hard– many technical problems feel this way and then get solved in 10 years of effort.\n\t\t- Evolution is often used as an analogy to argue that general intelligence (humans with their own goals) becomes dangerously unaligned with the goals of the outer optimizer (evolution selecting for reproductive fitness). But this analogy doesn’t make Christiano feel so pessimistic, e.g. he thinks that if we tried, we could breed animals that are somewhat smarter than humans and are also friendly and docile.\n\t\t- Christiano is optimistic about verification, interpretability, and adversarial training for inner alignment, whereas MIRI is pessimistic.\n\t\t- MIRI thinks the outer alignment approaches Christiano proposes are just obscuring the core difficulties of alignment, while Christiano is not yet convinced there is a deep core difficulty.\n* Christiano thinks there are several things that could change his mind and optimism levels, including:\n\t+ Learning about institutions and observing how they solve problems analogous to AI safety.\n\t+ Seeing whether AIs become deceptive and how they respond to simple oversight.\n\t+ Seeing how much progress we make on AI alignment over the coming years.\n* Christiano is relatively optimistic about his iterated amplification approach:\n\t+ Christiano cares more about making aligned AIs that are competitive with unaligned AIs, whereas MIRI is more willing to settle for an AI with very narrow capabilities.\n\t+ Iterated amplification is largely based on learning-based AI systems, though it may work in other cases.\n\t+ Even if iterated amplification isn’t the answer to AI safety, it’s likely to have subproblems in common with problems that are important in the future.\n* There are still many disagreements between Christiano and the Machine Intelligence Research Institute (MIRI) that are messy and haven’t been made precise.\n\n\nThis transcript has been lightly edited for concision and clarity.\n\n\n Transcript\n-----------\n\n\n**Asya Bergal:** Okay. We are recording. I’m going to ask you a bunch of questions related to something like AI optimism. \n\n\n\nI guess the proposition that we’re looking at is something like ‘is it valuable for people to be spending significant effort doing work that purports to reduce the risk from advanced artificial intelligence’? The first question would be to give a short-ish version of the reasoning around that. \n\n\n\n**Paul Christiano:** Around why it’s overall valuable? \n\n\n\n**Asya Bergal:** Yeah. Or the extent to which you think it’s valuable. \n\n\n\n**Paul Christiano:** I don’t know, this seems complicated. I’m acting from some longtermerist perspective, I’m like, what can make the world irreversibly worse? There aren’t that many things, we go extinct. It’s hard to go extinct, doesn’t seem that likely. \n\n\n\n**Robert Long:** We keep forgetting to say this, but we are focusing less on ethical considerations that might affect that. We’ll grant…yeah, with all that in the background…. \n\n\n\n**Paul Christiano:** Granting long-termism, but then it seems like it depends a lot on what’s the probability? What fraction of our expected future do we lose by virtue of messing up alignment \\* what’s the elasticity of that to effort / how much effort? \n\n\n\n**Robert Long:** That’s the stuff we’re curious to see what people think about. \n\n\n\n**Asya Bergal**: I also just read your 80K interview, which I think probably covered like a lot of the reasoning about this. \n\n\n\n**Paul Christiano:** They probably did. I don’t remember exactly what’s in there, but it was a lot of words. \n\n\n\nI don’t know. I’m like, it’s a lot of doom probability. Like maybe I think AI alignment per se is like 10% doominess. That’s a lot. Then it seems like if we understood everything in advance really well, or just having a bunch of people working on now understanding what’s up, could easily reduce that by a big chunk. \n\n\n\n**Ronny Fernandez:** Sorry, what do you mean by 10% doominesss? \n\n\n\n**Paul Christiano:** I don’t know, the future is 10% worse than it would otherwise be in expectation by virtue of our failure to align AI. I made up 10%, it’s kind of a random number. I don’t know, it’s less than 50%. It’s more than 10% conditioned on AI soon I think. \n\n\n\n**Ronny Fernandez:** And that’s change in expected value. \n\n\n\n**Paul Christiano:** Yeah. Anyway, so 10% is a lot. Then I’m like, maybe if we sorted all our shit out and had a bunch of people who knew what was up, and had a good theoretical picture of what was up, and had more info available about whether it was a real problem. Maybe really nailing all that could cut that risk from 10% to 5% and maybe like, you know, there aren’t that many people who work on it, it seems like a marginal person can easily do a thousandth of that 5% change. Now you’re looking at one in 20,000 or something, which is a good deal. \n\n\n\n**Asya Bergal:** I think my impression is that that 10% is lower than some large set of people. I don’t know if other people agree with that. \n\n\n\n**Paul Christiano:** Certainly, 10% is lower than lots of people who care about AI risk. I mean it’s worth saying, that I have this slightly narrow conception of what is the alignment problem. I’m not including all AI risk in the 10%. I’m not including in some sense most of the things people normally worry about and just including the like ‘we tried to build an AI that was doing what we want but then it wasn’t even trying to do what we want’. I think it’s lower now or even after that caveat, than pessimistic people. It’s going to be lower than all the MIRI folks, it’s going to be higher than almost everyone in the world at large, especially after specializing in this problem, which is a problem almost no one cares about, which is precisely how a thousand full time people for 20 years can reduce the whole risk by half or something. \n\n\n\n**Asya Bergal:** I’m curious for your statement as to why you think your number is slightly lower than other people. \n\n\n\n**Paul Christiano:** Yeah, I don’t know if I have a particularly crisp answer. Seems like it’s a more reactive thing of like, what are the arguments that it’s very doomy? A priori you might’ve been like, well, if you’re going to build some AI, you’re probably going to build the AI so it’s trying to do what you want it to do. Probably that’s that. Plus, most things can’t destroy the expected value of the future by 10%. You just can’t have that many things, otherwise there’s not going to be any value left in the end. In particular, if you had 100 such things, then you’d be down to like 1/1000th of your values. 1/10 hundred thousandth? I don’t know, I’m not good at arithmetic. \n\n\n\nAnyway, that’s a priori, just aren’t that many things are that bad and it seems like people would try and make AI that’s trying to do what they want. Then you’re like, okay, we get to be pessimistic because of some other argument about like, well, we don’t currently know how to build an AI which will do what we want. We’re like, there’s some extrapolation of current techniques on which we’re concerned that we wouldn’t be able to. Or maybe some more conceptual or intuitive argument about why AI is a scary kind thing, and AIs tend to want to do random shit. \n\n\n\nThen like, I don’t know, now we get into, how strong is that argument for doominess? Then a major thing that drives it is I am like, reasonable chance there is no problem in fact. Reasonable chance, if there is a problem we can cope with it just by trying. Reasonable chance, even if it will be hard to cope with, we can sort shit out well enough on paper that we really nail it and understand how to resolve it. Reasonable chance, if we don’t solve it the people will just not build AIs that destroy everything they value. \n\n\n\nIt’s lots of saving throws, you know? And you multiply the saving throws together and things look better. And they interact better than that because– well, in one way worse because it’s correlated: If you’re incompetent, you’re more likely to fail to solve the problem and more likely to fail to coordinate not to destroy the world. In some other sense, it’s better than interacting multiplicatively because weakness in one area compensates for strength in the other. I think there are a bunch of saving throws that could independently make things good, but then in reality you have to have a little bit here and a little bit here and a little bit here, if that makes sense. We have some reasonable understanding on paper that makes the problem easier. The problem wasn’t that bad. We wing it reasonably well and we do a bunch of work and in fact people are just like, ‘Okay, we’re not going to destroy the world given the choice.’ I guess I have this somewhat distinctive last saving throw where I’m like, ‘Even if you have unaligned AI, it’s probably not that bad.’ \n\n\n\nThat doesn’t do much of the work, but you know you add a bunch of shit like that together. \n\n\n\n**Asya Bergal:** That’s a lot of probability mass on a lot of different things. I do feel like my impression is that, on the first step of whether by default things are likely to be okay or things are likely to be good, people make arguments of the form, ‘You have a thing with a goal and it’s so hard to specify. By default, you should assume that the space of possible goals to specify is big, and the one right goal is hard to specify, hard to find.’ Obviously, this is modeling the thing as an agent, which is already an assumption. \n\n\n\n**Paul Christiano:** Yeah. I mean it’s hard to run or have much confidence in arguments of that form. I think it’s possible to run tight versions of that argument that are suggestive. It’s hard to have much confidence in part because you’re like, look, the space of all programs is very broad, and the space that do your taxes is quite small, and we in fact are doing a lot of selecting from the vast space of programs to find one that does your taxes– so like, you’ve already done a lot of that. \n\n\n\nAnd then you have to be getting into more detailed arguments about exactly how hard is it to select. I think there’s two kinds of arguments you can make that are different, or which I separate. One is the inner alignment treacherous turney argument, where like, we can’t tell the difference between AIs that are doing the right and wrong thing, even if you know what’s right because blah blah blah. The other is well, you don’t have this test for ‘was it right’ and so you can’t be selecting for ‘does the right thing’. \n\n\n\nThis is a place where the concern is disjunctive, you have like two different things, they’re both sitting in your alignment problem. They can again interact badly. But like, I don’t know, I don’t think you’re going to get to high probabilities from this. I think I would kind of be at like, well I don’t know. Maybe I think it’s more likely than not that there’s a real problem but not like 90%, you know? Like maybe I’m like two to one that there exists a non-trivial problem or something like that. All of the numbers I’m going to give are very made up though. If you asked me a second time you’ll get all different numbers. \n\n\n\n**Asya Bergal:** That’s good to know. \n\n\n\n**Paul Christiano:** Sometimes I anchor on past things I’ve said though, unfortunately. \n\n\n\n**Asya Bergal:** Okay. Maybe I should give you some fake past Paul numbers. \n\n\n\n**Paul Christiano:** You could be like, ‘In that interview, you said that it was 85%’. I’d be like, ‘I think it’s really probably 82%’. \n\n\n\n**Asya Bergal:** I guess a related question is, is there plausible concrete evidence that you think could be gotten that would update you in one direction or the other significantly? \n\n\n\n**Paul Christiano:** Yeah. I mean certainly, evidence will roll in once we have more powerful AI systems. \n\n\n\nOne can learn… I don’t know very much about any of the relevant institutions, I may know a little bit. So you can imagine easily learning a bunch about them by observing how well they solve analogous problems or learning about their structure, or just learning better about the views of people. That’s the second category. \n\n\n\nWe’re going to learn a bunch of shit as we continue thinking about this problem on paper to see like, does it look like we’re going to solve it or not? That kind of thing. It seems like there’s lots of sorts of evidence on lots of fronts, my views are shifting all over the place. That said, the inconsistency between one day and the next is relatively large compared to the actual changes in views from one day to the next. \n\n\n\n**Robert Long:** Could you say a little bit more about evidence from once more advanced AI starts coming in? Like what sort things you’re looking for that would change your mind on things? \n\n\n\n**Paul Christiano:** Well you get to see things like, on inner alignment you get to see to what extent do you have the kind of crazy shit that people are concerned about? The first time you observe some crazy shit where your AI is like, ‘I’m going to be nice in order to assure that you think I’m nice so I can stab you in the back later.’ You’re like, ‘Well, I guess that really does happen despite modest effort to prevent it.’ That’s a thing you get. You get to learn in general about how models generalize, like to what extent they tend to do– this is sort of similar to what I just said, but maybe a little bit broader– to what extent are they doing crazy-ish stuff as they generalize? \n\n\n\nYou get to learn about how reasonable simple oversight is and to what extent do ML systems acquire knowledge that simple overseers don’t have that then get exploited as they optimize in order to produce outcomes that are actually bad. I don’t have a really concise description, but sort of like, to the extent that all these arguments depend on some empirical claims about AI, you get to see those claims tested increasingly. \n\n\n\n**Ronny Fernandez:** So the impression I get from talking to other people who know you, and from reading some of your blog posts, but mostly from others, is that you’re somewhat more optimistic than most people that work in AI alignment. It seems like some people who work on AI alignment think something like, ‘We’ve got to solve some really big problems that we don’t understand at all or there are a bunch of unknown unknowns that we need to figure out.’ Maybe that’s because they have a broader conception of what solving AI alignment is like than you do? \n\n\n\n**Paul Christiano:** That seems like it’s likely to be part of it. It does seem like I’m more optimistic than people in general, than people who work in alignment in general. I don’t really know… I don’t understand others’ views that well and I don’t know if they’re that– like, my views aren’t that internally coherent. My suspicion is others’ views are even less internally coherent. Yeah, a lot of it is going to be done by having a narrower conception of the problem. \n\n\n\nThen a lot of it is going to be done by me just being… in terms of do we need a lot of work to be done, a lot of it is going to be me being like, I don’t know man, maybe. I don’t really understand when people get off the like high probability of like, yeah. I don’t see the arguments that are like, definitely there’s a lot of crazy stuff to go down. It seems like we really just don’t know. I do also think problems tend to be easier. I have more of that prior, especially for problems that make sense on paper. I think they tend to either be kind of easy, or else– if they’re possible, they tend to be kind of easy. There aren’t that many really hard theorems. \n\n\n\n**Robert Long:** Can you say a little bit more of what you mean by that? That’s not a very good follow-up question, I don’t really know what it would take for me to understand what you mean by that better. \n\n\n\n**Paul Christiano:** Like most of the time, if I’m like, ‘here’s an algorithms problem’, you can like– if you just generate some random algorithms problems, a lot of them are going to be impossible. Then amongst the ones that are possible, a lot of them are going to be soluble in a year of effort and amongst the rest, a lot of them are going to be soluble in 10 or a hundred years of effort. It’s just kind of rare that you find a problem that’s soluble– by soluble, I don’t just mean soluble by human civilization, I mean like, they are not provably impossible– that takes a huge amount of effort. \n\n\n\nIt normally… it’s less likely to happen the cleaner the problem is. There just aren’t many very clean algorithmic problems where our society worked on it for 10 years and then we’re like, ‘Oh geez, this still seems really hard.’ Examples are kind of like… factoring is an example of a problem we’ve worked a really long time on. It kind of has the shape, and this is the tendency on these sorts of problems, where there’s just a whole bunch of solutions and we hack away and we’re a bit better and a bit better and a bit better. It’s a very messy landscape, rather than jumping from having no solution to having a solution. It’s even rarer to have things where going from no solution to some solution is really possible but incredibly hard. There were some examples. \n\n\n\n**Robert Long:** And you think that the problems we face are sufficiently similar? \n\n\n\n**Paul Christiano:** I mean, I think this is going more into the like, ‘I don’t know man’ but my what do I think when I say I don’t know man isn’t like, ‘Therefore, there’s an 80% chance that it’s going to be an incredibly difficult problem’ because that’s not what my prior is like. I’m like, reasonable chance it’s not that hard. Some chance it’s really hard. Probably more chance that– if it’s really hard, I think it’s more likely to be because all the clean statements of the problem are impossible. I think as statements get messier it becomes more plausible that it just takes a lot of effort. The more messy a thing is, the less likely it is to be impossible sometimes, but also the more likely it’s just a bunch of stuff you have to do. \n\n\n\n**Ronny Fernandez:** It seems like one disagreement that you have with MIRI folks is that you think prosaic AGI will be easier to align than they do. Does that perception seem right to you? \n\n\n\n**Paul Christiano:** I think so. I think they’re probably just like, ‘that seems probably impossible’. Was related to the previous point. \n\n\n\n**Ronny Fernandez:** If you had found out that prosaic AGI is nearly impossible to align or is impossible to align, how much would that change your- \n\n\n\n**Paul Christiano:** It depends exactly what you found out, exactly how you found it out, et cetera. One thing you could be told is that there’s no perfectly scalable mechanism where you can throw in your arbitrarily sophisticated AI and turn the crank and get out an arbitrarily sophisticated aligned AI. That’s a possible outcome. That’s not necessarily that damning because now you’re like okay, fine, you can almost do it basically all the time and whatever. \n\n\n\nThat’s a big class of worlds and that would definitely be a thing I would be interested in understanding– how large is that gap actually, if the nice problem was totally impossible? If at the other extreme you just told me, ‘Actually, nothing like this is at all going to work, and it’s definitely going to kill everyone if you build an AI using anything like an extrapolation of existing techniques’, then I’m like, ‘Sounds pretty bad.’ I’m still not as pessimistic as MIRI people. \n\n\n\nI’m like, maybe people just won’t destroy the world, you know, it’s hard to say. It’s hard to say what they’ll do. It also depends on the nature of how you came to know this thing. If you came to know it in a way that’s convincing to a reasonably broad group of people, that’s better than if you came to know it and your epistemic state was similar to– I think MIRI people feel more like, it’s already known to be hard, and therefore you can tell if you can’t convince people it’s hard. Whereas I’m like, I’m not yet convinced it’s hard, so I’m not so surprised that you can’t convince people it’s hard. \n\n\n\nThen there’s more probability, if it was known to be hard, that we can convince people, and therefore I’m optimistic about outcomes conditioned on knowing it to be hard. I might become almost as pessimistic as MIRI if I thought that the problem was insolubly hard, just going to take forever or whatever, huge gaps aligning prosaic AI, and there would be no better evidence of that than currently exists. Like there’s no way to explain it better to people than MIRI currently can. If you take those two things, I’m maybe getting closer to MIRI’s levels of doom probability. I might still not be quite as doomy as them. \n\n\n\n**Ronny Fernandez:** Why does the ability to explain it matter so much? \n\n\n\n**Paul Christiano:** Well, a big part of why you don’t expect people to build unaligned AI is they’re like, they don’t want to. The clearer it is and the stronger the case, the more people can potentially do something. In particular, you might get into a regime where you’re doing a bunch of shit by trial and error and trying to wing it. And if you have some really good argument that the winging it is not going to work, then that’s a very different state than if you’re like, ‘Well, winging it doesn’t seem that good. Maybe it’ll fail.’ It’s different to be like, ‘Oh no, here’s an argument. You just can’t… It’s just not going to work.’ \n\n\n\nI don’t think we’ll really be in that state, but there’s like a whole spectrum from where we’re at now to that state and I expect to be further along it, if in fact we’re doomed. For example, if I personally would be like, ‘Well, I at least tried the thing that seemed obvious to me to try and now we know that doesn’t work.’ I sort of expect very directly from trying that to learn something about why that failed and what parts of the problem seem difficult. \n\n\n\n**Ronny Fernandez:** Do you have a sense of why MIRI thinks aligning prosaic AI is so hard? \n\n\n\n**Paul Christiano:** We haven’t gotten a huge amount of traction on this when we’ve debated it. I think part of their position, especially on the winging it thing, is they’re like – Man, doing things right generally seems a lot harder than doing them. I guess probably building an AI will be harder in a way that’s good, for some arbitrary notion of good– a lot harder than just building an AI at all. \n\n\n\nThere’s a theme that comes up frequently trying to hash this out, and it’s not so much about a theoretical argument, it’s just like, look, the theoretical argument establishes that there’s something a little bit hard here. And once you have something a little bit hard and now you have some giant organization, people doing the random shit they’re going to do, and all that chaos, and like, getting things to work takes all these steps, and getting this harder thing to work is going to have some extra steps, and everyone’s going to be doing it. They’re more pessimistic based on those kinds of arguments. \n\n\n\nThat’s the thing that comes up a lot. I think probably most of the disagreement is still in the, you know, theoretically, how much– certainly we disagree about like, can this problem just be solved on paper in advance? Where I’m like, reasonable chance, you know? At least a third chance, they’ll just on paper be like, ‘We have nailed it.’ There’s really no tension, no additional engineering effort required. And they’re like, that’s like zero. I don’t know what they think it is. More than zero, but low. \n\n\n\n**Ronny Fernandez:** Do you guys think you’re talking about the same problem exactly? \n\n\n\n**Paul Christiano:** I think there we are probably. At that step we are. Just like, is your AI trying to destroy everything? Yes. No. The main place there’s some bleed over– the main thing that MIRI maybe considers in scope and I don’t is like, if you build an AI, it may someday have to build another AI. And what if the AI it builds wants to destroy everything? Is that our fault or is that the AI’s fault? And I’m more on like, that’s the AI’s fault. That’s not my job. MIRI’s maybe more like not distinguishing those super cleanly, but they would say that’s their job. The distinction is a little bit subtle in general, but- \n\n\n\n**Ronny Fernandez:** I guess I’m not sure why you cashed out in terms of fault. \n\n\n\n**Paul Christiano:** I think for me it’s mostly like: there’s a problem we can hope to resolve. I think there’s two big things. One is like, suppose you don’t resolve that problem. How likely is it that someone else will solve it? Saying it’s someone else’s fault is in part just saying like, ‘Look, there’s this other person who had a reasonable opportunity to solve it and it was a lot smarter than us.’ So the work we do is less likely to make the difference between it being soluble or not. Because there’s this other smarter person. \n\n\n\nAnd then the other thing is like, what should you be aiming for? To the extent there’s a clean problem here which one could hope to solve, or one should bite off as a chunk, what fits in conceptually the same problem versus what’s like– you know, an analogy I sometimes make is, if you build an AI that’s doing important stuff, it might mess up in all sorts of ways. But when you’re asking, ‘Is my AI going to mess up when building a nuclear reactor?’ It’s a thing worth reasoning about as an AI person, but also like it’s worth splitting into like– part of that’s an AI problem, and part of that’s a problem about understanding managing nuclear waste. Part of that should be done by people reasoning about nuclear waste and part of it should be done by people reasoning about AI. \n\n\n\nThis is a little subtle because both of the problems have to do with AI. I would say my relationship with that is similar to like, suppose you told me that some future point, some smart people might make an AI. There’s just a meta and object level on which you could hope to help with the problem. \n\n\n\nI’m hoping to help with the problem on the object level in the sense that we are going to do research which helps people align AI, and in particular, will help the future AI align the next AI. Because it’s like people. It’s at that level, rather than being like, ‘We’re going to construct a constitution of that AI such that when it builds future AI it will always definitely work’. This is related to like– there’s this old argument about recursive self-improvement. It’s historically figured a lot in people’s discussion of why the problem is hard, but on a naive perspective it’s not obvious why it should, because you do only a small number of large modifications before your systems are sufficiently intelligent relative to you that it seems like your work should be obsolete. Plus like, them having a bunch of detailed knowledge on the ground about what’s going down. \n\n\n\nIt seems unclear to me how– yeah, this is related to our disagreement– how much you’re happy just deferring to the future people and being like, ‘Hope that they’ll cope’. Maybe they won’t even cope by solving the problem in the same way, they might cope by, the crazy AIs that we built reach the kind of agreement that allows them to not build even crazier AIs in the same way that we might do that. I think there’s some general frame of, I’m just taking responsibility for less, and more saying, can we leave the future people in a situation that is roughly as good as our situation? And by future people, I mean mostly AIs. \n\n\n\n**Ronny Fernandez:** Right. The two things that you think might explain your relative optimism are something like: Maybe we can get the problem to smarter agents that are humans. Maybe we can leave the problem to smarter agents that are not humans. \n\n\n\n**Paul Christiano:** Also a lot of disagreement about the problem. Those are certainly two drivers. They’re not exhaustive in the sense that there’s also a huge amount of disagreement about like, ‘How hard is this problem?’ Which is some combination of like, ‘How much do we know about it?’ Where they’re more like, ‘Yeah, we’ve thought about it a bunch and have some views.’ And I’m like, ‘I don’t know, I don’t think I really know shit.’ Then part of it is concretely there’s a bunch of– on the object level, there’s a bunch of arguments about why it would be hard or easy so we don’t reach agreement. We consistently disagree on lots of those points. \n\n\n\n**Ronny Fernandez:** Do you think the goal state for you guys is the same though? If I gave you guys a bunch of AGIs, would you guys agree about which ones are aligned and which ones are not? If you could know all of their behaviors? \n\n\n\n**Paul Christiano:** I think at that level we’d probably agree. We don’t agree more broadly about what constitutes a win state or something. They have this more expansive conception– or I guess it’s narrower– that the win state is supposed to do more. They are imagining more that you’ve resolved this whole list of future challenges. I’m more not counting that. \n\n\n\nWe’ve had this… yeah, I guess I now mostly use intent alignment to refer to this problem where there’s risk of ambiguity… the problem that I used to call AI alignment. There was a long obnoxious back and forth about what the alignment problem should be called. MIRI does use aligned AI to be like, ‘an AI that produces good outcomes when you run it’. Which I really object to as a definition of aligned AI a lot. So if they’re using that as their definition of aligned AI, we would probably disagree. \n\n\n\n**Ronny Fernandez:** Shifting terms or whatever… one thing that they’re trying to work on is making an AGI that has a property that is also the property you’re trying to make sure that AGI has. \n\n\n\n**Paul Christiano:** Yeah, we’re all trying to build an AI that’s trying to do the right thing. \n\n\n\n**Ronny Fernandez:** I guess I’m thinking more specifically, for instance, I’ve heard people at MIRI say something like, they want to build an AGI that I can tell it, ‘Hey, figure out how to copy a strawberry, and don’t mess anything else up too badly.’ Does that seem like the same problem that you’re working on? \n\n\n\n**Paul Christiano:** I mean it seems like in particular, you should be able to do that. I think it’s not clear whether that captures all the complexity of the problem. That’s just sort of a question about what solutions end up looking like, whether that turns out to have the same difficulty. \n\n\n\nThe other things you might think are involved that are difficult are… well, I guess one problem is just how you capture competitiveness. Competitiveness for me is a key desideratum. And it’s maybe easy to elide in that setting, because it just makes a strawberry. Whereas I am like, if you make a strawberry literally as well as anyone else can make a strawberry, it’s just a little weird to talk about. And it’s a little weird to even formalize what competitiveness means in that setting. I think you probably can, but whether or not you do that’s not the most natural or salient aspect of the situation. \n\n\n\nSo I probably disagree with them about– I’m like, there are probably lots of ways to have agents that make strawberries and are very smart. That’s just another disagreement that’s another function of the same basic, ’How hard is the problem’ disagreement. I would guess relative to me, in part because of being more pessimistic about the problem, MIRI is more willing to settle for an AI that does one thing. And I care more about competitiveness. \n\n\n\n**Asya Bergal:** Say you just learn that prosaic AI is just not going to be the way we get to AGI. How does that make you feel about the IDA approach versus the MIRI approach? \n\n\n\n**Paul Christiano:** So my overall stance when I think about alignment is, there’s a bunch of possible algorithms that you could use. And the game is understanding how to align those algorithms. And it’s kind of a different game. There’s a lot of common subproblems in between different algorithms you might want to align, it’s potentially a different game for different algorithms. That’s an important part of the answer. I’m mostly focusing on the ‘align this particular’– I’ll call it learning, but it’s a little bit more specific than learning– where you search over policies to find a policy that works well in practice. If we’re not doing that, then maybe that solution is totally useless, maybe it has common subproblems with the solution you actually need. That’s one part of the answer. \n\n\n\nAnother big difference is going to be, timelines views will shift a lot if you’re handed that information. So it will depend exactly on the nature of the update. I don’t have a strong view about whether it makes my timelines shorter or longer overall. Maybe you should bracket that though. \n\n\n\nIn terms of returning to the first one of trying to align particular algorithms, I don’t know. I think I probably share some of the MIRI persp– well, no. It feels to me like there’s a lot of common subproblems. Aligning expert systems seems like it would involve a lot of the same reasoning as aligning learners. To the extent that’s true, probably future stuff also will involve a lot of the same subproblems, but I doubt the algorithm will look the same. I also doubt the actual algorithm will look anything like a particular pseudocode we might write down for iterated amplification now. \n\n\n\n**Asya Bergal:** Does iterated amplification in your mind rely on this thing that searches through policies for the best policy? The way I understand it, it doesn’t feel like it necessarily does. \n\n\n\n**Paul Christiano:** So, you use this distillation step. And the reason you want to do amplification, or this short-hop, expensive amplification, is because you interleave it with this distillation step. And I normally imagine the distillation step as being, learn a thing which works well in practice on a reward function defined by the overseer. You could imagine other things that also needed to have this framework, but it’s not obvious whether you need this step if you didn’t somehow get granted something like the– \n\n\n\n**Asya Bergal:** That you could do the distillation step somehow. \n\n\n\n**Paul Christiano:** Yeah. It’s unclear what else would– so another example of a thing that could fit in, and this maybe makes it seem more general, is if you had an agent that was just incentivized to make lots of money. Then you could just have your distillation step be like, ‘I randomly check the work of this person, and compensate them based on the work I checked’. That’s a suggestion of how this framework could end up being more general. \n\n\n\nBut I mostly do think about it in the context of learning in particular. I think it’s relatively likely to change if you’re not in that setting. Well, I don’t know. I don’t have a strong view. I’m mostly just working in that setting, mostly because it seems reasonably likely, seems reasonably likely to have a bunch in common, learning is reasonably likely to appear even if other techniques appear. That is, learning is likely to play a part in powerful AI even if other techniques also play a part. \n\n\n\n**Asya Bergal:** Are there other people or resources that you think would be good for us to look at if we were looking at the optimism view? \n\n\n\n**Paul Christiano:** Before we get to resources or people, I think one of the basic questions is, there’s this perspective which is fairly common in ML, which is like, ‘We’re kind of just going to do a bunch of stuff, and it’ll probably work out’. That’s probably the basic thing to be getting at. How right is that? \n\n\n\nThis is the bad view of safety conditioned on– I feel like prosaic AI is in some sense the worst– seems like about as bad as things would have gotten in terms of alignment. Where, I don’t know, you try a bunch of shit, just a ton of stuff, a ton of trial and error seems pretty bad. Anyway, this is a random aside maybe more related to the previous point. But yeah, this is just with alignment. There’s this view in ML that’s relatively common that’s like, we’ll try a bunch of stuff to get the AI to do what we want, it’ll probably work out. Some problems will come up. We’ll probably solve them. I think that’s probably the most important thing in the optimism vs pessimism side. \n\n\n\nAnd I don’t know, I mean this has been a project that like, it’s a hard project. I think the current state of affairs is like, the MIRI folk have strong intuitions about things being hard. Essentially no one in… very few people in ML agree with those, or even understand where they’re coming from. And even people in the EA community who have tried a bunch to understand where they’re coming from mostly don’t. Mostly people either end up understanding one side or the other and don’t really feel like they’re able to connect everything. So it’s an intimidating project in that sense. I think the MIRI people are the main proponents of the everything is doomed, the people to talk to on that side. And then in some sense there’s a lot of people on the other side who you can talk to, and the question is just, who can articulate the view most clearly? Or who has most engaged with the MIRI view such that they can speak to it? \n\n\n\n**Ronny Fernandez:** Those are people I would be particularly interested in. If there are people that understand all the MIRI arguments but still have broadly the perspective you’re describing, like some problems will come up, probably we’ll fix them. \n\n\n\n**Paul Christiano:** I don’t know good– I don’t have good examples of people for you. I think most people just find the MIRI view kind of incomprehensible, or like, it’s a really complicated thing, even if the MIRI view makes sense in its face. I don’t think people have gotten enough into the weeds. It really rests a lot right now on this fairly complicated cluster of intuitions. I guess on the object level, I think I’ve just engaged a lot more with the MIRI view than most people who are– who mostly take the ‘everything will be okay’ perspective. So happy to talk on the object level, and speaking more to arguments. I think it’s a hard thing to get into, but it’s going to be even harder to find other people in ML who have engaged with the view that much. \n\n\n\nThey might be able to make other general criticisms of like, here’s why I haven’t really… like it doesn’t seem like a promising kind of view to think about. I think you could find more people who have engaged at that level. I don’t know who I would recommend exactly, but I could think about it. Probably a big question will be who is excited to talk to you about it. \n\n\n\n**Asya Bergal:** I am curious about your response to MIRI’s object level arguments. Is there a place that exists somewhere? \n\n\n\n**Paul Christiano:** There’s some back and forth on the internet. I don’t know if it’s great. There’s some LessWrong posts. Eliezer for example wrote [this post](https://www.lesswrong.com/posts/S7csET9CgBtpi7sCh/challenges-to-christiano-s-capability-amplification-proposal) about why things were doomed, why I in particular was doomed. I don’t know if you read that post. \n\n\n\n**Asya Bergal:** I can also ask you about it now, I just don’t want to take too much of your time if it’s a huge body of things. \n\n\n\n**Paul Christiano:** The basic argument would be like, 1) On paper I don’t think we yet have a good reason to feel doomy. And I think there’s some basic research intuition about how much a problem– suppose you poke at a problem a few times, and you’re like ‘Agh, seems hard to make progress’. How much do you infer that the problem’s really hard? And I’m like, not much. As a person who’s poked at a bunch of problems, let me tell you, that often doesn’t work and then you solve in like 10 years of effort. \n\n\n\nSo that’s one thing. That’s a point where I have relatively little sympathy for the MIRI way. That’s one set of arguments: is there a good way to get traction on this problem? Are there clever algorithms? I’m like, I don’t know, I don’t feel like the kind of evidence we’ve seen is the kind of evidence that should be persuasive. As some evidence in that direction, I’d be like, I have not been thinking about this that long. I feel like there have often been things that felt like, or that MIRI would have defended as like, here’s a hard obstruction. Then you think about it and you’re actually like, ‘Here are some things you can do.’ And it may still be a obstruction, but it’s no longer quite so obvious where it is, and there were avenues of attack. \n\n\n\nThat’s one thing. The second thing is like, a metaphor that makes me feel good– MIRI talks a lot about the evolution analogy. If I imagine the evolution problem– so if I’m a person, and I’m breeding some animals, I’m breeding some superintelligence. Suppose I wanted to breed an animal modestly smarter than humans that is really docile and friendly. I’m like, I don’t know man, that seems like it might work. That’s where I’m at. I think they are… it’s been a little bit hard to track down this disagreement, and I think this is maybe in a fresher, rawer state than the other stuff, where we haven’t had enough back and forth. \n\n\n\nBut I’m like, it doesn’t sound necessarily that hard. I just don’t know. I think their position, their position when they’ve written something has been a little bit more like, ‘But you couldn’t breed a thing, that after undergoing radical changes in intelligence or situation would remain friendly’. But then I’m normally like, but it’s not clear why that’s needed? I would really just like to create something slightly superhuman, and it’s going to work with me to breed something that’s slightly smarter still that is friendly. \n\n\n\nWe haven’t really been able to get traction on that. I think they have an intuition that maybe there’s some kind of invariance and things become gradually more unraveled as you go on. Whereas I have more intuition that it’s plausible. After this generation, there’s just smarter and smarter people thinking about how to keep everything on the rails. It’s very hard to know. \n\n\n\nThat’s the second thing. I have found that really… that feels like it gets to the heart of some intuitions that are very different, and I don’t understand what’s up there. There’s a third category which is like, on the object level, there’s a lot of directions that I’m enthusiastic about where they’re like, ‘That seems obviously doomed’. So you could divide those up into the two problems. There’s the family of problems that are more like the inner alignment problem, and then outer alignment stuff. \n\n\n\nOn the inner alignment stuff, I haven’t thought that much about it, but examples of things that I’m optimistic about that they’re super pessimistic about are like, stuff that looks more like verification, or maybe stepping back even for that, there’s this basic paradigm of adversarial training, where I’m like, it seems close to working. And you could imagine it being like, it’s just a research problem to fill in the gaps. Whereas they’re like, that’s so not the kind of thing that would work. I don’t really know where we’re at with that. I do see there are formal obstructions to adversarial training in particular working. I’m like, I see why this is not yet a solution. For example, you can have this case where there’s a predicate that the model checks, and it’s easy to check but hard to construct examples. And then in your adversarial training you can’t ever feed an example where it’ll fail. So we get into like, is it plausible that you can handle that problem with either 1) Doing something more like verification, where you say, you ask them not to perform well on real inputs but on pseudo inputs. Or like, you ask the attacker just to show how it’s conceivable that the model could do a bad thing in some sense. \n\n\n\nThat’s one possible approach, where the other would be something more like interpretability, where you say like, ‘Here’s what the model is doing. In addition to it’s behavior we get this other signal that the paper was depending on this fact, its predicate paths, which it shouldn’t have been dependent on.’ The question is, can either of those yield good behavior? I’m like, I don’t know, man. It seems plausible. And they’re like ‘Definitely not.’ And I’m like, ‘Why definitely not?’ And they’re like ‘Well, that’s not getting at the real essence of the problem.’ And I’m like ‘Okay, great, but how did you substantiate this notion of the real essence of the problem? Where is that coming from? Is that coming from a whole bunch of other solutions that look plausible that failed?’ And their take is kind of like, yes, and I’m like, ‘But none of those– there weren’t actually even any candidate solutions there really that failed yet. You’ve got maybe one thing, or like, you showed there exists a problem in some minimal sense.’ This comes back to the first of the three things I listed. But it’s a little bit different in that I think you can just stare at particular things and they’ll be like, ‘Here’s how that particular thing is going to fail.’ And I’m like ‘I don’t know, it seems plausible.’ \n\n\n\nThat’s on inner alignment. And there’s maybe some on outer alignment. I feel like they’ve given a lot of ground in the last four years on how doomy things seem on outer alignment. I think they still have some– if we’re talking about amplification, I think the position would still be, ‘Man, why would that agent be aligned? It doesn’t at all seem like it would be aligned.’ That has also been a little bit surprisingly tricky to make progress on. I think it’s similar, where I’m like, yeah, I grant the existence of some problem or some thing which needs to be established, but I don’t grant– I think their position would be like, this hasn’t made progress or just like, pushed around the core difficulty. I’m like, I don’t grant the conception of the core difficulty in which this has just pushed around the core difficulty. I think that… substantially in that kind of thing, being like, here’s an approach that seems plausible, we don’t have a clear obstruction but I think that it is doomed for these deep reasons. I have maybe a higher bar for what kind of support the deep reasons need. \n\n\n\nI also just think on the merits, they have not really engaged with– and this is partly my responsibility for not having articulated the arguments in a clear enough way– although I think they have not engaged with even the clearest articulation as of two years ago of what the hope was. But that’s probably on me for not having an even clearer articulation than that, and also definitely not up to them to engage with anything. To the extent it’s a moving target, not up to them to engage with the most recent version. Where, most recent version– the proposal doesn’t really change that much, or like, the case for optimism has changed a little bit. But it’s mostly just like, the state of argument concerning it, rather than the version of the scheme.\n\n", "url": "https://aiimpacts.org/conversation-with-paul-christiano/", "title": "Conversation with Paul Christiano", "source": "aiimpacts.org", "source_type": "wordpress", "date_published": "2019-09-11T23:05:12+00:00", "paged_url": "https://aiimpacts.org/feed?paged=11", "authors": ["Asya Bergal"], "id": "4ef583f94a8032528bc8cd58e0ade6e2", "summary": ["There can't be too many things that reduce the expected value of the future by 10%; if there were, there would be no expected value left. So, the prior that any particular thing has such an impact should be quite low. With AI in particular, obviously we're going to try to make AI systems that do what we want them to do. So starting from this position of optimism, we can then evaluate the arguments for doom. The two main arguments: first, we can't distinguish ahead of time between AIs that are trying to do the right thing, and AIs that are trying to kill us, because the latter will behave nicely until they can execute a treacherous turn. Second, since we don't have a crisp concept of \"doing the right thing\", we can't select AI systems on whether they are doing the right thing.\n\nHowever, there are many \"saving throws\", or ways that the argument could break down, avoiding doom. Perhaps there's no problem at all, or perhaps we can cope with it with a little bit of effort, or perhaps we can coordinate to not build AIs that destroy value. Paul assigns a decent amount of probability to each of these (and other) saving throws, and any one of them suffices to avoid doom. This leads Paul to estimate that AI risk reduces the expected value of the future by roughly 10%, a relatively optimistic number. Since it is so neglected, concerted effort by longtermists could reduce it to 5%, making it still a very valuable area for impact. The main way he expects to change his mind is from evidence from more powerful AI systems, e.g. as we build more powerful AI systems, perhaps inner optimizer concerns will materialize and we'll see examples where an AI system executes a non-catastrophic treacherous turn.\n\nPaul also believes that clean algorithmic problems are usually solvable in 10 years, or provably impossible, and early failures to solve a problem don't provide much evidence of the difficulty of the problem (unless they generate proofs of impossibility). So, the fact that we don't know how to solve alignment now doesn't provide very strong evidence that the problem is impossible. Even if the clean versions of the problem were impossible, that would suggest that the problem is much more messy, which requires more concerted effort to solve but also tends to be just a long list of relatively easy tasks to do. (In contrast, MIRI thinks that prosaic AGI alignment is probably impossible.)\n\nNote that even finding out that the problem is impossible can help; it makes it more likely that we can all coordinate to not build dangerous AI systems, since no one _wants_ to build an unaligned AI system. Paul thinks that right now the case for AI risk is not very compelling, and so people don't care much about it, but if we could generate more compelling arguments, then they would take it more seriously. If instead you think that the case is already compelling (as MIRI does), then you would be correspondingly more pessimistic about others taking the arguments seriously and coordinating to avoid building unaligned AI.\n\nOne potential reason MIRI is more doomy is that they take a somewhat broader view of AI safety: in particular, in addition to building an AI that is trying to do what you want it to do, they would also like to ensure that when the AI builds successors, it does so well. In contrast, Paul simply wants to leave the next generation of AI systems in at least as good a situation as we find ourselves in now, since they will be both better informed and more intelligent than we are. MIRI has also previously defined aligned AI as one that produces good outcomes when run, which is a much broader conception of the problem than Paul has. But probably the main disagreement between MIRI and ML researchers and that ML researchers expect that we'll try a bunch of stuff, and something will work out, whereas MIRI expects that the problem is really hard, such that trial and error will only get you solutions that _appear_ to work."]}
{"text": "Paul Christiano on the safety of future AI systems\n\n*By Asya Bergal, 11 September 2019*\n\n\n[](http://aiimpacts.org/wp-content/uploads/2019/09/paulchristiano.jpeg)Paul Christiano\nAs part of our AI optimism project, we talked to Paul Christiano about why he is relatively hopeful about the arrival of advanced AI going well. Paul Christiano works on AI alignment on the safety team at [OpenAI](https://openai.com/). He is also a research associate at [FHI](https://www.fhi.ox.ac.uk/), a board member at [Ought](https://ought.org/), and a recent graduate of the [theory group at UC Berkeley](http://theory.cs.berkeley.edu/).\n\n\n\nPaul gave us a number of key disagreements he has with researchers at the Machine Intelligence Research Institute (MIRI), including:\n\n\n* Paul thinks there isn’t good evidence now to justify a confident pessimistic position on AI, so the fact that people aren’t worried doesn’t mean they won’t be worried when we’re closer to human-level intelligence.\n* Paul thinks that many algorithmic or theoretical problems are either solvable within 100 years or provably impossible.\n* Paul thinks not having solved many AI safety problems yet shouldn’t give us much evidence about their difficulty.\n* Paul’s criterion for alignment success isn’t ensuring that all future intelligences are aligned, it’s leaving the next generation of intelligences in at least as good of a place as humans were when building them.\n* Paul doesn’t think that the evolution analogy suggests that we are doomed in our attempts to align smarter AIs; e.g. if we tried, it seems likely that we could breed animals that are slightly smarter than humans and are also friendly and docile.\n* Paul cares about trying to build aligned AIs that are competitive with unaligned AIs, whereas MIRI is going for a less ambitious goal of building a narrow aligned AI without destroying the world.\n* Unlike MIRI, Paul is relatively optimistic about verification and interpretability for the inner alignment of AI systems.\n\n\nPaul also talked about evidence that might change his views; in particular, observing whether future AIs become deceptive and how they respond to simple oversight. He also described how research into the AI alignment approach he’s working on now, iterated distillation and amplification (IDA), is likely to be useful even if human-level intelligences don’t look like the AI systems we have today.\n\n\nA full transcript of our conversation, lightly edited for concision and clarity, can be found [here](https://aiimpacts.org/conversation-with-paul-christiano/).\n\n", "url": "https://aiimpacts.org/paul-christiano-on/", "title": "Paul Christiano on the safety of future AI systems", "source": "aiimpacts.org", "source_type": "wordpress", "date_published": "2019-09-11T21:40:03+00:00", "paged_url": "https://aiimpacts.org/feed?paged=11", "authors": ["Asya Bergal"], "id": "fbcc6456009717a6394845f95517ee9a", "summary": []}
{"text": "Soft takeoff can still lead to decisive strategic advantage\n\n*By Daniel Kokotajlo, 11 September 2019*\n\n\n*Crossposted from the*[*AI Alignment Forum*](https://alignmentforum.org/posts/PKy8NuNPknenkDY74/soft-takeoff-can-still-lead-to-decisive-strategic-advantage)*. May contain more technical jargon than usual.*\n\n\n*[Epistemic status: Argument by analogy to historical cases. Best case scenario it’s just one argument among many. Edit: Also, thanks to feedback from others, especially Paul, I intend to write a significantly improved version of this post in the next two weeks.]*\n\n\nI have on several occasions heard people say things like this:\n\n\n\n> \n> The original Bostrom/Yudkowsky paradigm envisioned a single AI built by a single AI project, undergoing intelligence explosion all by itself and attaining a decisive strategic advantage as a result. However, this is very unrealistic. Discontinuous jumps in technological capability are very rare, and it is very implausible that one project could produce more innovations than the rest of the world combined. Instead we should expect something more like the Industrial Revolution: Continuous growth, spread among many projects and factions, shared via a combination of trade and technology stealing. We should not expect any one project or AI to attain a decisive strategic advantage, because there will always be other projects and other AI that are only slightly less powerful, and coalitions will act to counterbalance the technological advantage of the frontrunner. (paraphrased)\n> \n> \n> \n\n\nProponents of this view often cite [Paul Christiano](https://www.greaterwrong.com/posts/HBxe6wdjxK239zajf/more-realistic-tales-of-doom) in support. Last week I heard him say he thinks the future will be “like the Industrial Revolution but 10x-100x faster.”\n\n\nIn this post, I assume that Paul’s slogan for the future is correct and then nevertheless push back against the view above. Basically, I will argue that *even if* the future is like the industrial revolution only 10x-100x faster, there is a 30%+ chance that it will involve a single AI project (or a single AI) with the ability to gain a decisive strategic advantage, if they so choose. (Whether or not they exercise that ability is another matter.)\n\n\nWhy am I interested in this? Do I expect some human group to take over the world? No; instead what I think is that (1) an unaligned AI in the leading project might take over the world, and (2) A human project that successfully aligns their AI might refrain from taking over the world even if they have the ability to do so, and instead use their capabilities to e.g. help the United Nations enforce a ban on unauthorized AGI projects.\n\n\nNational ELO ratings during the industrial revolution and the modern era\n------------------------------------------------------------------------\n\n\nIn chess (and some other games) ELO rankings are used to compare players. An average club player might be rank 1500; the world chess champion might be [2800](https://en.wikipedia.org/wiki/Magnus_Carlsen); computer chess programs are even better. If one player has 400 points more than another, it means the first player would win with ~90% probability.\n\n\nWe could apply this system to compare the warmaking abilities of nation-states and coalitions of nation-states. For example, in 1941 perhaps we could say that the ELO rank of the Axis powers was ~300 points lower than the ELO rank of the rest of the world combined (because what in fact happened was the rest of the world combining to defeat them, but it wasn’t a guaranteed victory). We could add that in 1939 the ELO rank of Germany was ~400 points higher than that of Poland, and that the ELO rank of Poland was probably 400+ points higher than that of Luxembourg.\n\n\nWe could make cross-temporal fantasy comparisons too. The ELO ranking of Germany in 1939 was probably ~400 points greater than that of the entire world circa 1910, for example. (Visualize the entirety of 1939 Germany teleporting back in time to 1910, and then imagine the havoc it would wreak.)\n\n\n**Claim 1A:** If we were to estimate the ELO rankings of all nation-states and sets of nation-states (potential alliances) over the last 300 years, the rank of the most powerful nation-state at at a given year would on several occasions be 400+ points greater than the rank of the entire world combined 30 years prior.\n\n\n**Claim 1B:**Over the last 300 years there have been several occasions in which one nation-state had the capability to take over the entire world of 30 years prior.\n\n\nI’m no historian, but I feel fairly confident in these claims.\n\n\n* In naval history, the best fleets in the world in 1850 were obsolete by 1860 thanks to the introduction of iron-hulled steamships, and said steamships were themselves obsolete a decade or so later, and then *those*ships were obsoleted by the Dreadnought, and so on… This process continued into the modern era. By “Obsoleted” I mean something like “A single ship of the new type could defeat the entire combined fleet of vessels of the old type.”\n* A similar story could be told about air power. In a dogfight between planes of year 19XX and year 19XX+30, the second group of planes will be limited only by how much ammunition they can carry.\n* Small technologically advanced nations have regularly beaten huge sprawling empires and coalitions. (See: Colonialism)\n* The entire world has been basically carved up between the small handful of most-technologically advanced nations for two centuries now. For example, any of the Great Powers of 1910 (plus the USA) could have taken over all of Africa, Asia, South America, etc. if not for the resistance that the other great powers would put up. The same was true 40 years later and 40 years earlier.\n\n\nI conclude from this that *if*some great power in the era kicked off by the industrial revolution had managed to “pull ahead” of the rest of the world more effectively than it actually did–30 years more effectively, in particular–it really would have been able to take over the world.\n\n\n**Claim 2:**If the future is like the Industrial Revolution but 10x-100x faster, then correspondingly the technological and economic power granted by being 3 – 0.3 years ahead of the rest of the world should be enough to enable a decisive strategic advantage.\n\n\nThe question is, *how likely is it that one nation/project/AI could get that far ahead of everyone else?* After all, it didn’t happen in the era of the Industrial Revolution. While we did see a massive concentration of power into a few nations on the leading edge of technological capability, there were always at least a few such nations and they kept each other in check.\n\n\nThe “surely not faster than the rest of the world combined” argument\n--------------------------------------------------------------------\n\n\nSometimes I have exchanges like this:\n\n\n* *Me:*Decisive strategic advantage is plausible!\n* *Interlocutor:*What? That means one entity must have more innovation power than the rest of the world combined, to be able to take over the rest of the world!\n* *Me:*Yeah, and that’s possible after intelligence explosion. A superintelligence would totally have that property.\n* *Interlocutor:*Well yeah, *if* we dropped a superintelligence into a world full of humans. But realistically the rest of the world will be undergoing intelligence explosion too. And indeed the world as a whole will undergo a faster intelligence explosion than any particular project could; to think that one project could pull ahead of everyone else is to think that, prior to intelligence explosion, there would be a single project innovating faster than the rest of the world combined!\n\n\nThis section responds to that by way of sketching how one nation/project/AI might get 3 – 0.3 years ahead of everyone else.\n\n\n**Toy model:***There are projects which research technology, each with their own “innovation rate” at which they produce innovations from some latent tech tree. When they produce innovations, they choose whether to make them public or private. They have access to their private innovations + all the public innovations.*\n\n\nIt follows from the above that the project with access to the most innovations at any given time will be the project that has the most hoarded innovations, even though the set of other projects has a higher combined innovation rate and also a larger combined pool of accessible innovations. Moreover, the gap between the leading project and the second-best project will increase over time, since the leading project has a slightly higher rate of production of hoarded innovations, but both projects have access to the same public innovations\n\n\nThis model leaves out several important things. First, it leaves out the whole “intelligence explosion” idea: A project’s innovation rate should increase as some function of how many innovations they have access to. Adding this in will make the situation more extreme and make the gap between the leading project and everyone else grow even bigger very quickly.\n\n\nSecond, it leaves out reasons why innovations might be made public. Realistically there are three reasons: Leaks, spies, and selling/using-in-a-way-that-makes-it-easy-to-copy.\n\n\n**Claim 3: Leaks & Spies:**I claim that the 10x-100x speedup Paul prophecies will not come with an associated 10x-100x increase in the rate of leaks and successful spying. Instead the rate of leaks and successful spying will be only a bit higher than it currently is.\n\n\nThis is because humans are still humans even in this soft takeoff future, still in human institutions like companies and governments, still using more or less the same internet infrastructure, etc. New AI-related technologies might make leaking and spying easier than it currently is, but they also might make it harder. I’d love to see an in-depth exploration of this question because I don’t feel particularly confident.\n\n\nBut anyhow, if it doesn’t get much easier than it currently is, then going 3 years to 0.3 years without a leak is possible, and more generally it’s possible for the world’s leading project to build up a 0.3-3 year lead over the second-place project. For example, the USSR had spies embedded in the Manhattan Project but it still took them 4 more years to make their first bomb.\n\n\n**Claim 4: Selling etc.**I claim that the 10x-100x speedup Paul prophecies will not come with an associated 10x-100x increase in the budget pressure on projects to make money fast. Again, today AI companies regularly go years without turning a profit — DeepMind, for example, has never turned a profit and is losing something like a billion dollars a year for its parent company — and I don’t see any particularly good reason to expect that to change much.\n\n\nSo yeah, it seems to me that it’s totally possible for the leading AI project to survive off investor money and parent company money (or government money, for that matter!) for five years or so, while also keeping the rate of leaks and spies low enough that the distance between them and their nearest competitor increases rather than decreases. (Note how this doesn’t involve them “innovating faster than the rest of the world combined.”)\n\n\nSuppose they could get a 3-year lead this way, at the peak of their lead. Is that enough?\n\n\nWell, yes. A 3-year lead during a time 10x-100x faster than the Industrial Revolution would be like a 30-300 year lead during the era of the Industrial Revolution. As I argued in the previous section, even the low end of that range is probably enough to get a decisive strategic advantage.\n\n\nIf this is so, why didn’t nations during the Industrial Revolution try to hoard their innovations and gain decisive strategic advantage?\n\n\nEngland actually did, if I recall correctly. They passed laws and stuff to prevent their early Industrial Revolution technology from spreading outside their borders. They were unsuccessful–spies and entrepreneurs dodged the customs officials and snuck blueprints and expertise out of the country. It’s not surprising that they weren’t able to successfully hoard innovations for 30+ years! Entire economies are a lot more leaky than AI projects.\n\n\nWhat a “Paul Slow” soft takeoff might look like according to me\n---------------------------------------------------------------\n\n\nAt some point early in the transition to much faster innovation rates, the leading AI companies “go quiet.” Several of them either get huge investments or are nationalized and given effectively unlimited funding. The world as a whole continues to innovate, and the leading companies benefit from this public research, but they hoard their own innovations to themselves. Meanwhile the benefits of these AI innovations are starting to be felt; all projects have significantly increased (and constantly increasing) rates of innovation. But the fastest increases go to the leading project, which is one year ahead of the second-best project. (This sort of gap is normal for tech projects today, especially the rare massively-funded ones, I think.) Perhaps via a combination of spying, selling, and leaks, that lead narrows to six months midway through the process. But by that time things are moving so quickly that a six months’ lead is like a 15-150 year lead during the era of the Industrial Revolution. It’s not guaranteed and perhaps still not probable, but at least it’s reasonably likely that the leading project will be able to take over the world if it chooses to. \n\n\n\n*Objection:*What about coalitions? During the industrial revolution, if one country did successfully avoid all leaks, the other countries could unite against them and make the “public” technology inaccessible to them. (Trade does something like this automatically, since refusing to sell your technology also lowers your income which lowers your innovation rate as a nation.)\n\n\n*Reply:*Coalitions to share AI research progress will be harder than free-trade / embargo coalitions. This is because AI research progress is much more the result of rare smart individuals talking face-to-face with each other and much less the result of a zillion different actions of millions of different people, as the economy is. Besides, a successful coalition can be thought of as just another project, and so it’s still true that one project could get a decisive strategic advantage. (Is it fair to call “The entire world economy” a project with a decisive strategic advantage today? Well, maybe… but it feels a lot less accurate since almost everyone is part of the economy but only a few people would have control of even a broad coalition AI project.) \n\n\n\nAnyhow, those are my thoughts. Not super confident in all this, but it does feel right to me. Again, the conclusion is not that one project will take over the world even in Paul’s future, but rather that such a thing might still happen even in Paul’s future.\n\n\n\n*Thanks to Magnus Vinding for helpful conversation.*\n\n", "url": "https://aiimpacts.org/soft-takeoff-can-still-lead-to-decisive-strategic-advantage/", "title": "Soft takeoff can still lead to decisive strategic advantage", "source": "aiimpacts.org", "source_type": "wordpress", "date_published": "2019-09-11T18:39:38+00:00", "paged_url": "https://aiimpacts.org/feed?paged=11", "authors": ["Daniel Kokotajlo"], "id": "e9e7233d6fe18fe8342e77bae3ae160d", "summary": []}
{"text": "Ernie Davis on the landscape of AI risks\n\n*By Robert Long, 23 August 2019*\n\n\n[](http://aiimpacts.org/wp-content/uploads/2019/08/davis_ernie.jpg)Ernie Davis (NYU)\nEarlier this month, I spoke with Ernie Davis about why he is skeptical that risks from superintelligent AI are substantial and tractable enough to merit dedicated work. This was part of a larger project that we’ve been working on at AI Impacts, documenting arguments from people who are relatively optimistic about risks from advanced AI. \n\n\nDavis is a professor of computer science at NYU, and [works](https://cs.nyu.edu/davise/) on the representation of commonsense knowledge in computer programs. He wrote [*Representations of Commonsense Knowledge*](https://cs.nyu.edu/davise/rck/rck.html) (1990) and will soon publish a book [*Rebooting AI*](http://rebooting.ai/) (2019) with Gary Marcus. We reached out to him because of his expertise in artificial intelligence and because he wrote a [critical review](https://cs.nyu.edu/davise/papers/Bostrom.pdf) of Nick Bostrom’s *Superintelligence*. \n\n\nDavis told me, “the probability that autonomous AI is going to be one of our major problems within the next two hundred years, I think, is less than one in a hundred.” We spoke about why he thinks that, what problems in AI he thinks are more urgent, and what his key points of disagreement with Nick Bostrom are. A full transcript of our conversation, lightly edited for concision and clarity, can be found [here](https://aiimpacts.org/conversation-with-ernie-davis/).\n\n\n\n\n", "url": "https://aiimpacts.org/ernie-davis-on-the-landscape-of-ai-risks/", "title": "Ernie Davis on the landscape of AI risks", "source": "aiimpacts.org", "source_type": "wordpress", "date_published": "2019-08-24T00:23:38+00:00", "paged_url": "https://aiimpacts.org/feed?paged=11", "authors": ["Rob Long"], "id": "30e91d7baea5d86b923eb7a2f36b323e", "summary": []}
{"text": "Conversation with Ernie Davis\n\nAI Impacts spoke with computer scientist Ernie Davis about his views of AI risk. With his permission, we have transcribed this interview.\n\n\n### Participants\n\n\n* [**Ernest Davis**](https://cs.nyu.edu/davise/) – professor of computer science at the Courant Institute of Mathematical Science, New York University\n* [**Robert Long**](http://robertlong.online/) – AI Impacts\n\n\n### Summary\n\n\nWe spoke over the phone with Ernie Davis on August 9, 2019. Some of the topics we covered were:\n\n\n* What Davis considers to be the most urgent risks from AI\n* Davis’s disagreements with Nick Bostrom, Eliezer Yudkowsky, and Stuart Russell\n\t+ The relationship between greater intelligence and greater power\n\t+ How difficult it is to design a system that can be turned off\n\t+ How difficult it would be to encode safe ethical principles in an AI system\n* Davis’s evaluation of the likelihood that advanced, autonomous AI will be a major problem within the next two hundred years; and what evidence would change his mind\n* Challenges and progress towards human-level AI\n\n\nThis transcript has been lightly edited for concision and clarity.\n\n\n### Transcript\n\n\n**Robert Long:** You’re one of the few people, I think, who is an expert in AI, and is not necessarily embedded in the AI Safety community, but you have engaged substantially with arguments from that community. I’m thinking especially of your [review](https://cs.nyu.edu/davise/papers/Bostrom.pdf) of *Superintelligence*.[1](https://aiimpacts.org/conversation-with-ernie-davis/#easy-footnote-bottom-1-1955 \"Davis, Ernest. “Ethical guidelines for a superintelligence.” Artificial Intelligence 220 (2015): 121-124.\") [2](https://aiimpacts.org/conversation-with-ernie-davis/#easy-footnote-bottom-2-1955 \"Bostrom, Nick. Superintelligence: Paths, Dangers, Strategies. Oxford University Press (2014).\")\n\n\nI was hoping we could talk a little bit more about your views on AI safety work. There’s a particular proposition that we’re trying to get people’s opinions on. The question is: Is it valuable for people to be expending significant effort doing work that purports to reduce the risk from advanced artificial intelligence? I’ve read some of your work; I can guess some of your views. But I was wondering: what would you say is your answer to that question, whether this kind of work is valuable to do now?\n\n\n**Ernie Davis:** Well, a number of parts to the answer. In terms of short term—and “short” being not very short—short term risks from computer technology generally, this is very low priority. The risks from cyber crime, cyber terrorism, somebody taking hold of the insecurity of the internet of things and so on—that in particular is one of my bugaboos—are, I think, an awful lot more urgent. So there’s urgency; I certainly don’t see that this is especially urgent work. \n\n\nNow, some of the approaches are being taken to long term AI safety seem to me extremely far fetched. On the one hand the fears of people like Bostrom and Yudkowsky and to a lesser extent Stuart Russell—seem to me misdirected and the approaches they are proposing are also misdirected. I have a [book](https://www.amazon.com/Rebooting-AI-Building-Artificial-Intelligence-ebook/dp/B07MYLGQLB) with Gary Marcus which is coming out in September, and we have a chapter which is called ‘Trust’ which gives our opinions—which are pretty much convergent—at length. I can send you that chapter. \n\n\n**Robert Long:** Yes, I’d certainly be interested in that.\n\n\n**Ernie Davis:** So, the kinds of things that Russell is proposing—Russell also has a [book](https://www.amazon.com/Human-Compatible-Artificial-Intelligence-Problem/dp/0525558616/ref=sr_1_2?keywords=Stuart+Russell&qid=1565996574&s=books&sr=1-2) coming out in October, he is developing ideas that he’s already published about: the way to have safe AI is to have them be unsure about what the human goals are.[3](https://aiimpacts.org/conversation-with-ernie-davis/#easy-footnote-bottom-3-1955 \"see, for example, Russell, Stuart. “Provably beneficial artificial intelligence.” Exponential Life, The Next Step (2017).\") And Yudkowsky develops similar ideas in his work, engages with them, and tries to measure their success. This all seems to me too clever by half. And I don’t think it’s addressing what the real problems are going to be.\n\n\nMy feeling is that the problem of AIs doing the wrong thing is a very large one—you know, just by sheer inadvertence and incompetent design. And the solution there, more or less, is to design them well and build in safety features of the kinds that one has in engineering, one has throughout engineering. Whenever one is doing an engineering project, one builds in—one designs for failure. And one has to do that with AI as well. The danger of AI being abused by bad human actors is a very serious danger. And that has to be addressed politically, like all problems involving bad human actors. \n\n\nAnd then there are directions in AI where I think it’s foolish to go. For instance it would be very foolish to build—it’s not currently technically feasible, but if it were, and it may at some point become technically feasible—to build robots that can reproduce themselves cheaply. And that’s foolish, but it’s foolish for exactly the same reason that you want to be careful about introducing new species. It’s why Australia got into trouble with the rabbits, namely: if you have a device that can reproduce itself and it has no predators, then it will reproduce itself and it gets to be a nuisance.\n\n\nAnd that’s almost separate. A device doesn’t have to be superintelligent to do that, in fact superintelligence probably just makes that harder because a superintelligent device is harder to build; a self replicating device might be quite easy to build on the cheap. It won’t survive as well as a superintelligent one, but if it can reproduce itself fast enough that doesn’t matter. So that kind of thing, you want to avoid.\n\n\nThere’s a question which we almost entirely avoided in our book, which people always ask all the time, which is, at what point do machines become conscious. And my answer to that—I’m not necessarily speaking for Gary—my answer to that is that you want to avoid building machines which you have any reason to suspect are conscious. Because once they become conscious, they simply raise a whole collection of ethical issues like—”is it ethical turn them off?”, is the first one, and “what are your responsibilities toward the thing?”. And so you want to continue to have programs which, like current programs, one can think of purely as tools which we can use, which it is ethical to use as we choose.\n\n\nSo that’s a thing to be avoided, it seems to me, in AI research. And whether people are wise enough to avoid that, I don’t know. I would hope so. So in some ways I’m more conservative than a lot of people in the AI safety world—in the sense that they assume that self replicating robots will be a thing and that self-aware robots will be a thing and the object is to design them safely. My feeling is that research shouldn’t go there at all.\n\n\n**Robert Long:** I’d just like to dig in on a few more of those claims in particular. I would just like to hear a little bit more about what you think the crux of your disagreement is with people like Yudkowsky and Russell and Bostrom. Maybe you can pick one because they all have different views. So, you said that you feel that their fears are far-fetched and that their approaches are far-fetched as well. Can you just say a little bit about more about why you think that? A few parts: what you think is the core fear or prediction that their work is predicated on, and why you don’t share that fear or prediction.\n\n\n**Ernie Davis:** Both Bostrom very much, and Yudkowsky very much, and Russell to some extent, have this idea that if you’re smart enough you get to be God. And that just isn’t correct. The idea that a smart enough machine can do whatever it want—there’s a really good [essay](https://www.popsci.com/robot-uprising-enlightenment-now) by Steve Pinker, by the way, have you seen it?[4](https://aiimpacts.org/conversation-with-ernie-davis/#easy-footnote-bottom-4-1955 \"Pinker, Steven. “We’re Told to Fear Robots. But Why Do We Think They’ll Turn on Us?” Popular Science 13 (2018).\")\n\n\n**Robert Long:** I’ve heard of it but have not read it.\n\n\n**Ernie Davis:** I’ll send you the link. A couple of good essays by Pinker, I think. So, it’s not the case that once superintelligence is reached, then times become messianic if they’re benevolent and dystopian if they’re not. They’re devices. They are limited in what they can do. And the other thing is that we are here first, and we should be able to design them in such a way that they’re safe. It is not really all that difficult to design an AI or a robot which you can turn off and which cannot block you from turning it off.\n\n\nAnd it seems to me a mistake to believe otherwise. With two caveats. One is that, if you embed it in a situation where it’s very costly to turn off—it’s controlling the power grid and the power grid won’t work if you turn it off, then you’re in trouble. And secondly, if you have malicious actors who are deliberately designing, building devices which can’t be turned off. It’s not that it’s impossible to build an intelligent machine that is very dangerous.\n\n\nBut that doesn’t require superintelligence. That’s possible with very limited intelligence, and the more intelligent, to some extent, the harder it is. But again that’s a different problem. It doesn’t become a qualitatively different problem once the thing has exceeded some predefined level of intelligence.\n\n\n**Robert Long:** You might be even more familiar with these arguments than I am—in fact I can’t really recite them off the top of my head—but I suppose Bostrom and Yudkowsky, and maybe Russell too, do talk about this at length. And I guess they’re they’re always like, Well, you might think you have thought of a good failsafe for ensuring these things won’t get un-turn-offable. But, so they say, you’re probably underestimating just how weird things can get once you have superintelligence. \n\n\nI suppose maybe that’s precisely what you’re disagreeing with: maybe they’re overestimating how weird and difficult things get once things are above human level. Why do you think you and they have such different hunches, or intuitions, about how weird things can get?\n\n\n**Ernie Davis:** I don’t know, I think they’re being unrealistic. If you take a 2019 genius and you put him into a Neolithic village, they can kill him no matter how intelligent he is, and how much he knows and so on. \n\n\n**Robert Long:** I’ve been trying to trace the disagreements here and I think a lot of it does just maybe come down to people’s intuitions about what a very smart person can do if put in a situation where they are far smarter than other people. I think this actually comes up in someone who [responded](https://intelligence.org/2015/02/06/davis-ai-capability-motivation/) to your review. They claim, “I think if I went back to the time of the Romans I could probably accrue a lot of power just by knowing things that they did not know.”[5](https://aiimpacts.org/conversation-with-ernie-davis/#easy-footnote-bottom-5-1955 \"This is not an accurate paraphrase because the review in question stipulates that the human could take back “all the 21st-century knowledge and technologies they wanted”. The passage is: “If we sent a human a thousand years into the past, equipped with all the 21st-century knowledge and technologies they wanted, they could conceivably achieve dominant levels of wealth and power in that time period.”—Bensinger, Rob. “Davis on AI Capability and Motivation.” Accessed August 23, 2019. https://intelligence.org/2015/02/06/davis-ai-capability-motivation/.\")\n\n\n**Ernie Davis:** I missed that, or I forgot that or something.\n\n\n**Robert Long:** Trying to locate the crux of the disagreement: one key disagreement is what the relationship is between greater intellectual capacity and greater physical power and control over the world. Does that seem safe to say, that that’s one thing you disagree with them about?\n\n\n**Ernie Davis:** I think so, yes. That’s one point of disagreement. A second point of disagreement is the difficulty of—the point which we make in the book at some length is that, if you’re going to have an intelligence that’s in any way comparable to human, you’re going to have to build in common sense. It’s going to have to have a large degree of commonsense understanding. And once an AI has common sense it will realize that there’s no point in turning the world into paperclips, and that there’s no point in committing mass murder to go fetch the milk—Russell’s example—and so on. My feeling is that one can largely incorporate a moral sense, when it becomes necessary; you can incorporate moral rules into your robots.\n\n\nAnd one of the people who criticized my Bostrom paper said, well, philosophers haven’t solved the problems of ethics in 2,000 years, how do you think we’re going to solve them? And my feeling is we don’t have to come up with the ultimate solution to ethical problems. You just have to make sure that they understand it to a degree that they don’t do spectacularly foolish and evil things. And that seems to me doable.\n\n\nAnother point of disagreement with Bostrom in particular, and I think also Yudkowsky, is that they have the idea that ethical senses evolve—which is certainly true—and that a superintelligence, if well-designed, can be designed in such a way that it will itself evolve toward a superior ethical sense. And that this is the thing to do. Bostrom goes into this at considerable length: somehow, give it guidance toward an ethical sense which is beyond anything that we currently understand. That seems to me not very doable, but it would be a really bad thing to do if we could do it, because this super ethics might decide that the best thing to do is to exterminate the human population. And in some super-ethical sense that might be true, but we don’t want it to happen. So the belief in the super ethics—I have no belief, I have no faith in the super ethics, and I have even less faith that there’s some way of designing an AI so that as it grows superintelligent it will achieve super ethics in a comfortable way. So this all seems to me pie in the sky.\n\n\n**Robert Long:** So the key points of disagreement we have so far are the relationship between intelligence and power; and the second thing is, how hard is what we might call the safety problem. And it sounds like even if you became more worried about very powerful AIs, you think it would not require substantial research and effort and money (as some people think) to make them relatively safe?\n\n\n**Ernie Davis:** Where I would put the effort in is into thinking about, from a legal regulatory perspective, what we want to do. That’s not an easy question.\n\n\nThe problem at the moment, the most urgent question, is the problem of fake news. We object to having bots spreading fake news. It’s not clear what the best way of preventing that is without infringing on free speech. So that’s a hard problem. And that is, I think, very well worth thinking about. But that’s of course a very different problem. The problems of security at the practical level—making sure that an adversary can’t take control of all the cars that are connected to the Internet and start using them as weapons—is, I think, a very pressing problem. But again that has nothing much to do with the AI safety projects that are underway.\n\n\n**Robert Long:** Kind of a broad question—I was curious to hear what you make of the mainstream AI safety efforts that are now occurring. My rough sense is since your review and since *Superintelligence*, AI safety really gained respectability and now there are AI safety teams at places like DeepMind and OpenAI. And not only do they work on the near-term stuff which you talk about, but they are run by people who are very concerned about the long term. What do you make of that trend?\n\n\n**Ernie Davis:** The thing is, I haven’t followed their work very closely, to tell you the truth. So I certainly don’t want to criticize it very specifically. There are smart and well-intentioned people on these teams, and I don’t doubt that a lot of what they’re doing is good work. \n\n\nThe work I’m most enthusiastic about in that direction is problems that are fairly near term. And also autonomous weapons is a pretty urgent problem, and requires political action. So the more that can be done about keeping those under control the better.\n\n\n**Robert Long:** Do you think your views on what it will take before we ever get to human-level or more advanced AI, do you think that drives a lot of your opinions as well? For example, your [own work](https://cs.nyu.edu/davise/research.html) on common sense and how hard of a problem that can be?[6](https://aiimpacts.org/conversation-with-ernie-davis/#easy-footnote-bottom-6-1955 \"Davis, Ernest. “The Singularity and the State of the Art in Artificial Intelligence: The technological singularity.” Ubiquity 2014, no. October (2014): 2.\") [7](https://aiimpacts.org/conversation-with-ernie-davis/#easy-footnote-bottom-7-1955 \"Davis, Ernest, and Gary Marcus. “Commonsense reasoning and commonsense knowledge in artificial intelligence.” Commun. ACM 58, no. 9 (2015): 92-103.\")\n\n\n**Ernie Davis:** Yeah sure, certainly it informs my views. It affects the question of urgency and it affects the question of what the actual problems are likely to be.\n\n\n**Robert Long:** What would you say is your credence, your evaluation of the likelihood, that without significant additional effort, advanced AI poses a significant risk of harm?\n\n\n**Ernie Davis:** Well, the problem is that without more work on artificial intelligence, artificial intelligence poses no risk. And the distinction between work on AI, and work on AI safety—work on AI is an aspect of work on AI safety. So I’m not sure it’s a well-defined question.\n\n\nBut that’s a bit of a debate. What we mean is, if we get rid of all the AI safety institutes, and don’t worry about the regulation, and just let the powers that be do whatever they want to do, will advanced AI be a significant threat? There is certainly a sufficiently significant probability of that, but almost all of that probability has do with its misuse by bad actors.\n\n\nThe problem that AI will autonomously become a major threat, I put it at very small. The probability that people will start deploying AI in a destructive way and causing serious harm, to some extent or other, is fairly large. The probability that autonomous AI is going to be one of our major problems within the next two hundred years I think is less than one in a hundred.\n\n\n**Robert Long:** Ah, good. Thank you for parsing that question. It’s that last bit that I’m curious about. And what do you think are the key things that go into that low probability? It seems like there’s two parts: odds of it being a problem if it arises, and odds of it arising. I guess what I’m trying to get at is—again, uncertainty in all of this—but do you have hunches or ‘AI timelines’ as people call them, about how far away we are from human level intelligence being a real possibility?\n\n\n**Ernie Davis:** I’d be surprised—well, I will not be surprised, because I will be dead—but I would be surprised if AI reached human levels of capacity across the board within the next 50 years.\n\n\n**Robert Long:** I suspect a lot of this is also found in your written work. But could you say briefly what you think are the things standing in the way, standing in between where we’re at now in our understanding of AI, and getting to that—where the major barriers or confusions or new discoveries to be made are?\n\n\n**Ernie Davis:** Major barriers—well, there are many barriers. We don’t know how to give computers basic commonsense understanding of the world. We don’t know how to represent the meaning of either language or what the computer can see through vision. We don’t have a good theory of learning. Those, I think, are the main problems that I see and I don’t see that the current direction of work in AI is particularly aimed at those problems.\n\n\nAnd I don’t think it’s likely to solve those problems without a major turnaround. And the problems, I think, are very hard. And even after the field has turned around I think it will take decades before they’re solved.\n\n\n**Robert Long:** I suspect a lot of this might be what the book is about. But can you say what you think that turnaround is, or how you would characterize the current direction? I take it you mean something like deep learning and reinforcement learning?\n\n\n**Ernie Davis:** Deep learning, end-to-end learning, is what I mean by the current direction. It is very much the current direction. And the turnaround, in one sentence, is that one has to engage with the problems of meaning, and with the problems of common sense knowledge.\n\n\n**Robert Long:** Can you think of plausible concrete evidence that would change your views one way or the other? Specifically, on these issues of the problem of safety, and what if any work should be done.\n\n\n**Ernie Davis:** Well sure, I mean, if, on the one hand, progress toward understanding in a broad sense—if there’s startling progress on the problem of understanding then my timeline changes obviously, and that makes the problem harder.\n\n\nAnd if it turned out—this is an empirical question—if it turned out that certain types of AI systems inherently turned toward single minded pursuit of malevolence or toward their own purposes and so on. And it seems to me wildly unlikely, but it’s not unimaginable.\n\n\nOr of course, if in a social sense—if people start uncontrollably developing these things. I mean it always amazes me the amount of sheer malice in the cyber world, the number of people who are willing to hack systems and develop bugs for no reason. The people who are doing it to make money is one thing, I can understand them. The people do it simply out of the challenge and out of the spirit of mischief making—I’m surprised that there are so many. \n\n\n**Robert Long:** Can I ask a little bit more about what progress towards understanding looks like? What sort of tasks or behaviors? What does the arxiv paper that demonstrates that look like? What’s it called, and what is is the program doing, where you’re like, “Wow, this is this is a huge stride.”\n\n\n**Ernie Davis:** I have a [paper](https://cs.nyu.edu/davise/papers/squabu.pdf) called “How to write science questions that are easy for people and hard for computers.”[8](https://aiimpacts.org/conversation-with-ernie-davis/#easy-footnote-bottom-8-1955 \"Davis, Ernest. “How to write science questions that are easy for people and hard for computers.” AI magazine 37, no. 1 (2016): 13-22.\") So once you get a response paper to that: “My system answers all the questions in this dataset which are easy for people and hard for computers.” That would be impressive. If you have a program that can read basic narrative text and answer questions about it or watch a video and answer questions, a film and answer questions about it—that would be impressive.\n\n\n### Notes\n\n", "url": "https://aiimpacts.org/conversation-with-ernie-davis/", "title": "Conversation with Ernie Davis", "source": "aiimpacts.org", "source_type": "wordpress", "date_published": "2019-08-23T23:35:20+00:00", "paged_url": "https://aiimpacts.org/feed?paged=11", "authors": ["Rob Long"], "id": "ad01d861442a50c618349f77fdab97cb", "summary": []}
{"text": "Evidence against current methods leading to human level artificial intelligence\n\nThis is a list of published arguments that we know of that current methods in artificial intelligence will not lead to human-level AI.\n\n\nDetails\n-------\n\n\n### Clarifications\n\n\nWe take ‘current methods’ to mean techniques for engineering artificial intelligence that are already known, involving no “qualitatively new ideas”.[1](https://aiimpacts.org/evidence-against-current-methods-leading-to-human-level-artificial-intelligence/#easy-footnote-bottom-1-1938 \"“It now seems possible that we could build ‘prosaic’ AGI, which can replicate human behavior but doesn’t involve qualitatively new ideas about ‘how intelligence works’”. — Christiano, Paul. “Prosaic AI Alignment”. 2017. Medium. Accessed August 13 2019. https://ai-alignment.com/prosaic-ai-control-b959644d79c2.\") We have not precisely defined ‘current methods’. Many of the works we cite refer to currently *dominant* methods such as machine learning (especially deep learning) and reinforcement learning.\n\n\nBy human-level AI, we mean AI with a level of *performance* comparable to humans. We have in mind the operationalization of ‘high-level machine intelligence’ from our [2016 expert survey on progress in AI](https://aiimpacts.org/2016-expert-survey-on-progress-in-ai/): “Say we have ‘high-level machine intelligence’ when unaided machines can accomplish every task better and more cheaply than human workers.”[2](https://aiimpacts.org/evidence-against-current-methods-leading-to-human-level-artificial-intelligence/#easy-footnote-bottom-2-1938 \"Grace, Katja, John Salvatier, Allan Dafoe, Baobao Zhang, and Owain Evans. “When will AI exceed human performance? Evidence from AI experts.” Journal of Artificial Intelligence Research 62 (2018): 729-754.\")\nBecause we are considering intelligent performance, we have deliberately excluded arguments that AI might lack certain ‘internal’ features, even if it manifests human-level performance.[3](https://aiimpacts.org/evidence-against-current-methods-leading-to-human-level-artificial-intelligence/#easy-footnote-bottom-3-1938 \"Block, Ned. 1981. “Psychologism and behaviorism.” The Philosophical Review 90, no. 1 (1981): 5-43.\") [4](https://aiimpacts.org/evidence-against-current-methods-leading-to-human-level-artificial-intelligence/#easy-footnote-bottom-4-1938 \"Searle, J. 1980. Minds, brains, and programs. Behavioral and Brain Sciences 3:417-57.
\") We assume, concurring with Chalmers (2010), that “If there are systems that produce apparently [human-level intelligent] outputs, then whether or not these systems are truly conscious or intelligent, they will have a transformative impact.”[5](https://aiimpacts.org/evidence-against-current-methods-leading-to-human-level-artificial-intelligence/#easy-footnote-bottom-5-1938 \"Chalmers, David. “The Singularity: A Philosophical Analysis”. 2010. David Chalmers. Accessed August 12 2019. http://consc.net/papers/singularity.pdf.\")\n### Methods\n\n\nWe read well-known criticisms of current AI approaches of which we were already aware. Using these as a starting point, we searched for further sources and solicited recommendations from colleagues familiar with artificial intelligence.\n\n\nWe include arguments that sound plausible to us, or that we believe other researchers take seriously. Beyond that, we take no stance on the relative strengths and weaknesses of these arguments. \n\n\nWe cite works that plausibly support pessimism about current methods, regardless of whether the works in question (or their authors) actually claim that current methods will not lead to human-level artificial intelligence. \n\n\nWe do not include arguments that serve primarily as undercutting defeaters of *positive* arguments that current methods *will* lead to human-level intelligence. For example, we do not include arguments that recent progress in machine learning has been overstated.\n\n\nThese arguments might overlap in various ways, depending on how one understands them. For example, some of the challenges for current methods might be special instances of more general challenges. \n\n\n### List of arguments\n\n\n#### Inside view arguments\n\n\nThese arguments are ‘inside view’ in that they look at the specifics of current methods.\n\n\n* **Innate knowledge:** Intelligence relies on prior knowledge which it is currently not feasible to embed via learning techniques, recapitulate via artificial evolution, or hand-specify. — Marcus (2018)[6](https://aiimpacts.org/evidence-against-current-methods-leading-to-human-level-artificial-intelligence/#easy-footnote-bottom-6-1938 \"Section 3.1, “Deep learning thus far is data hungry” — Marcus, Gary. 2018. “Deep Learning: A Critical Appraisal”. arXiv. Accessed August 12 2019. https://arxiv.org/abs/1801.00631.\")\n* **Data hunger:** Training a system to human level using current methods will require more data than we will be able to generate or acquire. — Marcus (2018)[7](https://aiimpacts.org/evidence-against-current-methods-leading-to-human-level-artificial-intelligence/#easy-footnote-bottom-7-1938 \"Section 3.1, “Deep learning thus far is data hungry” — Marcus, Gary. 2018. “Deep Learning: A Critical Appraisal”. arXiv. Accessed August 12 2019. https://arxiv.org/abs/1801.00631.\")\n\n\n##### Capacities\n\n\nSome researchers claim that there are capacities which are required for human-level intelligence, but difficult or impossible to engineer with current methods.[8](https://aiimpacts.org/evidence-against-current-methods-leading-to-human-level-artificial-intelligence/#easy-footnote-bottom-8-1938 \"One could disagree with the claim that a given capacity is in fact required, or with the claim that current methods cannot engineer it.\") Some commonly-cited capacities are: \n\n\n* **Causal models:** Building causal models of the world that are rich, flexible, and explanatory — Lake et al. (2016)[9](https://aiimpacts.org/evidence-against-current-methods-leading-to-human-level-artificial-intelligence/#easy-footnote-bottom-9-1938 \"Section 4.2.2, “Causality” — Lake, Brenden M., Tomer D. Ullman, Joshua B. Tenenbaum, and Samuel J. Gershman. 2016. “Building Machines That Learn And Think Like People”. arXiv. Accessed August 12 2019. https://arxiv.org/abs/1604.00289.\"), Marcus (2018)[10](https://aiimpacts.org/evidence-against-current-methods-leading-to-human-level-artificial-intelligence/#easy-footnote-bottom-10-1938 \"Section 3.7, “Deep learning thus far cannot inherently distinguish causation from correlation ” — Marcus, Gary. 2018. “Deep Learning: A Critical Appraisal”. arXiv. Accessed August 12 2019. https://arxiv.org/abs/1801.00631.\"), Pearl (2018)[11](https://aiimpacts.org/evidence-against-current-methods-leading-to-human-level-artificial-intelligence/#easy-footnote-bottom-11-1938 \"Pearl, Judea. 2018. “Theoretical Impediments To Machine Learning With Seven Sparks From The Causal Revolution”. arXiv. Accessed August 12 2019. https://arxiv.org/abs/1801.04016.
\")\n* **Compositionality:** Exploiting systematic, compositional relations between entities of meaning, both linguistic and conceptual — Fodor and Pylyshyn (1988)[12](https://aiimpacts.org/evidence-against-current-methods-leading-to-human-level-artificial-intelligence/#easy-footnote-bottom-12-1938 \"Part III: The need for Symbol Systems: Productivity, Systematicity, Compositionality and Inferential Coherence, in particular Sections “Systematicity of cognitive representation” and “Compositionality of representations” — Fodor, Jerry A. and Pylyshyn, “Connectionism and Cognitive Architecture: A Critical Analysis.” Zenon W. 1988. Rutgers Center for Cognitive Science. Accessed August 12 2019. http://ruccs.rutgers.edu/images/personal-zenon-pylyshyn/proseminars/Proseminar13/ConnectionistArchitecture.pdf.\"), Marcus (2001)[13](https://aiimpacts.org/evidence-against-current-methods-leading-to-human-level-artificial-intelligence/#easy-footnote-bottom-13-1938 \"Marcus, G.F., 2001. The algebraic mind: Integrating connectionism and cognitive science. MIT press.\"), Lake and Baroni (2017)[14](https://aiimpacts.org/evidence-against-current-methods-leading-to-human-level-artificial-intelligence/#easy-footnote-bottom-14-1938 \"Lake, Brenden M., and Marco Baroni. 2017. “Generalization Without Systematicity: On The Compositional Skills Of Sequence-To-Sequence Recurrent Networks”. arXiv. Accessed August 13 2019. https://arxiv.org/abs/1711.00350.\")\n* **Symbolic rules:** Learning abstract rules rather than extracting statistical patterns — Marcus (2018)[15](https://aiimpacts.org/evidence-against-current-methods-leading-to-human-level-artificial-intelligence/#easy-footnote-bottom-15-1938 \"Section 5.2, “Symbol-manipulation, and the need for hybrid models” — Marcus, Gary. 2018. “Deep Learning: A Critical Appraisal”. arXiv. Accessed August 12 2019. https://arxiv.org/abs/1801.00631.\")\n* **Hierarchical structure:** Dealing with hierarchical structure, e.g. that of language — Marcus (2018)[16](https://aiimpacts.org/evidence-against-current-methods-leading-to-human-level-artificial-intelligence/#easy-footnote-bottom-16-1938 \"Section 3.3, “Deep learning thus far has no natural way to deal with hierarchical structure” — Marcus, Gary. 2018. “Deep Learning: A Critical Appraisal”. arXiv. Accessed August 12 2019. https://arxiv.org/abs/1801.00631.\")\n* **Transfer learning:** Learning lessons from one task that transfer to other tasks that are similar, or that differ in systematic ways — Marcus (2018)[17](https://aiimpacts.org/evidence-against-current-methods-leading-to-human-level-artificial-intelligence/#easy-footnote-bottom-17-1938 \"Section 3.2, “Deep learning thus far is shallow and has limited capacity for transfer” — Marcus, Gary. 2018. “Deep Learning: A Critical Appraisal”. arXiv. Accessed August 12 2019. https://arxiv.org/abs/1801.00631.\"), Lake et al. (2016)[18](https://aiimpacts.org/evidence-against-current-methods-leading-to-human-level-artificial-intelligence/#easy-footnote-bottom-18-1938 \"Section 4.2.3, “Learning-to-learn” — Lake, Brenden M., Tomer D. Ullman, Joshua B. Tenenbaum, and Samuel J. Gershman. 2016. “Building Machines That Learn And Think Like People”. arXiv. Accessed August 12 2019. https://arxiv.org/abs/1604.00289.\")\n* **Common sense understanding:** Using common sense to understand language and reason about new situations — Brooks (2019)[19](https://aiimpacts.org/evidence-against-current-methods-leading-to-human-level-artificial-intelligence/#easy-footnote-bottom-19-1938 \"Section 3, “Read a Book” — Brooks, Rodney. “[For&AI] Steps Toward Super Intelligence III, Hard Things Today – Rodney Brooks”. 2019. Rodney Brooks. Accessed August 12 2019. http://rodneybrooks.com/forai-steps-toward-super-intelligence-iii-hard-things-today/.\"), Marcus and Davis (2015)[20](https://aiimpacts.org/evidence-against-current-methods-leading-to-human-level-artificial-intelligence/#easy-footnote-bottom-20-1938 \"Marcus, Gary and Davis, Ernest. “Commonsense reasoning and commonsense knowledge in artificial intelligence”. Commun. ACM 58, no. 9 (2015): 92-103.\")\n\n\n#### Outside view arguments\n\n\nThese arguments are ‘outside view’ in that they look at “a class of cases chosen to be similar in relevant respects”[21](https://aiimpacts.org/evidence-against-current-methods-leading-to-human-level-artificial-intelligence/#easy-footnote-bottom-21-1938 \"Kahneman, Daniel and Lovallo, Dan. “Timid Choices and Bold Forecasts: A Cognitive Perspective on Risk Taking”. 1993. Warrington College of Business. Accessed August 13 2019. http://bear.warrington.ufl.edu/brenner/mar7588/Papers/kahneman-lovallo-mansci1993.pdf.\") to current artificial intelligence research, without looking at the specifics of current methods.\n\n\n* **Lack of progress:** There are many tasks specified several decades ago that have not been solved, e.g. effectively manipulating a robot arm, open-ended question-answering. — Brooks (2018)[22](https://aiimpacts.org/evidence-against-current-methods-leading-to-human-level-artificial-intelligence/#easy-footnote-bottom-22-1938 \"Section 2, “Real Manipulation” — Brooks, Rodney. “[For&AI] Steps Toward Super Intelligence III, Hard Things Today – Rodney Brooks”. 2019. Rodney Brooks. Accessed August 12 2019. http://rodneybrooks.com/forai-steps-toward-super-intelligence-iii-hard-things-today/.
\"), Jordan (2018)[23](https://aiimpacts.org/evidence-against-current-methods-leading-to-human-level-artificial-intelligence/#easy-footnote-bottom-23-1938 \"Jordan, Michael. “Artificial Intelligence — The Revolution Hasn’t Happened Yet”. 2018. Medium. Accessed August 12 2019.\")\n* **Past predictions:** Past researchers have incorrectly predicted that we would get to human-level AI with then-current methods. — Chalmers (2010)[24](https://aiimpacts.org/evidence-against-current-methods-leading-to-human-level-artificial-intelligence/#easy-footnote-bottom-24-1938 \"“It must be acknowledged that every path to AI has proved surprisingly difficult to date. The history of AI involves a long series of optimistic predictions by those who pioneer a method, followed by a periods of disappointment and reassessment. This is true for a variety of methods involving direct programming, machine learning, and artificial evolution, for example. Many of the optimistic predictions were not obviously unreasonable at the time, so their failure should lead us to reassess our prior beliefs in significant ways. It is not obvious just what moral should be drawn: Alan Perlis has suggested ‘A year spent in artificial intelligence is enough to make one believe in God’. So optimism here should be leavened with caution.” — Chalmers, David. “The Singularity: A Philosophical Analysis”. 2010. David Chalmers. Accessed August 12 2019. http://consc.net/papers/singularity.pdf.\")\n* **Other fields:** Several fields have taken centuries or more to crack; AI could well be one of them. — Brooks (2018)[25](https://aiimpacts.org/evidence-against-current-methods-leading-to-human-level-artificial-intelligence/#easy-footnote-bottom-25-1938 \"“Einstein predicted gravitational waves in 1916. It took ninety nine years of people looking before we first saw them in 2015. Rainer Weiss, who won the Nobel prize for it, sketched out the successful method after fifty one years in 1967. And by then the key technologies needed, laser and computers, were in widespread commercial use. It just took a long time. Controlled nuclear fusion has been forty years away for well over sixty years now. Chemistry took millennia, despite the economic incentive of turning lead into gold (and it turns out we still can’t do that in any meaningful way). P=NP? has been around in its current form for forty seven years and its solution would guarantee whoever did it to be feted as the greatest computer scientist in a generation, at least. No one in theoretical computer science is willing to guess when we might figure that one out. And it doesn’t require any engineering or production. Just thinking. Some things just take a long time, and require lots of new technology, lots of time for ideas to ferment, and lots of Einstein and Weiss level contributors along the way. I suspect that human level AI falls into this class. But that it is much more complex than detecting gravity waves, controlled fusion, or even chemistry, and that it will take hundreds of years.“ — Brooks, Rodney. “[For&AI] Steps Toward Super Intelligence I, How We Got Here – Rodney Brooks”. 2018. Rodney Brooks. Accessed August 13 2019. https://rodneybrooks.com/forai-steps-toward-super-intelligence-i-how-we-got-here/.\")\n\n\nContributions\n-------------\n\n\nRobert Long and Asya Bergal contributed research and writing.\n\n\nNotes\n-----\n\n\nFeatured image from [www.extremetech.com](https://www.extremetech.com/extreme/215170-artificial-neural-networks-are-changing-the-world-what-are-they).\n\n\n\n\n\n", "url": "https://aiimpacts.org/evidence-against-current-methods-leading-to-human-level-artificial-intelligence/", "title": "Evidence against current methods leading to human level artificial intelligence", "source": "aiimpacts.org", "source_type": "wordpress", "date_published": "2019-08-13T00:55:13+00:00", "paged_url": "https://aiimpacts.org/feed?paged=11", "authors": ["Asya Bergal"], "id": "7055d9a662ae1c1d6854235b535c7b81", "summary": ["This post briefly lists arguments that current AI techniques will not lead to high-level machine intelligence (HLMI), without taking a stance on how strong these arguments are."]}
{"text": "Historic trends in land speed records\n\nLand speed records did not see any greater-than-10-year discontinuities relative to linear progress across all records. Considered as several distinct linear trends it saw discontinuities of 12, 13, 25, and 13 years, the first two corresponding to early (but not first) jet-propelled vehicles.\n\n\nThe first jet-propelled vehicle just predated a marked change in the rate of progress of land speed records, from a recent 1.8 mph / year to 164 mph / year.\n\n\nDetails\n-------\n\n\nThis case study is part of AI Impacts’ [discontinuous progress investigation](https://aiimpacts.org/discontinuous-progress-investigation/).\n\n\n### Background\n\n\nAccording to Wikipedia, the land speed record is “the highest speed achieved by a person using a vehicle on land.”[1](https://aiimpacts.org/historic-trends-in-land-speed-records/#easy-footnote-bottom-1-1621 \"“Land Speed Record”. 2019. En.Wikipedia.Org. Accessed May 25 2019. https://en.wikipedia.org/wiki/Land_speed_record.\") Wheel-driven cars, which supply power to their axles, held the records for land speed record through 1963, when the first turbojet powered vehicles arrived on the scene. No wheel-driven car has held the record since 1964.[2](https://aiimpacts.org/historic-trends-in-land-speed-records/#easy-footnote-bottom-2-1621 \"“Craig Breedlove’s mark of 407.447 miles per hour (655.722 km/h), set in Spirit of America in September 1963, was initially considered unofficial. The vehicle breached the FIA regulations on two grounds: it had only three wheels, and it was not wheel-driven, since its jet engine did not supply power to its axles. […] The confusion of having three different LSRs lasted until December 11, 1964, when the FIA and FIM met in Paris and agreed to recognize as an absolute LSR the higher speed recorded by either body, by any vehicles running on wheels, whether wheel-driven or not. […] No wheel-driven car has since held the absolute record.” – “Land Speed Record”. 2019. En.Wikipedia.Org. Accessed May 25 2019. https://en.wikipedia.org/wiki/Land_speed_record.\")\nFigure 1: Three record-setting vehicles: Sunbeam, Sunbeam Blue Bird, and Blue Bird[3](https://aiimpacts.org/historic-trends-in-land-speed-records/#easy-footnote-bottom-3-1621 \"From Wikimedia Commons: sv1ambo [CC BY 2.0 (https://creativecommons.org/licenses/by/2.0)]\")\n### Trends\n\n\n#### Land speed records\n\n\n##### Data\n\n\nWe took data from Wikipedia’s list of land speed records,[4](https://aiimpacts.org/historic-trends-in-land-speed-records/#easy-footnote-bottom-4-1621 \"“Land Speed Record”. 2019. En.Wikipedia.Org. Accessed May 25 2019. https://en.wikipedia.org/wiki/Land_speed_record.\") which we have not verified, and added it to [this spreadsheet](https://docs.google.com/spreadsheets/d/1sezw2CCJ3WxcrAcqsw7ZWK1rJoxJkVYxW9HljWVe-vg/edit?usp=sharing). See Figure 2 below.\n\n\n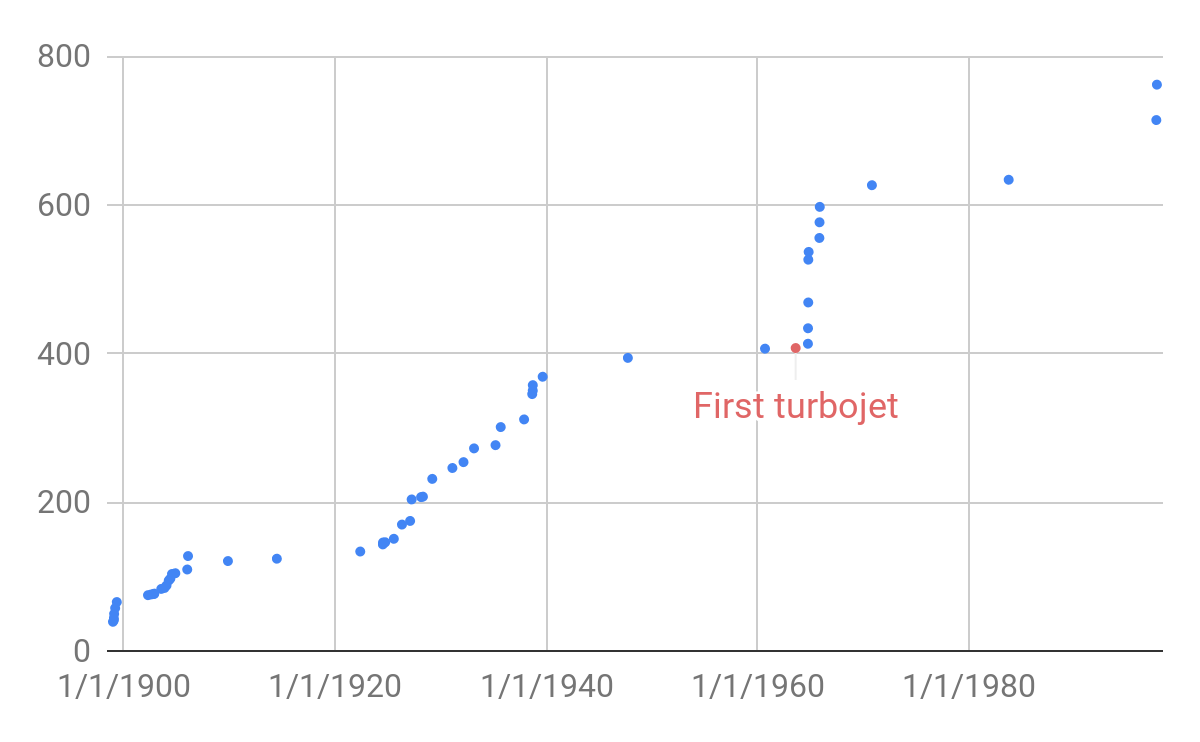Figure 2: Historic land speed records in mph over time. Speeds on the left are an average of the record set in mph over 1 km and over 1 mile. The red dot represents the first record in a cluster that was from a jet propelled vehicle. The discontinuities of more than ten years are the third and fourth turbojet points, and the last two points.\n##### Discontinuity measurement\n\n\nIf we treat the data as a linear trend across all time,[5](https://aiimpacts.org/historic-trends-in-land-speed-records/#easy-footnote-bottom-5-1621 \"See our our methodology page for more details.\") then the land speed record did not contain any greater than 10-year discontinuities. \n\n\nHowever we divide the data into several linear trends.[6](https://aiimpacts.org/historic-trends-in-land-speed-records/#easy-footnote-bottom-6-1621 \"See our spreadsheet to view the trends, and our methodology page for details on how to interpet our sheets and when and how we divide data into trends.\") Extrapolating based on these trends, there were four discontinuities of sizes 12, 13, 25, and 13 years, produced by different turbojet-powered vehicles.[7](https://aiimpacts.org/historic-trends-in-land-speed-records/#easy-footnote-bottom-7-1621 \"See our methodology page for more details, and our spreadsheet for our calculation.\")In addition to the size of these discontinuities in years, we have tabulated a number of other potentially relevant metrics **[here](https://docs.google.com/spreadsheets/d/1iMIZ57Ka9-ZYednnGeonC-NqwGC7dKiHN9S-TAxfVdQ/edit?usp=sharing)**.[8](https://aiimpacts.org/historic-trends-in-land-speed-records/#easy-footnote-bottom-8-1621 \"See our methodology page for more details.\")\n##### Changes in the rate of progress\n\n\nThere are several marked changes in the rate of progress in this history. The first two discontinuities are near the start of a sharp change, that seemed to come from the introduction of jet-propulsion (though note that the first jet-propelled vehicle in the trend is neither discontinuous with the previous trend, nor seemingly within the period of faster growth).\n\n\nIf we look at the rates of progress in the stretches directly before the second jet propelled vehicle in 1964, and the stretch directly after that through 1965, the rate of progress increases from 1.8 mph / year to 164 mph / year.[9](https://aiimpacts.org/historic-trends-in-land-speed-records/#easy-footnote-bottom-9-1621 \"See our methodology page for more details, and our spreadsheet for our calculations.\")\nNotes\n-----\n\n\n\n\n\n\n\n", "url": "https://aiimpacts.org/historic-trends-in-land-speed-records/", "title": "Historic trends in land speed records", "source": "aiimpacts.org", "source_type": "wordpress", "date_published": "2019-07-17T23:10:07+00:00", "paged_url": "https://aiimpacts.org/feed?paged=11", "authors": ["Asya Bergal"], "id": "9a71226a8a714f80d54eb4b5b82ca675", "summary": []}
{"text": "Methodology for discontinuous progress investigation\n\nAI Impacts’ [discontinuous progress investigation](https://aiimpacts.org/discontinuous-progress-investigation/) was conducted according to methodology outlined on this page.\n\n\nDetails\n-------\n\n\nContributions to the [discontinuous progress investigation](https://aiimpacts.org/discontinuous-progress-investigation/) were made over at least 2015-2019, by a number of different people, and methods have varied somewhat. In 2019 we attempted to make methods across the full collection of case studies more consistent. The following is a description of methodology as of December 2019.\n\n\n### Overview\n\n\nTo learn about the prevalence and nature of discontinuities in technological progress[1](https://aiimpacts.org/methodology-for-discontinuity-investigation/#easy-footnote-bottom-1-1656 \"See the project page for more on the motivations and goals of the project.\"), we:\n\n\n1. **Searched for potential examples of discontinuous progress (e.g. ‘Eli Whitney’s cotton gin’)** We collected around ninety suggestions of technological change which might have been discontinuous, from various people. Some of these pointed to particular technologies, and others to trends.[2](https://aiimpacts.org/methodology-for-discontinuity-investigation/#easy-footnote-bottom-2-1656 \"For instance, a person might suggest to us that ‘building heights’ has been discontinuous, or that the Burj Khalifa was some sort of discontinuity.\") We added further examples as they arose when we were already working on later steps. A list of suggested examples not ultimately included is available [here](https://aiimpacts.org/incomplete-case-studies-of-discontinuous-progress/).\n2. **Chose specific metrics related to some of these potential examples (e.g. ‘cotton ginned per person per day’, ‘value of cotton ginned per cost’) and found historic data on progress on those metrics (usually in conjunction).** We took cases one by one and searched for data on relevant metrics in their vicinity. For instance, if we were told that fishing hooks became radically stronger in 1997, we might look for data on the strength of fishing hooks over time, but also for the cost of fishing hooks per year, or how many fish could be caught by a single fishing hook, because these are measures of natural interest that we might expect to be affected by a change in fishing hook strength. Often we ended up collecting data on several related trends. This was generally fairly dependent on what data could be found. Many suggestions are not included in the investigation so far because we have not found relevant data. Though sometimes we proceeded with quite minimal data, if it was possible to at least assess a single development’s likelihood of having been discontinuous.\n3. **Defined a ‘rate of past progress’ throughout each historic dataset** At each datapoint in a trend after the first one, we defined a ‘previous rate of progress’. This was generally either linear or exponential, and was the average rate of progress between the previous datapoint and some earlier datapoint, though not necessarily the first. For instance, if a trend was basically flat from 1900 until 1967, then became steep, then in defining the previous rate of progress for the 1992 datapoint, we may decide to call this linear progress since 1967, rather than say exponential progress since 1900.\n4. **Measured the discontinuity at each datapoint** We did this by comparing the progress at the point to the expected progress at that date based on the last datapoint and the rate of past progress. For instance, if the last datapoint five years ago was 600 units, and progress had been going at two units per year, and now a development took it to 800 units, we would calculate 800 units – 600 units = 200 units of progress = 100 years of progress in 5 years, so a 95 year discontinuity.\n5. **Noted any discontinuities** of more than ten years (‘moderate discontinuities’), and more than one hundred years (‘large discontinuities’)\n6. **Noted anything interesting about the circumstances of each discontinuity** (e.g. the type of metric it was in, the events that appeared to lead to the discontinuity, the patterns of progress around it.)\n\n\n### Choosing areas\n\n\nWe collected around ninety suggestions of technological change which might have been discontinuous. Many of these were offered to us in response to a Facebook question, a [Quora question](http://www.quora.com/When-has-any-technological-capability-increased-abruptly-rather-than-incrementally), personal communications, and a bounty posted on this website. We obtained some by searching for abrupt graphs in google images, and noting their subject matter. We found further contenders in the process of investigating others. Some of these are particular technologies, and others are trends.[3](https://aiimpacts.org/methodology-for-discontinuity-investigation/#easy-footnote-bottom-3-1656 \"For instance, a person might suggest to us that ‘building heights’ has been discontinuous, or that the Burj Khalifa was some sort of discontinuity.\")\nWe still have around fifty suggestions for trends that may have been discontinuities that we have not looked into, or have [not finished looking into](http://aiimpacts.org/incomplete-case-studies-of-discontinuous-progress/). \n\n\n### Choosing metrics\n\n\nFor any area of technological activity, there are many specific metrics one could measure progress on. For instance consider ginning cotton (that is, taking the seeds out of it so that the fibers may be used for fabric). The development of new cotton gins might be expected to produce progress in all of the following metrics:\n\n\n* Cotton ginnable per minute under perfect laboratory conditions\n* Cotton ginned per day by users\n* Cotton ginned per worker per day by users\n* Quality-adjusted cotton ginned per quality-adjusted worker per day\n* Cost to produce $1 of ginned cotton\n* Number of worker injuries stemming from cotton ginning\n* Prevalence of cotton gins\n* Value of cotton\n\n\n(These are still not entirely specific—in order to actually measure one, you would need to also for instance specify how the information would reach you. For instance, “cotton ginned per day by users, as claimed in a source findable by us within one day of searching online”.)\n\n\nWe choose both general areas to investigate, and particular metrics according to:\n\n\n* Apparent likelihood of containing discontinuous progress (e.g. because it was suggested to us in a bounty submission[4](https://aiimpacts.org/methodology-for-discontinuity-investigation/#easy-footnote-bottom-4-1656 \"We initially posted a bounty on discontinuous technologies. We have not investigated all of the submissions yet, and are yet to pay out bounties on suggestions we recently found to be discontinuous.\"), suggestions from readers and friends, and our own understanding.[/note], or by readers.)\n* Ease of collecting clear data (e.g. because someone pointed us to a dataset, or because we could find one easily). We often began investigating a metric and then set it aside to potentially finish later, or gave up.\n* Not seeming trivially likely to contain discontinuities for uninteresting reasons. For instance we expect the following to have a high number of discontinuities, which do not seem profitable to individually investigate:\n\t+ obscure metrics constructed to contain a discontinuity (e.g. Average weekly rate of seltzer delivery to Katja’s street from a particular grocery store over the period during which Katja’s household discovered that that grocery store had the cheapest seltzer)\n\t+ metrics very far from anyone’s concern (e.g. number of live fish in Times Square)\n\t+ metrics that are very close to metrics we already know contain discontinuities (e.g. if explosive power per gram of material sees a large discontinuity, then probably explosive power per gram of material divided by people needed to detonate bomb would also see a large discontinuity.)\n\n\nOur goal with the project was to understand roughly how easy it is to find large discontinuities, and to learn about the situations in which they tend to arise, rather than to clearly assess the frequency of discontinuities within a well-specified reference class of metrics (which would have been hard, for instance because good data is rarely available). Thus we did not follow a formal procedure for selecting case studies. One important feature of the set of case studies and metrics we have is that they are likely to be heavily skewed in favor of having more large discontinuities, since we were explicitly trying to select discontinuous technologies and metrics.\n\n\n### Data collection\n\n\nMost data was either from a particular dataset that we found in one place, or was gathered by AI Impacts researchers.\n\n\nWhen we gathered data ourselves, we generally searched for sources online until we felt that we had found most of what was readily available, or had at least investigated thoroughly the periods relevant to whether there were discontinuities. For instance, it is important to know about the trend just prior to an apparent discontinuity, than it is to know about the trend between two known records, where it is clear that little total progress has taken place.\n\n\nIn general, we report the maximal figures that we are confident of. i.e. we report the best known thing at each date, not the best possible thing at that date. So if in 1909 a thing was 10-12, we report 10, though we may note if we think 12 is likely and it makes a difference to the point just after. If all we know is that progress was made between 2010 and 2015, we report it in 2015.\n\n\n### Discontinuity calculation\n\n\nWe measure discontinuities in terms of how many years it would have taken to see the same amount of progress, if the previous trend had continued. \n\n\nTo do this, we:\n\n\n* Decide which points will be considered as potential discontinuities\n* Decide what we think the previous trend was for each of those points\n\t+ Determine the shape of the previous curve\n\t+ Estimate the growth rate of that curve\n* Calculate how many years the previous trend would need to have continued to see as much progress as the new point represents\n* Report as ‘discontinuities’ all points that represented more than ten years of progress at previous rates\n\n\n#### Requirements for measuring discontinuities\n\n\nSometimes we exclude points from being considered as potential discontinuities, though include them to help establish the trend. This is usually because:\n\n\n* We have fewer than two earlier points, so no prior trend to compare them to\n* We expect that we are missing prior data, so even if they were to look discontinuous, this would be uninformative.\n* The value of the metric at the point is too ambiguous\n\n\nSometimes when we lack information we still reason about whether a point is a discontinuity. For instance, we think the Great Eastern very likely represents a discontinuity, even though we don’t have an extensive trend for ship size, because we know that a recent Royal Navy ship was the largest ship in the world, and we know the trend for Royal Navy ship size, which the trend for overall ship size cannot ever go below. So we can reason that the recent trend for ship size cannot be any steeper than that of Royal Navy ship size, and we know that at that rate, the Great Eastern represented a discontinuity.\n\n\n#### Calculating previous rates of progress\n\n\n##### Time period selection and trend fitting\n\n\nAs history progresses, a best guess about what the trend so far is can change. The best guess trend might change apparent shape (e.g. go from seeming linear to seeming exponential) or change apparent slope (e.g. what seemed like a steeper slope looks after a few slow years like noise in a flatter slope) or change its apparent relevant period (e.g. after multiple years of surprisingly fast progress, you may decide to treat this as a new faster growth mode, and expect future progress accordingly). \n\n\nWe generally reassess the best guess trend so far for each datapoint, though this usually only changes occasionally within a dataset.\n\n\nWe have based this on researcher judgments of fit, which have generally had the following characteristics:\n\n\n* Trends are expected to be linear or exponential unless they are very clearly something else. We don’t tend search for better fitting curves.\n* If curves are not upward curving, we tend to treat them as linear\n* In ambiguous cases, we lean toward treating curves as exponential\n* When there appears to be a new a newer faster growth mode, we generally recognize this and start a new trend at the third point (i.e. if there has been one discontinuity we don’t immediately treat the best guess for future progress as much faster, but after two in a row, we do).\n\n\nWe color the growth rate column in the spreadsheets according to periods where the growth rate is calculated as having the same overall shape and same starting year (though within those periods, the calculated growth rate changes as new data points are added to the trend).\n\n\n##### Trend calculation\n\n\nWe calculate the rate of past progress as the average progress between the first and last datapoints in a subset of data, rather than taking a line of best fit. (This being a reasonable proxy for expected annual progress is established via trend selection described in the last section.)\n\n\n#### Discontinuity measurement\n\n\nFor each point, we calculate how much progress it represents since the last point, and how many years of progress that is according to the past trend, then subtract the number of years that actually passed, for the discontinuity size.\n\n\nThis means that if no progress is seen for a hundred years, and then all of the progress expected in that time occurs at once, this does not count as a discontinuity. \n\n\n#### Reporting discontinuities\n\n\nWe report discontinuities as ‘substantial’ if they are at least ten years of progress at once, and ‘large’ if they are at least one hundred years of progress at once.\n\n\n### ‘Robust’ discontinuities\n\n\nMany developments classified as discontinuities by the above methods are ahead of a best guess trend, but unsurprising because the data should have left much uncertainty about the best trend. For instance, if the data does not fit a consistent curve well, or is very sparse, one should be less surprised if a new point fails to line up with any particular line through it.\n\n\nIn this project we are more interested in clear departures from established trends than in noisy or difficult to extrapolate trends, so a researcher judged each discontinuity as a clear divergence from an established trend or not. We call discontinuities judged to clearly involve a departure from an established trend ‘robust discontinuities’.\n\n\n\n*See the project’s [main page](https://aiimpacts.org/discontinuous-progress-investigation/) for authorship and acknowledgements.*\n\n\n\n", "url": "https://aiimpacts.org/methodology-for-discontinuity-investigation/", "title": "Methodology for discontinuous progress investigation", "source": "aiimpacts.org", "source_type": "wordpress", "date_published": "2019-06-05T19:55:08+00:00", "paged_url": "https://aiimpacts.org/feed?paged=11", "authors": ["Asya Bergal"], "id": "b19a75248b1e5aaaff2bf172ba54424b", "summary": []}
{"text": "Historic trends in particle accelerator performance\n\n*Published Feb 7 2020*\n\n\nNone of particle energy, center-of-mass energy nor Lorentz factor achievable by particle accelerators appears to have undergone a discontinuity of more than ten years of progress at previous rates. \n\n\nDetails\n-------\n\n\nThis case study is part of AI Impacts’ [discontinuous progress investigation](https://aiimpacts.org/discontinuous-progress-investigation/).\n\n\n### Background\n\n\n[Particle accelerators](https://en.wikipedia.org/wiki/Particle_accelerator) propel charged particles at high speeds, typically so that experiments can be conducted on them.[1](https://aiimpacts.org/particle-accelerator-performance-progress/#easy-footnote-bottom-1-1350 \"“A particle accelerator is a machine that uses electromagnetic fields to propel charged particles to very high speeds and energies, and to contain them in well-defined beams. Large accelerators are used for basic research in particle physics.” – “Particle Accelerator”. 2019. En.Wikipedia.Org. Accessed June 30 2019. https://en.wikipedia.org/w/index.php?title=Particle_accelerator&oldid=903597299.\")\nFermi National Laboratory particle accelerator[2](https://aiimpacts.org/particle-accelerator-performance-progress/#easy-footnote-bottom-2-1350 \"From Wikimedia Commons:
Fermilab, Reidar Hahn [Public domain] \")\n### Trends\n\n\nOur understanding is that key performance metrics for particle accelerators include how much kinetic energy they can generate in particles, how much center-of-mass energy they can create in collisions between particles, and the [Lorentz factor](https://en.wikipedia.org/wiki/Lorentz_factor) they can achieve. \n\n\n‘Livingston charts’ show progress in particle accelerator efficacy over time, and seem to be common. We took data from a relatively recent and populated one in a slide deck from a Cornell accelerator physics course (see slide 45),[3](https://aiimpacts.org/particle-accelerator-performance-progress/#easy-footnote-bottom-3-1350 \"Hoffstaetter 2019. Classe.Cornell.Edu. Accessed June 30 2019. https://www.classe.cornell.edu/~hoff/LECTURES/10USPAS/notes01.pdf., Slide 45\") and extracted data from it, shown in [this spreadsheet](https://docs.google.com/spreadsheets/d/1fsEV5vtdArk6Q0RqAacmrErDif3x7O1JcPOn3BqIBY0/edit?usp=sharing) (see columns ‘year’ and ‘eV’ in tabs ‘Hoffstaetter Hadrons’ and ‘Hoffstaetter Leptons’ for original data). \n\n\nThe standard performance metric in a Livingston chart is ‘energy needed for a particle to hit a stationary proton with the same center of mass energy as the actual collisions in the accelerator’. We are uncertain why this metric is used, though it does allow for comparisons to earlier technology in a way that CM energy does not. We used a Lorentz transform to obtain particle energy, center-of-mass energy, and Lorentz factors from the Livingston chart data.[4](https://aiimpacts.org/particle-accelerator-performance-progress/#easy-footnote-bottom-4-1350 \"A Lorentz transform allows us to recalculate velocities with a changed frame of reference, taking into account special relativity, which is a material consideration for such fast-moving objects.
.jpg\\\")
See Rick Korzekwa’s explanation of his calculation of this here: https://docs.google.com/document/d/1Nv-0Jg6lMNobcDbfuruLwA8hYCXiPvq32f3NHz0BCLs/edit?usp=sharing\")\n#### Particle energy\n\n\n##### Data\n\n\n Figure 1 shows our data on particle energy over time, also available in [our spreadsheet](https://docs.google.com/spreadsheets/d/1fsEV5vtdArk6Q0RqAacmrErDif3x7O1JcPOn3BqIBY0/edit?usp=sharing), tab ‘Particle energy’.\n\n\n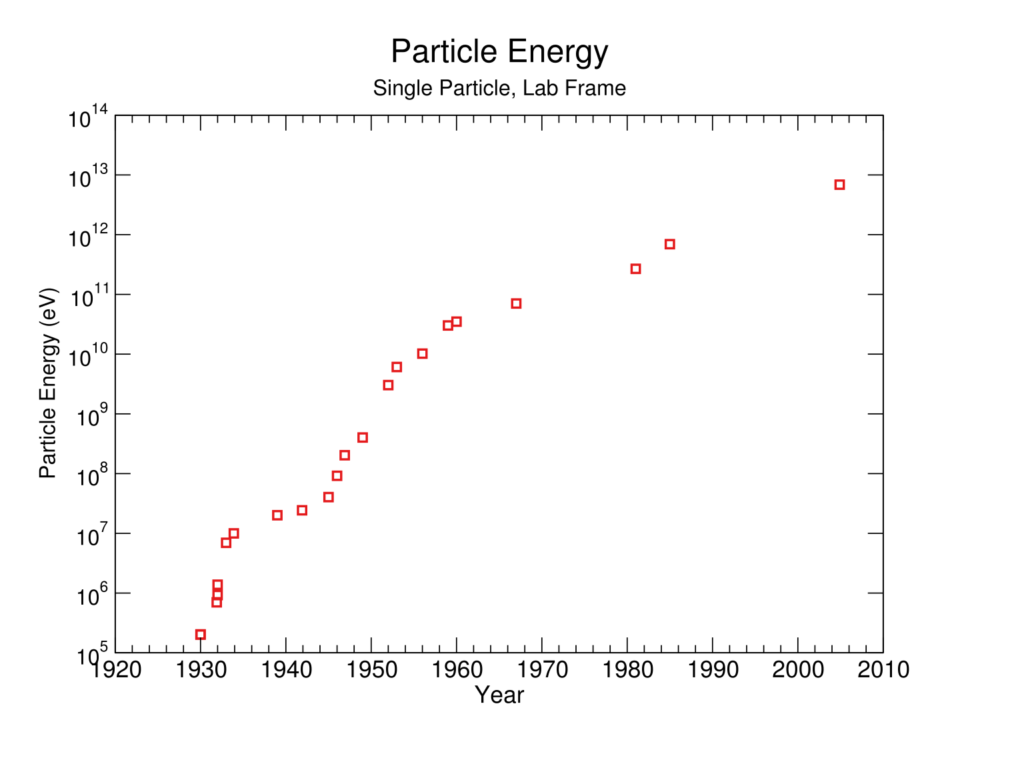Figure 1: Particle energy in eV over time\n##### Discontinuity measurement\n\n\nWe chose to model the data as a single exponential trend.[5](https://aiimpacts.org/particle-accelerator-performance-progress/#easy-footnote-bottom-5-1350 \"See our methodology page for more details.\") There are no greater than 10-year discontinuities in particle energy at previous rates within this trend.[6](https://aiimpacts.org/particle-accelerator-performance-progress/#easy-footnote-bottom-6-1350 \"See our methodology page for more details, and our spreadsheet, tab ‘Particle energy’ for our calculation of discontinuities.\")\n#### Center-of-mass energy\n\n\n##### Data\n\n\nFigure 2 shows our data on center-of-mass energy over time, also available in [this spreadsheet](https://docs.google.com/spreadsheets/d/1fsEV5vtdArk6Q0RqAacmrErDif3x7O1JcPOn3BqIBY0/edit?usp=sharing), tab ‘CM energy’.\n\n\n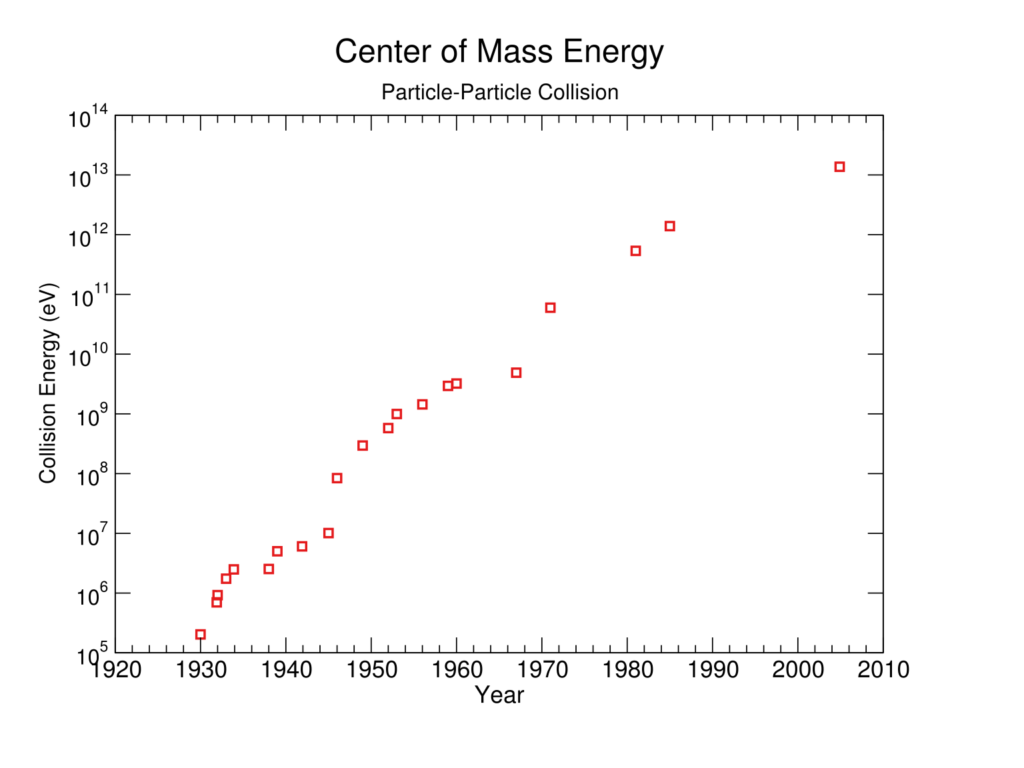Figure 2: Center-of-mass energy in eV over time\n##### Discontinuity measurement\n\n\nWe treated the data as exponential.[7](https://aiimpacts.org/particle-accelerator-performance-progress/#easy-footnote-bottom-7-1350 \"See our methodology page for more details.\") There are no greater than 10-year discontinuities in center-of-mass energy at previous rates within this trend.[8](https://aiimpacts.org/particle-accelerator-performance-progress/#easy-footnote-bottom-8-1350 \"See our methodology page for more details, and this spreadsheet, tab ‘CM energy’ for our calculation of discontinuities.\")\n#### Lorentz factor\n\n\nAccording to Wikipedia, ‘[The Lorentz factor](https://en.wikipedia.org/wiki/Lorentz_factor) or Lorentz term is the factor by which time, length, and relativistic mass change for an object while that object is moving.’ \n\n\n##### Data\n\n\n[This spreadsheet](https://docs.google.com/spreadsheets/d/1fsEV5vtdArk6Q0RqAacmrErDif3x7O1JcPOn3BqIBY0/edit#gid=654930714), tab ‘Lorentz factor’, shows our calculated data for progress on Lorentz factors attained over time.\n\n\n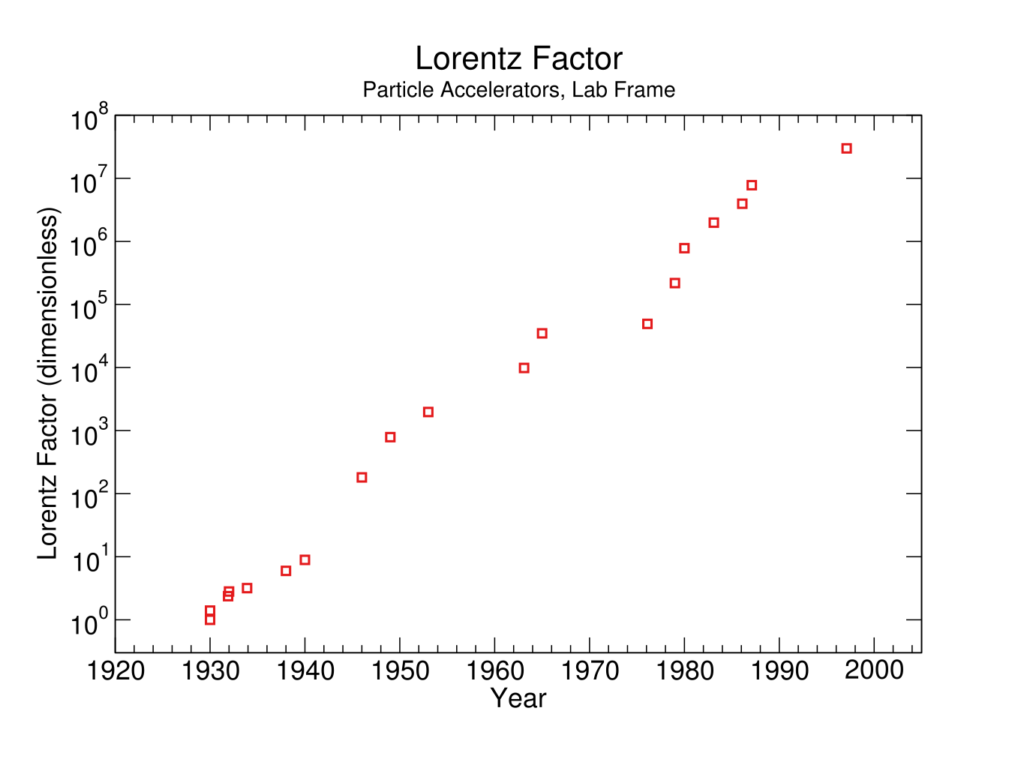 Figure 3: Lorentz factor (gamma) over time. \n##### Discontinuity measurement\n\n\nWe treated the data as one exponential trend.[9](https://aiimpacts.org/particle-accelerator-performance-progress/#easy-footnote-bottom-9-1350 \"See our methodology page for more details.\") There were no greater than 10-year discontinuities at previous rates within this trend.[10](https://aiimpacts.org/particle-accelerator-performance-progress/#easy-footnote-bottom-10-1350 \"See our methodology page for more details, and our spreadsheet, tab ‘Lorentz factor’ for our calculation of discontinuities.\")\n*Primary author: Rick Korzekwa*\n\n\nNotes\n-----\n\n\n\n\n\n\n\n\n\n\n\n\n", "url": "https://aiimpacts.org/particle-accelerator-performance-progress/", "title": "Historic trends in particle accelerator performance", "source": "aiimpacts.org", "source_type": "wordpress", "date_published": "2019-03-27T00:07:42+00:00", "paged_url": "https://aiimpacts.org/feed?paged=11", "authors": ["Katja Grace"], "id": "10948d19e792fc48608de3835c12d28e", "summary": []}
{"text": "AI conference attendance\n\nSix of the largest seven AI conferences hosted a total of 27,396 attendees in 2018. Attendance at these conferences has grown by an average of 21% per year over 2011-2018. These six conferences host around six times as many attendees as six smaller AI conferences.\n\n\nDetails\n-------\n\n\n[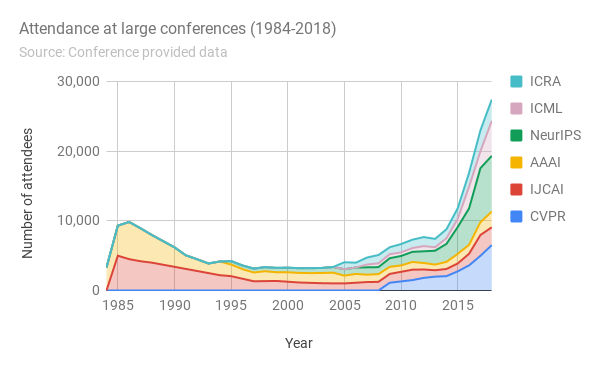](http://aiimpacts.org/wp-content/uploads/2019/03/Attendance-at-large-conferences-1984-2018-3.png)Data from AI Index. The conference IROS is excluded because AI Index did not have data for them in 2018. IROS had 2,678 attendees in 2017, so this does not dramatically change the graph.\nArtificial Intelligence Index reports on this, from data they collected from conferences directly.[1](https://aiimpacts.org/ai-conference-attendance/#easy-footnote-bottom-1-1334 \"Artificial Intelligence Index 2018 Report, p26-27, Our copy of their spreadsheet, with some changes is here (http://cdn.aiindex.org/2018/AI%20Index%202018%20Annual%20Report.pdf)\") We extended their spreadsheet to measure precise growth rates, and visualize the data differently (data [here](https://docs.google.com/spreadsheets/d/15PnVTrBLTk5IxFKaJ6Dtgr7nOWZTxiBdXb1N4Byfh3c/edit?usp=sharing)). They are missing 2018 data for IROS, so while we include it in Figure 1, we excluded it from the growth rate calculations.\n\n\nFrom their spreadsheet we calculate:\n\n\n\n\n\n\n| Large conferences (>2000 2018 participants) total participants | 27,396 |\n| Small conferences (<2000 2018 participants) total participants | 4,754 |\n\n\nThis means large conferences have 5.9 times as many participants as smaller conferences.\n\n\nAccording to this data, total large conference participation has grown by a factor 3.76 between 2011 and 2019, which is equivalent to a factor of 1.21 per year during that period.\n\n\nReferences\n----------\n\n", "url": "https://aiimpacts.org/ai-conference-attendance/", "title": "AI conference attendance", "source": "aiimpacts.org", "source_type": "wordpress", "date_published": "2019-03-07T00:44:04+00:00", "paged_url": "https://aiimpacts.org/feed?paged=12", "authors": ["Katja Grace"], "id": "7f07a2dcc4c7ea105603ab0e36ab884f", "summary": ["This post presents data on attendance numbers at AI conferences. The main result: \"total large conference participation has grown by a factor 3.76 between 2011 and 2019, which is equivalent to a factor of 1.21 per year during that period\". Looking at the graph, it seems to me that the exponential growth started in 2013, which would mean a slightly higher factor of around 1.3 per year. This would also make sense given that the current boom is often attributed to the publication of AlexNet in 2012."]}
{"text": "Historical economic growth trends\n\nAn analysis of historical growth supports the possibility of radical increases in growth rate. Naive extrapolation of long-term trends would suggest massive increases in growth rate over the coming century, although growth over the last half-century has lagged very significantly behind these long-term trends.\n\n\nSupport\n-------\n\n\nBradford DeLong [has published](http://holtz.org/Library/Social%20Science/Economics/Estimating%20World%20GDP%20by%20DeLong/Estimating%20World%20GDP.htm) estimates for historical world GDP, piecing together data on recent GDP, historical population estimates, and crude estimates for historical per capita GDP. We have not analyzed these estimates in depth, but they appear to be plausible. (Robin Hanson [has expressed](http://hanson.gmu.edu/longgrow.html) complaints with the population estimates from before 10,000 BC, but our overall conclusions do not seem to be sensitive to these estimates.)\n\n\nThe raw data produced by DeLong, together with log-scale graphs of that data, are available [here](https://docs.google.com/spreadsheets/d/1vyKWVp_RImFzru_4X3KPEW6kD86TllkxRB2fgWwhnxA/edit?usp=sharing) (augmented with one data point for 2013 found in the [CIA world factbook](https://www.cia.gov/library/publications/the-world-factbook/geos/xx.html), population data from the US census bureau via [Wikipedia](http://en.wikipedia.org/wiki/World_population#cite_note-USCBcite-1), and the website [usinflationcalculator](http://www.usinflationcalculator.com/)). Note that brief periods of negative growth have not been indicated, and that we have used what DeLong refers to as “ex-nordhaus” data, neglecting quality-of-life adjustments arising from improvements in the diversity of goods.\n\n\n[](https://sites.google.com/site/aiimpactslibrary/historical-growth-trends/HistoricalGrowth.png?attredirects=0)Figure 1: The relationship of GWP and doubling time, historically. Note that the x-axis is log(GWP), not time—date lines mark GWP at those dates.\nThe data suggest that (proportional) rates of economic and population growth increase roughly linearly with the size of the world economy and population. Certainly, a constant rate of growth is a poor model for the data, as growth rates range over 5 orders of magnitude; rather, the data appear to be consistent with substantially superlinear returns to scale, such that doubling the size of the world multiplies the absolute rate of growth by 21.5 – 21.75(as opposed to 2, which would be expected by exponential growth).\n\n\nExtrapolating this model implies that at a time when the economy is growing 1% per year, growth will diverge to infinity after about 200 years. This outcome of course seems impossible, but this does suggest that the historical record is consistent with relatively large changes in growth rate, and in fact rates of economic growth experienced today are radically larger (even proportionally) than those experienced prior to the industrial revolution.\n\n\nFrom around 0 to 500 CE, the predicted divergence occurs between 1700 and 2000, from 500 to 1000 CE it occurs around 2100, and from 1300 to 1950 it occurred in the later part of the 20th century.\n\n\nIn fact growth has fallen substantially behind this trend over the course of the 20th century; growth has continued but the acceleration of growth has slowed substantially (indeed reversing itself over the last 50 years). Moreover, it is unclear to us whether historically increasing returns to scale reflect returns to *economic* scale, or *population* scale, and if the latter then a profound slowdown seems likely–population growth rates seem to robustly fall at very high levels of development, and at any rate doubling times much shorter than 10-20 years would require radical changes in fertility patterns.[1](https://aiimpacts.org/historical-growth-trends/#easy-footnote-bottom-1-102 \"“Most developed countries have completed the demographic transition and have low birth rates; most developing countries are in the process of this transition.[2][3] The major (relative) exceptions are some poor countries, mainly in sub-Saharan Africa and some Middle Eastern countries, which are poor or affected by government policy or civil strife, notably, Pakistan, Palestinian territories, Yemen, and Afghanistan.” – Demographic Transition, Wikipedia, 6 March 2019, https://en.wikipedia.org/wiki/Demographic_transition\") That said, any such biologically contingent dynamics might be modified in a world where machine intelligence can substitute for human labor. Our impression is that this slowdown has been the subject of extensive inquiry by economists, but we have not reviewed this literature.\n\n\nImplications\n------------\n\n\nOverall, it seems unclear how much weight one should place on historical trends in predicting the future, and it seems unclear whether we should focus on very long-term trends of accelerating growth or short-term trends of stagnant growth (at least as measured by GDP). However, at a minimum it seems that extrapolation from history is consistent with extreme increases in the growth rate.\n\n", "url": "https://aiimpacts.org/historical-growth-trends/", "title": "Historical economic growth trends", "source": "aiimpacts.org", "source_type": "wordpress", "date_published": "2019-03-06T08:06:27+00:00", "paged_url": "https://aiimpacts.org/feed?paged=12", "authors": ["Katja Grace"], "id": "f482d7030ae32f7e7bdf5b136c20b257", "summary": ["Data on historical economic growth \"suggest that (proportional) rates of economic and population growth increase roughly linearly with the size of the world economy and population\", at least from around 0 CE to 1950. However, this trend has not held since 1950 - in fact, growth rates have fallen since then."]}
{"text": "Primates vs birds: Is one brain architecture better than the other?\n\n*By Tegan McCaslin, 28 February 2019*\n\n\nThe boring answer to that question is, “Yes, birds.” But that’s only because birds can pack more neurons into a walnut-sized brain than a monkey with a brain four times that size. So let’s forget about brain volume for a second and ask the really interesting question: neuron per neuron, who’s coming out ahead?\n\n\nYou might wonder why I picked birds and primates instead of, say, dogs and cats, or mice and elephants, or any other pair of distinct animals. But check out this mouse brain:\n\n\n[](http://aiimpacts.org/wp-content/uploads/2019/02/mouse-brain-image.png)[By [Mamunur Rashid – Own work, CC BY 4.0](https://commons.wikimedia.org/w/index.php?curid=64106364)]\nSee how, on the outside of the lobe (the part closer to the upper righthand corner), you can pick out a series of stripes in a neat little row? Those stripes are the six layers of the neocortex, a specifically mammalian invention—all mammals have it, and no one else does. People have been pointing to this structure to explain why we’re so much better than fish since the [*scala naturae*](https://en.wikipedia.org/wiki/Great_chain_of_being) fell out of favor. \n\n\nAnd that would be a pretty convenient story if birds hadn’t come along and messed the whole picture up. If you look at a similar cross section of a bird’s brain, it kind of just looks like a structureless blob. For a long time, comparative neuroanatomists thought birds must be at a more primitive stage of brain evolution, with no cortex but *huge* basal ganglia (the bit that we have sitting under our own fancy cortex). But we’ve since realized that this “lower” structure is actually a totally different, independently-evolved form of cortex, which seems to control all the same areas of behavior that mammalian cortex does. In fact, birds have substantially more of their brain neurons concentrated in their cortices than we mammals have in ours. \n\n\nAlright, so it’s not that surprising that another form of cortical tissue exists in nature. But could it really work as well as *ours*? Surprisingly, no one has really tried to figure this out before.\n\n\nIf, for instance, primates were head and shoulders above birds, that might mean that intelligent brains aren’t *just* energetically expensive (in terms of the energy required for developing and operating neurons), they’re also exceptionally tricky to get right from a design standpoint. Of course, if bird and primate architectures worked equally well, that doesn’t mean brains are easy to get right–it would just mean that evolution happened to stumble into two independent solutions around 100 million years ago. Still, that would imply substantially more flexibility in neural tissue architectures than the world in which one tissue architecture outstripped all others.\n\n\nAnswering the question of birds vs. primates conclusively would be an enormous undertaking (and to be honest, answering it inconclusively was a pretty big pain already), so instead I focused on a very small sample of species in a narrow range of brain sizes and tried to get a really good sense of how smart those animals in particular were, relative to one another. I also got 80+ other people (non-experts) to look at the behavioral repertoire of these animals and rank how cognitively demanding they sounded. \n\n\nWith my methodology of just digging through all of the behavioral literature I could find on these species, full and representative coverage of their entire behavioral repertoire was a major challenge, and I think it fell well short of adequate in some categories. This can be a big problem if an animal only displays its full cognitive capacities in one or a few domains, and worse, you might not even know which those are. I think this wasn’t as big an issue with the species I studied as it could have been, since we have pretty good priors with respect to what selective pressures drove cognitive development in the smartest animals (like primates and parrots). Plus, scientists are much more likely to study the most complex and interesting behaviors, and those are very often the ones that display the most intelligence.\n\n\nOne of the behaviors scientists are really keen on is tool use. Our survey participants seemed to like it too, because they rated its importance higher than any other category, and it ended up being the most discriminatory behavior, too–neither the small-brained monkey nor the small-brained parrot had recorded examples of tool use in the wild, while both of the larger-brained animals did.\n\n\nIn the end, people didn’t seem to think the two primate species I included acted smarter than the two bird species or vice versa, but did think the larger-brained animals acted smarter than the smaller-brained animals. The fact that this surveying method both confirmed my intuitions and didn’t seem *totally* overwhelmed by noise kind of impressed me, because who knew you could just ask a bunch of random people to look at some animal behaviors and have them kind of agree on what the smartest were? That said, we didn’t validate it against anything, and even though we have reasons to suspect this method works as intended (see the full article), how well and whether this was a good implementation aren’t clear.\n\n\nSo this is all pretty cool, but even if we could prove definitively that macaws and squirrel monkeys are smarter than grey parrots and owl monkeys, it’s not a knock-down argument for architecture space being chock full of feasible designs, or even for birds and primates having identical per-neuron cognitive capacity. It’s mostly just a demonstration that the old self-flattering dogma of primate exceptionalism doesn’t really hold water. But it also points to an interesting trend: instead of trying to tweak a bunch of parameters in brains to squeeze the best possible performance out of a given size, evolution seems to have gotten a lot of mileage out of just throwing more neurons at the problem.\n\n\nThere’s a lot more dirt [here](https://aiimpacts.org/investigation-into-the-relationship-between-neuron-count-and-intelligence-across-differing-cortical-architectures/), in the full analysis.\n\n", "url": "https://aiimpacts.org/primates-vs-birds-is-one-brain-architecture-better-than-the-other/", "title": "Primates vs birds: Is one brain architecture better than the other?", "source": "aiimpacts.org", "source_type": "wordpress", "date_published": "2019-03-01T01:26:24+00:00", "paged_url": "https://aiimpacts.org/feed?paged=12", "authors": ["Tegan McCaslin"], "id": "056efcfe51eaca9442353dd9319c948f", "summary": ["Progress in AI can be driven by both larger models as well as architectural improvements (given sufficient data and compute), but which of these is more important? One source of evidence comes from animals: different species that are closely related will have similar neural architectures, but potentially quite different brain sizes. This post compares intelligence across birds and primates: while primates (and mammals more generally) have a neocortex (often used to explain human intelligence), birds have a different, independently-evolved type of cortex. Using a survey over non-expert participants about how intelligent different bird and primate behavior is, it finds that there is not much difference in intelligence ratings between birds and primates, but that species with larger brains are rated as more intelligent than those with smaller brains. This only suggests that there are at least two neural architectures that work -- it could still be a hard problem to find them in the vast space of possible architectures. Still, it is some evidence that at least in the case of evolution, you get more intelligence through more neurons, and architectural improvements are relatively less important."]}
{"text": "Investigation into the relationship between neuron count and intelligence across differing cortical architectures\n\nSurvey participants (*n = 83*) were given anonymized descriptions of behavior in the wild for four animals: one bird species and one primate species with a similar neuron count, and one bird species and one primate species with twice as many neurons. Participants judged the two large-brained animals to display more intelligent behavior than the two smaller-brained animals on net, due to the large-brained animals’ substantial tool use being seen as a strong sign of intelligence, next to the small-brained animals absence of tool use. Other results were mixed. Participants did not judge either primates or birds to display more intelligent behavior. \n\n\n\n\n1. Background\n-------------\n\n\nThe existence of a correlation between brain size and intelligence across animal species is well-known (Roth & Dicke, 2005). Less clear is the extent to which brain size–in particular, neuron count–is responsible for differences in cognitive abilities between species. Here, we investigate one possible factor, the tissue organization of the cerebral cortex, by comparing cognitive abilities of animals with differing cortical architectures.\n\n\nPrimates make a natural target for comparison, since their intelligence has already been extensively studied. Additionally, comparing primate cognitive abilities to taxa that are farther from the human line may allow us to either confirm or deny the existence of a hard step for the evolvability of intelligence between primates and their last common ancestor with other large-brained animals (Shulman & Bostrom, 2012)[1](https://aiimpacts.org/investigation-into-the-relationship-between-neuron-count-and-intelligence-across-differing-cortical-architectures/#easy-footnote-bottom-1-1294 \"Due to the observer selection effect, the fact that the particular evolutionary line containing humans and directly related species (ie, primates) lead to high levels of intelligence is not sufficient evidence that intelligence is not hard for evolution to produce; another line evolving intelligence, independent of ourselves, represents much stronger evidence. (See Shulman & Bostrom 2012.)\"). Although some informal comparisons with other animals have been made, so far there have been few attempts to make detailed or quantitative comparisons between primate and non-primate intelligence.\n\n\nThere is only one extant alternative to primate cerebral architecture which has scaled to a similar size in terms of neuron count, that of birds, a lineage which diverged from our last common ancestor over 300 million years ago (for neuron counts of species across several lineages, see [here](https://en.wikipedia.org/wiki/List_of_animals_by_number_of_neurons)). Avian cortical architecture appears strikingly different from primates and indeed all mammals (see 1.1). However, compared to primates, radically less research effort has gone into investigating bird intelligence in a way that would enable comparison with other species. Therefore, in addition to theoretical difficulties (see 1.3), we also face the practical difficulty of comparing bird and primate intelligence without the aid of a rich psychometric literature, as exists for humans. Despite this difficulty, we believe that the comparison is nonetheless worthwhile, as it could give us insight into the flexibility of possible solutions to the problem of intelligence, given “hardware” of sufficient size.\n\n\nFor instance, if primates performed especially well relative to their absolute number of brain neurons or brain energy budget, this might indicate that primate cortical architecture (or some other systematic difference between primate and avian brains) was especially well-suited to producing intelligence. Furthermore, it would suggest that the evolution of biological intelligence faced design-related bottlenecks moreso than energy- or “hardware” bottlenecks. Likewise, if bird and primate architectures perform similarly despite different organization, this at the very least would indicate that the space of “wetware” architectures that lent themselves to the successful implementation of intelligence was larger than one. More speculatively, it could be taken as a sign that working brain architectures are fairly easy to come by, given a sufficient number of neurons and/or a sufficiently high brain energy budget.\n\n\n### 1.1 Mammalian vs avian brains: Similarities and differences\n\n\n[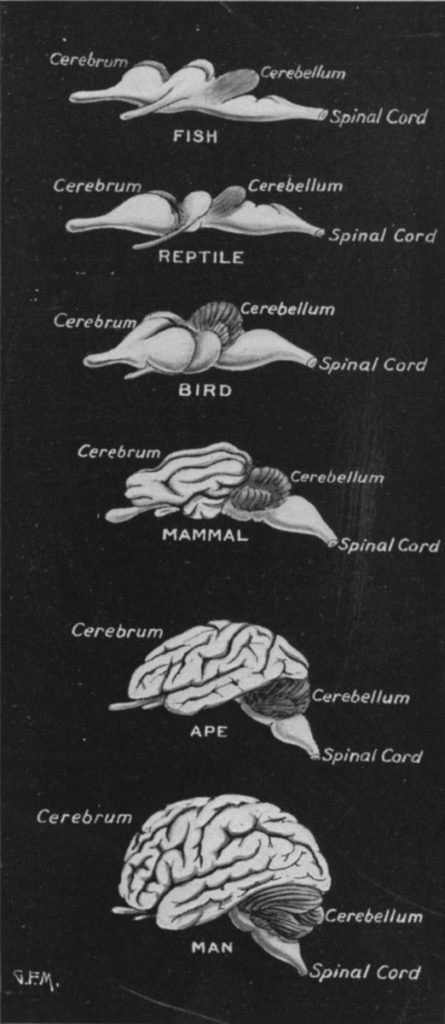](http://aiimpacts.org/wp-content/uploads/2019/02/fig1-animal-survey-page.jpg)**Figure 1**. Image by [J. Arthur Thomson](https://commons.wikimedia.org/w/index.php?curid=9943793) \n\n\n \n\n\nThe usefulness of the comparison between birds and primates relies on the degree to which the same resources (a particular quantity of brain neurons) are arranged differently. At a glance, the majority of tissue in the avian and primate brains appears to be quite different, as the structure which evolved after the divergence point 300 million years ago–the cerebral cortex–occupies ~80% of the volume of both avian and primate brains. However, there is nonetheless a great deal of overlap in non-cerebral structures, and there is even reason to believe that the cerebral cortex has more commonality between bird and primate than might naively be expected (Kaas, 2017).\n\n\nIn the central nervous system, the common structures shared by mammals and birds include the spinal cord, the hindbrain, and the midbrain. These regions are primarily responsible for non-cognitive processes such as autonomic, sensorimotor, and circadian functions. Although each of these structures underwent changes to accommodate differences in body plan, environment, and niche, they are overall quite similar. Additionally, they have an unambiguously homologous (that is, similar by virtue of common descent) relationship in birds and mammals (Güntürkün, Stacho, & Strockens, 2017). \n\n\nAtop the midbrain sits the forebrain, in particular the telencephalon, which is evolution’s most recent addition and the region which displays the most novel properties. The lower portion of the forebrain (the basal ganglia) is likely homologous between birds and mammals, but beyond this point the architectures diverge markedly. This uppermost layer is known as the pallium, or more commonly as the cerebral cortex in mammals.\n\n\nMost of the mammalian cerebral cortex can be classed as neocortex. Neocortex spans six horizontally-oriented [layers](https://en.wikipedia.org/wiki/Cerebral_cortex#Layers), with neurons organized into vertical columns, which may both interact with adjacent columns, and also send efferents (outgoing fibers) to distant columns or even locations farther afield in the nervous system. (However, some areas of mammalian cerebral cortex, such as parts of the hippocampus, have only three or four cell layers.) In contrast, the analogue to our neocortex in birds–the pallium–contains no layers or columns, and neurons are instead organized into nuclei. The extent to which the neocortex and the avian pallium are elaborations on pre-existing structures (and therefore homologous), versus de novo inventions of early mammals/birds, is still debated (Puelles et al., 2017). However, it is interesting to note that the most abundant type of neuron in mammalian cerebral cortex, the excitatory pyramidal cell, is also common in the avian pallium, having originated in an early vertebrate ancestor (Naumann & Laurent, 2017).\n\n\nThe most immediately obvious difference between mammalian brains and avian brains is their size. For an animal adapted for flight, bulk would have been particularly costly, and this pressure probably forced neurons to become smaller and more tightly packed, resulting in a small brain dense with neurons (Olkowicz et al., 2016). However, neurons in mammal brains are both large relative to comparably sized bird brains, and also scale with the size of the brain. The only mammalian order exempt from this neuron scaling rule is primates (Herculano-Houzel, Collins, Wong, & Kaas, 2007). Therefore, although they still possess larger neurons than those of birds, primates were able to increase neuron count relatively efficiently through brain size increases, and are less constrained than birds with regard to size and weight limits.\n\n\nAlthough it was reasoned that larger neurons would be more energetically expensive due to the maintenance cost of neurons even at rest, this has not been borne out empirically. At least in mammals, the per-neuron energy budget appears to be relatively constant within brain structures, and does not vary as a function of cell size (Herculano-Houzel, 2011). This finding has not been verified in birds, however the commonality of cell types across mammalian and avian brains suggests that it is likely true for birds as well. Interestingly, neuronal energy budget appears to differ substantially between brain structures: energy consumption by cerebral neurons, which are predominantly pyramidal cells, is an order of magnitude higher than that of cerebellar neurons, which are predominantly small granule cells.\n\n\nThis may have functional relevance for the final notable difference between primate and avian brains, the relative size of certain brain regions. While both bird and mammal brains are dominated volumetrically by the telencephalon (including the cerebral cortex/pallium), only in birds are the majority of neurons contained within this structure. In mammals, the densely-packed cerebellum expanded in tandem with the cerebrum,[2](https://aiimpacts.org/investigation-into-the-relationship-between-neuron-count-and-intelligence-across-differing-cortical-architectures/#easy-footnote-bottom-2-1294 \"Note that there are several overlapping anatomical terms here: the cerebrum, a mammalian structure, encompasses the cerebral cortex, the folded gray tissue visible on the outside of the lobes, and the connective white matter below it. The analogue in birds is the pallium. Below the cerebrum/pallium are the basal ganglia, and these structures collectively make up the telencephalon (the latest developing embryonic structure, and a part of the forebrain).\") while this structure remained relatively small in birds.\n\n\nThis is a topic of some curiosity, since the cerebellum was previously thought to simply control motor processes. The observation that it scaled proportionally to brain size may have contributed to the popularity of the “encephalization quotient”, based on the notion that the amount of brain tissue required to control a body scales with the size of the body. However, more recent findings suggest a [broader role](https://en.wikipedia.org/wiki/Cerebellum#Function) for the cerebellum in humans, including in cognitive functions. If the cerebellum made a substantial contribution to cognition, it would call to mind several possible scenarios.\n\n\nIt’s possible that after it was no longer useful to improve motor control, developmental or other constraints made changing the brain’s scaling rules to de-emphasize the cerebellum costly. Instead of reassigning the brain’s volume budget, perhaps cerebellar tissue was repurposed to serve cognitive functions which had been pushed out of the cerebrum, a structure which had already become crowded enough to resort to lateralizing functions (relegating certain domains, like language, to one side of the brain exclusively, in contrast to the default in animals of bilateral function). Since the cerebrum and cerebellum are extremely cytoarchitecturally dissimilar, sharing neither cell types nor organization, this would be evidence of generality of function across different neural tissue types. Indeed, it would be more impressive than if bird and mammal cortex were functionally equivalent, since a mammal’s cerebellum bears far less resemblance to its neocortex than its neocortex does to a bird’s pallium.\n\n\nAlternatively, birds may lack some novel functions which emerged in mammals as the result of the expanding cerebellum. Finally, the most disheartening possibility is that the extra cerebellar tissue in large-brained mammals represents an inferior allocation of brain tissue.\n\n\n### 1.2 Common models of brain-based intelligence differences between species\n\n\nHistorically, there was much popular support for the idea that differences in brain size tracked differences in intelligence between species. Several variations on this theme have also built a following in the past century, including encephalization quotient, brain-to-body ratio, and neuron count. These could be called the “More is Better” class of models, where increases in intelligence across species are attributed to greater absolute amounts of brain tissue, neurons, synapses, etc, or to greater amounts relative to some expected amount. \n\n\nAlthough among these models the most parsimonious currently appears to be neuron count (see [here](https://docs.google.com/document/d/1xBZbgz4hY4F31o52SHquERvhnr99dMDhIHDeS9xmyok/edit?usp=sharing) and Herculano-Houzel 2009), the intuitively appealing “relative size” models–encephalization quotient and brain-to-body ratio–may still have heuristic value in distinguishing between similarly-sized brains, despite lacking mechanistic explanatory power. This is because a relatively large investment in brain tissue compared to body size would imply stronger selection pressure for intelligence. However, in this case, the likely mechanism of the cognitive advantage falls under the next category.\n\n\nThe other class of models could be called “Structural Improvements”, where intelligence increases are attributed to improvements in brain architecture. At a gross brain level, the most popular of these models implicates the size of the forebrain, relative to the rest of the brain. Other possibilities in this space include tissue-level properties (such as whether cells are arranged into layers or nuclei), as well as much finer cytoarchitectural adjustments, altered developmental processes, functional properties of neurons, and features like gyrification (cortical folding).\n\n\nWhile it’s certainly the case that both quantitative and qualitative changes factored into the development of higher intelligence, the degree to which one or the other explains the variance between species is not well understood. This uncertainty is due in part to the difficulty of measuring animal intelligence across a collection of species diverse enough to differ in both quantitative and qualitative brain characteristics. (Additionally, our understanding of qualitative interspecific differences that are less apparent than the architectural differences we focus on here is currently rather poor.) Such a set of animal species would tend to vary not simply in characteristics related to intelligence, but also in body plan, physical abilities, temperament, accessibility for human study, and the evolutionary pressures favoring intelligence in the species.\n\n\nThe nature of the intelligence construct adds a further layer of obscurity. While the general factor (*g*) is well-accepted among intelligence researchers with regard to humans (Carroll, 1997), the body of evidence in non-humans–and especially in non-primates–is small and somewhat conflicting (Burkart, Schubiger, & van Schaik, 2017). Furthermore, it’s likely that assumptions of generality hold less well in animals with low cognitive capacity (for instance, in insects).\n\n\n### 1.3 Previous attempts to measure primate and avian intelligence\n\n\nOur knowledge of primate intelligence is primarily informed by a diverse body of laboratory tasks that attempt to measure various aspects of cognition. While any particular task is likely to be a relatively weak signal of overall intelligence on its own, combining this result with the results of dissimilar tasks will tend to improve the measure, as has been found in human intelligence testing. Very few studies have attempted to administer such a battery of intelligence tasks at the level of an individual non-human subject; however, a ‘species-level battery’ may be assembled from the single-task results that do exist. Especially when this ‘species-level battery’ is based on a small number of tests, care must be taken to ensure that the procedures for administering tasks were the same across species. Luckily, the large amount of primate cognition research conducted in the last century allows the construction of a battery according to these criteria. The measurement of primate intelligence is discussed further [here](https://docs.google.com/document/d/1xBZbgz4hY4F31o52SHquERvhnr99dMDhIHDeS9xmyok/edit?usp=sharing).\n\n\nIn comparison with primates, the collection of cognitive tests that have been administered to bird species is disappointingly sparse. There are few examples of directly comparable tasks that have been administered to multiple species, preventing the construction of a battery from laboratory tasks. Even rarer are tasks that would enable comparison between primate species and bird species.\n\n\nAn alternative methodology that has been validated in primates is based on observations of behavior in the wild. Because the cognitive abilities displayed in the laboratory are likely the result of behavioral adaptations to challenging physical or social environments, it stands to reason that certain species-typical behaviors should correlate with the average intelligence of the species; that is, species that act intelligent in the lab should act intelligent in the field. This approach was used by Reader and colleagues (2011), who found that the number of reports citing instances of several types of behavior (eg tool use, social learning) correlated with each other, supporting the existence of a general factor of intelligence in primates. Furthermore, these results correlated with the results of the laboratory test battery discussed above at 0.7.\n\n\n2. Estimating animal intelligence by survey: Methods\n----------------------------------------------------\n\n\nRather than conducting a comprehensive behavioral review across many genera, as Reader and colleagues did (see 1.3), we restricted our analysis to a small set of primates and birds which were matched for total neuron count. We then gathered behavioral observations from the academic literature on each species, attempting to draw evidence from all plausibly relevant domains of animal life, and used these to construct a questionnaire for ranking animal intelligence. This was then given to a small, non-random pilot sample, as well as a larger sample of Mechanical Turk workers. In addition to apparent difficulty of behaviors in several behavioral domains, participants were asked to rank the relevance of behavioral domains to intelligence, and this ranking was used to weight the within-domain scores. Where possible, we removed features of descriptions which would have identified an animal as a bird or a primate.\n\n\nAlthough far below the standard demanded of well-validated measures of intelligence,[3](https://aiimpacts.org/investigation-into-the-relationship-between-neuron-count-and-intelligence-across-differing-cortical-architectures/#easy-footnote-bottom-3-1294 \"(Reviewer’s note) In AI, the current state of the art for estimating distance-to-AGI is to look at the capabilities of various AI systems and use intuition to make a guess at how intelligent they are compared to the imagined AGI. In comparison to this, the methodology shown here is an improvement.\") we believe that the aggregated judgments of survey participants can offer some information about an agent’s intelligence due to the moderate correlation of peer-rated intelligence with measured IQ within humans. For instance, Bailey and Mettetal (1977) found that spouses’ ratings had a correlation of 0.6 with scores on the Otis Quick Scoring Test of Mental Ability, while Borkenau and Liebler (1993) found that acquaintances’ ratings had a correlation of 0.3 with test scores. Most impressively, they also found that strangers shown a short video of a subject reading from a script gave ratings of the subject’s intelligence that correlated at 0.38 with the subject’s actual test scores.\n\n\nThe problem of rating human intelligence from impressions is in some ways quite a different one from the rating of an unfamiliar species. One factor that could potentially make judgment of humans easier is that human society rewards intelligence by conferring certain forms of status differentially on those who display greater cognitive ability, in ways that are legible to both close associates (ie spouses) and total strangers. This means that individual raters are already benefiting from the aggregated judgments of many past raters (indeed, these positional signals may constitute the majority of evidence in low information situations like acquaintanceship). Additionally, humans have a natural point of reference for the behavior of other humans, and this familiarity probably allows much more accurate comparisons.\n\n\nHowever, judgment of other humans may also suffer from several disadvantages that judgment of nonhuman animals does not. Because humans in the same social group often occupy a relatively narrow range of the intelligence distribution, raters are asked to distinguish between differences in behavior that are small in absolute terms. For example, in the studies cited above, samples were drawn from college populations, which are famously range-restricted. Furthermore, raters of humans likely do not have the full range of behavior available to draw evidence from when considering strangers, acquaintances, or even spouses. In contrast, we attempted to capture all potentially relevant behavioral domains in data collection for our survey. Finally, as each others’ main social competitors, humans probably have stronger conflicts of interest in evaluating the intelligence of other humans, and thus may be disincentivized to make completely honest judgments.\n\n\nOverall, we expect our methodology to produce weaker results than what is possible for raters of human subjects, but not radically so. It should be noted that, because of the scarcity of psychometric data for the species studied, we were not able to verify a correlation with other measures of intelligence. However, it would be possible to validate some version of this methodology with species for which psychometric data does exist (see 4.2).\n\n\n### 2.1 Study object selection\n\n\nWe chose to study four animals: one larger-brained specimen of each of bird and primate, and one smaller-brained specimen of each. Having already established a strong relationship between brain size and intelligence within architecture types (see [here](https://docs.google.com/document/d/1xBZbgz4hY4F31o52SHquERvhnr99dMDhIHDeS9xmyok/edit?usp=sharing)), varying both architecture type and size allowed us to consider the degree to which one architecture type consistently outperformed the other–for instance, if the smaller version of one architecture outperformed both smaller and larger versions of the other architecture, this would more strongly suggest superiority due to structure than would a performance difference in two architectures of similar size.\n\n\nSince we were limited to only those species in which [neuron count is known](https://en.wikipedia.org/wiki/List_of_animals_by_number_of_neurons), and where there is overlap between birds and primates, we had only five primates to choose from, three of which had few instances of behavioral reports (the Northern greater galago, *Otolemur garnettii*; the common marmoset, *Callithrix jacchus*; and the gray mouse lemur, *Microcebus murinus*). \n\n\nOf the remaining primates, the squirrel monkey (*Saimiri sciureus*) was the larger-brained, with 3.2 billion neurons. Only one bird, the blue and yellow macaw (*Ara ararauna*) was reported as having a similarly large number of neurons, at 3.1 billion. The smaller-brained primate, the owl monkey (*Aotus trivirgatus*) has less than half this number of neurons at 1.5 billion, and was matched by both the grey parrot (*Psittacus erithacus*) at 1.6 billion and a corvid, the rook (*Corvus frugilegus*), at 1.5 billion. Because of the close evolutionary relationship between the two selected primates (~30 million years divergence time for *Saimiri* and *Aotus*, according to [TimeTree](http://www.timetree.org/)), we chose to focus on the parrots, who share a similar evolutionary relationship (~30 million years divergence time for *Ara* and *Psittacus*, versus ~80 million years for *Ara* and *Corvus*).\n\n\nIt was expected that the factor of two difference in neuron count between the larger- and smaller-brained samples would be substantial enough to provide some signal despite the noisy nature of behavioral data and analysis, without being so enormous as to render the results trivial. Supposing the relationship between intelligence and neuron count scaled logarithmically, the difference between our sample would be somewhat smaller than the difference between humans and chimpanzees, who differ by a factor of three. (In absolute terms, the neuron count difference is more comparable to neuron count differences between individual humans.) However, it is worth noting that, in our analysis of primate intelligence from lab tests, a factor of two difference was approximately the lower bound for reliably producing a difference in measured intelligence.\n\n\nBecause the features of a single species are often studied unevenly, we improved our coverage of the behavioral spectrum by broadening data collection to include all species in a genus. This is a common practice in the study of animal behavior, generally poses fewer problems than groupings at higher taxa, and prevented us from having to search multiple species names in cases where these had changed in the last century. Furthermore, although brain sizes varied somewhat within genera, the size distribution of the smaller-brained genera (*Aotus* and *Psittacus*) had little to no overlap with that of the larger-brained genera (*Saimiri* and *Ara*). Species in each genus with available brain size data are shown in the table below. It is probably the case that not all species listed in the table were represented in our data, and that some species were overrepresented within their genus, however in many cases the exact species was not specified in the source.\n\n\n\n\n| | | |\n| --- | --- | --- |\n| **Genus** | **Species/sample** | **Brain mass (g)** |\n| *Aotus* | *trivirgatus* (n = 2) | 15.7 |\n| | *trivirgatus* (other sources, n = 288) | 17.2 (SD = 1.6) |\n| | *azarai* (n = 6) | 21.1 |\n| | *lemurinus* (n = 34) | 16.8 |\n| *Saimiri* | *sciureus* (n = 2) | 30.2 |\n| | *sciureus* (other sources, n = 216) | 24.0 (SD = 2.0) |\n| | *boliviensis* (n = 3) | 25.7 |\n| | *oerstedii* (n = 81) | 21.4 |\n| *Psittacus* | *erithacus* (Olkowicz sample, n = 2) | 8.8 |\n| | *erithacus* (other sources, n = 1) | 6.4 |\n| *Ara* | *ararauna* (Olkowicz sample, n = 1) | 20.7 |\n| | *ararauna* (other sources, n = 20) | 17.0 |\n| | *chloropterus* (n = 7) | 22.2 |\n| | *hyacinthus* (n = 12) | 25.0 |\n| | *rubrogenys* (n = 4) | 12.1 |\n\n\n### 2.2 Behavioral data collection\n\n\nFor each genus, we searched English language journals for behavioral observations demonstrating learning, behavioral flexibility, problem-solving, social communication, and other traits that imply intelligence. We excluded observations that involved training or interaction with humans (such as [the Alex studies](https://en.wikipedia.org/wiki/Alex_(parrot))).\n\n\nA problematic element of this type of behavioral study is the disproportionate research effort focused on certain species over others, and in certain domains of behavior. While none of the animals studied had an especially large representation in the literature, *Aotus*, *Ara* and *Psittacus* were generally less well represented than *Saimiri*. In the case of *Psittacus*, a very large proportion of our data was drawn from two sources by a single author. Additionally, conventions regarding the way in which behavior was studied and which details of behavior were considered salient seemed to differ somewhat between ornithologists and primatologists. For instance, while the vocal repertoire and functional significance of vocalizations were frequently a topic of great interest to primatologists, at least in our sample, vocal communication was given a much more casual treatment by ornithologists. Therefore, our data may cause primates and birds to appear to have more qualitative differences in cognitive ability than actually exist.\n\n\nIn our analysis, we make no explicit attempt to correct for these differences in research effort, but do indicate areas of disproportionately high or low coverage of a species, and recommend that the reader bear these in mind when interpreting our results.\n\n\nAfter collection, the behavioral observations were sorted into eight functional categories, including three which primarily involved interaction with the environment (tool use, navigation/range, and shelter selection), and five involving social interaction (group dynamics, mate dynamics, care of young, play, and predation prevention). For the accompanying data for each genus, see [S1](https://docs.google.com/document/d/1rVBHRFtIZCb0rh84O5D0iUKBCa2T4BB1OYBpl3OY9Os/edit?usp=sharing). Below are full descriptions of the eight behavioral categories.\n\n\n#### 2.2.1 Tool use\n\n\nTool use involves the manipulation of an intermediate object to affect a final object. In more sophisticated instances of this behavior, the intermediate object is modified from its original form to better serve its intended purpose. Some degree of tool use is widely reported among great apes and certain corvids, and is seldom seen in “lower” animals (Smith & Bentley-Condit, 2010). Tool use may draw on cognitive abilities such as planning, means-end reasoning, spatial or mechanical reasoning, and creativity. (However, it cannot be assumed that apparent tool use demonstrates any of these abilities–some simple animals can use objects as “tools” in a highly inflexible, presumably hard-coded way which requires no learning.)\n\n\nDespite an extensive search, examples of tool use in the wild (or a wild-mimicking environment) were not found for either *Aotus* or *Psittacus*. However, since at least one of these animals (*Psittacus*) can display tool-using behaviors in environments with frequent human contact (for instance, in a laboratory or pet environment) (Janzen, Janzen, & Pond, 1976), it’s unlikely that that these animals have no capacity at all for developing tool use. Therefore, other explanations for the lack of tool use in the wild should be considered. For one, both species are somewhat more neophobic than *Saimiri* and *Ara*, and thus are less likely to interact with unfamiliar objects frequently enough to develop a use for them. Furthermore, both species are substantially less well-studied in the wild than *Saimiri* (but not *Ara*), and may simply use tools too infrequently or inconspicuously to be noticed. \n\n\nHowever, because of its relative rarity, spontaneous tool use is often taken to be “absent until proven present” in an animal species, and we have adhered to this convention in the present study. Readers who disagree with this approach may regard the scores of *Aotus* and *Psittacus* on this metric as a lower bound.\n\n\n#### 2.2.2 Navigation/range\n\n\nThe range and territory size of an animal are how far it typically travels on a day-to-day basis, and the total area in which its ranging happens, respectively. Since an animal that travels more distantly will encounter more different environments than one that travels less distantly, larger ranges or territory sizes could signal more behavioral flexibility. Additionally, large ranges or variable routes may be more taxing on memory.\n\n\nRelatively little information was available in this category for *Ara* and *Psittacus*. One might also expect that the skills required for navigation on land would differ substantially from those required for air navigation. In the final version of the survey, we consolidated this category with the following category.\n\n\n#### 2.2.3 Shelter selection\n\n\nWhere an animal chooses to rest or nest is one of the most frequent decisions it makes, and for prey animals may be one of the more important for survival. When searching for shelter, some optimization criteria may place large demands on perceptual or planning abilities, or on memory.\n\n\nIn the final version of the survey, we consolidated this category with the category above. While neither category alone was judged by participants to contain a large amount of evidence for intelligence, we hoped that combining the two would improve the signal and balance a survey heavy on social behaviors.\n\n\n#### 2.2.4 Group dynamics\n\n\nThe dynamics of group interaction vary dramatically between species, and frequently even within species in different geographic locations. Social group size of non-herding animals (that is, animals that do not affiliate with conspecifics merely to reduce predation risk) is thought to be correlated with intelligence, and some theories of the evolution of higher intelligence implicate social competition or cooperation as a primary driver (Dunbar, 1998). Furthermore, the range and flexibility of an animal’s vocal or visual communication may indicate the level of complexity of the species’ social life. Often, animals that have close or important relationships with their conspecifics engage in social grooming behaviors.\n\n\nDue to the amount and complexity of evidence that fell into this category, it was particularly difficult to consolidate these behaviors into a truly representative description of each species. In the final version of the survey, this category was consolidated into a new category, “Social dynamics”.\n\n\n#### 2.2.5 Mate dynamics\n\n\nMate dynamics includes sexual and pair bonding behavior, as well as behaviors relevant to sexual competition. Some examples of behavior that falls into this category are courtship behaviors, social grooming between mates, and joint territorial displays. Some pairbonded animals, particularly birds, engage in the majority of their social interactions with a mate, rather than with group members (Luescher, 2006).\n\n\nIn the final version of the survey, this category was consolidated into the category “Social dynamics”.\n\n\n#### 2.2.6 Care of young\n\n\nAs well as being an important social relationship in some species of animals, parent/offspring interaction during development generally holds clues about the degree to which learning influences an animal’s behavior, as well as whether an animal participates in social learning (that is, learning by mimicry or emulation of conspecifics) or trial-and-error learning. Longer development times and higher parental investment typically correlate with learning ability in a species.\n\n\n*Aotus* was not included in this comparison due to a lack of information. *Psittacus* and *Ara* had very poor representation in the literature compared to *Saimiri*. However, the category was retained due to its consistently high rating on the importance score.\n\n\n#### 2.2.7 Play\n\n\nPlay behavior is essentially a nonfunctional, simulated version of a functional behavior found in adult animals’ usual repertoire, and is more often seen in juvenile animals. Play probably exists to facilitate learning and practice of necessary skills, especially social ones. Play fighting is a very common form of play in social species.\n\n\nParticipants in our early Mechanical Turk sample did not find this category very informative, and indeed it is more a correlate of (or precursor to) intelligent behavior than intelligent in itself. It was therefore removed from the final version of the survey, although some details were preserved in the “Social dynamics” category. \n\n\n#### 2.2.8 Predation prevention\n\n\nAnimals evade predation through individual precautionary actions, threat signalling, and sometimes group coordination. Since offspring are both highly valuable and also more vulnerable to predation, much of the behavior in this category centers around defense of the nest. Associations between threat types and the amount of alarm appropriate may be learned to a greater or lesser degree in different species, as well as the proper form of the threat signal in the animal’s social group. Furthermore, threats may be classed into few or many types, facilitating greater or lesser nuance in response actions.\n\n\nParticipants in our early Mechanical Turk sample did not find this category very informative, and it was not easily subsumable into “Social dynamics”, so this category was struck from the final version of the survey.\n\n\n### 2.3 Survey construction and procedures\n\n\nWe synthesized the reports from each category into a representative summary of a species’ behavior in that domain. Where possible, this included any details that might indicate the degree to which behaviors were learned, demonstrated flexibility across different environmental conditions, or were apparently supported by particular cognitive strategies. The summaries were then used to construct a questionnaire which asked participants to rate the apparent intelligence of behaviors against other behaviors in that same category. Afterward, participants were asked which categories they thought contained the most evidence about intelligence, on a scale of one to five. The questionnaire was given to a small random sample of Mechanical Turk workers (*n = 12*), as well as a small nonrandom panel composed of myself, Paul Christiano, Finan Adamson, Carl Shulman, Chris Olah and Katja Grace. Later, the questionnaire was condensed into four sections (tool use, navigation/shelter selection, social dynamics, and care of young) and given to a larger sample of Mechanical Turk workers (*n = 104*).\n\n\nBecause the term “intelligence” is somewhat value-laden and tends to have many idiosyncratic meanings attached to it, we chose to use the word “cognitive complexity” in its place. The hope was that this would reduce conflation with “rationality” or “adaptiveness”, which are both common lay misunderstandings of the term. We also attempted to reduce bias in survey responses by blinding participants to properties not directly relevant to the behaviors being described (including brain size and, wherever possible, membership in the bird or primate class).\n\n\n#### 2.3.1 Pilot survey\n\n\nThe pilot survey included all eight categories of behavior, as well as longer and more detailed summaries. Mechanical Turk participants were selected through the platform [Positly](https://www.positly.com/), and the survey was administered using [Google Forms](https://www.google.com/forms/about/). Participants were asked to rate the behaviors presented on a 10 point scale against others in the same category, *not* against behaviors that had been presented in previous categories, and were given the option of providing commentary. Participants were also asked to rate categories against each other for evidence of intelligence on a five point scale. All questions from this version can be found in [S1](https://docs.google.com/document/d/1rVBHRFtIZCb0rh84O5D0iUKBCa2T4BB1OYBpl3OY9Os/edit?usp=sharing), and participant responses can be found in [S2](https://docs.google.com/spreadsheets/d/11aZRnx9z-4LHPhi4DQncegx8kLV1GkV8AFMidhshtMk/edit?usp=sharing).\n\n\nMechanical Turk data from this round of the survey was used to inform the abridgment of the final version. In particular, we removed or consolidated sections that had been rated by participants as less important, and adjusted the wording or level of detail on questions that seemed unclear to participants.\n\n\n#### 2.3.2 Final survey\n\n\nThe final version of the survey included four categories: tool use, navigation/shelter selection, social dynamics, and care of young. Social dynamics collapsed group dynamics, mate dynamics, and play. This version of the survey was administered via [GuidedTrack](https://www.guidedtrack.com/), and added mandatory wait times to pages as well as a free response question assessing comprehension of the task instructions. Analysis was restricted to participants who were not rated as having poor comprehension (*n = 77*). All questions in this version can be found in [S1](https://docs.google.com/document/d/1rVBHRFtIZCb0rh84O5D0iUKBCa2T4BB1OYBpl3OY9Os/edit?usp=sharing), and participant responses can be found in [S2](https://docs.google.com/spreadsheets/d/11aZRnx9z-4LHPhi4DQncegx8kLV1GkV8AFMidhshtMk/edit?usp=sharing).\n\n\n3 Estimating animal intelligence by survey: Results\n---------------------------------------------------\n\n\n#### 3.0.1 Pilot survey\n\n\nWe will present only the results from the small panel here, however the full data from this section can be found in the supplementary file. \n\n\nTool use, Group dynamics, and Play emerged as the most important categories, according to participant rating, with Navigation & range and Shelter selection rated as least important. Across most categories, especially those rated as more important, there was strong agreement that *Samiri*, *Ara* and *Psittacus* outranked *Aotus*. There was also reasonably good agreement that *Saimiri* and *Ara* outranked *Psittacus*. Finally, *Saimiri* generally outranked *Ara*, though the effect was less strong than in the other comparisons.\n\n\n[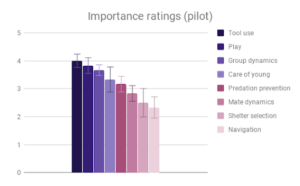](http://aiimpacts.org/wp-content/uploads/2019/02/fig6-animal-survey-page.png)\n\n\n[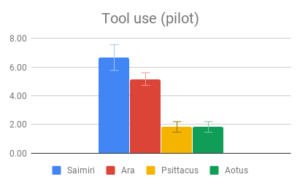](http://aiimpacts.org/wp-content/uploads/2019/02/fig5-animal-survey-page.png) [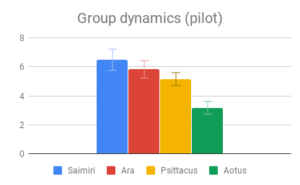](http://aiimpacts.org/wp-content/uploads/2019/02/fig4-animal-survey-page.png) 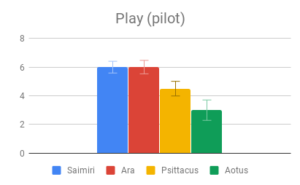[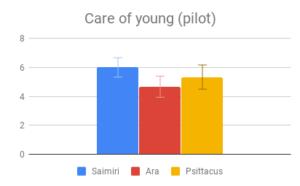](http://aiimpacts.org/wp-content/uploads/2019/02/fig3-animal-survey-page.png)\n\n\n \n\n\n**Figure 2:** *Fields without scores (“Care of young” for Aotus) indicate that insufficient data was found to compose a behavioral description for that animal.*\n\n\nGiven this data, participants appeared to find our small-brained primate, *Aotus*, to display the least intelligent behavior, and found our large-brained primate, *Saimiri*, to display the most intelligent behavior, although within a similar range to our large-brained bird, *Ara*. \n\n\n#### 3.0.2 Final survey\n\n\nAmong all four categories, participants reported that our descriptions of tool use provided the most evidence for intelligence, especially compared to the least informative category (Navigation and shelter selection). This aligned well with the pattern of answers within the category of Tool use, where there was strong agreement among participants on the rank order of Tool use behaviors, and the differences between Tool use behavior means were the largest of any category. The two larger-brained genera, *Saimiri* and *Ara*, were clear winners in this case, with participants reporting no significant difference between these two. \n\n\nSocial dynamics and Care of young were not clearly distinguishable from each other by importance rating, however participants responded quite differently to the evidence presented in these categories. All included genera (*Saimiri*, *Ara* and *Psittacus*) obtained about the same average score for Care of young, with no significant differences between them. However, for Social dynamics there were clear differences between the smaller-brained genera, *Aotus* and *Psittacus*, as well as the larger-brained bird and smaller-brained primate. Considering the borderline-significant comparison between *Saimiri* and *Ara* in this category (*p=0.06*), it would appear that participants rated birds slightly higher overall than primates on Social dynamics. Finally, Navigation and shelter selection was judged least important, but there were nonetheless clear differences in behavior scores between birds and primates, with primates outscoring birds, and no significant differences between sizes.\n\n\n \n\n\n\n\n| | | | | | | |\n| --- | --- | --- | --- | --- | --- | --- |\n| | | | Differences in means | | | |\n| Tool use vs Navigation / Shelter selection | Tool use vs Social dynamics | Tool use vs Care of young | Navigation / Shelter selection vs Social dynamics | Navigation / Shelter selection vs. Care of young | Social dynamics vs Care of young | |\n| **1.0 +-0.2 (p<0.001)** | **0.6 +-0.2 (p<0.001)** | **0.8 +-0.2 (p<0.001)** | **-0.4 +-0.2 (p<0.01)** | -0.2 +-0.2 (p=0.13) | 0.2 +-0.2 (p=0.32) | |\n\n\n \n\n\n\n\n| | | | | | | |\n| --- | --- | --- | --- | --- | --- | --- |\n| | Saimiri vs Ara | Saimiri vs Aotus | Saimiri vs Psittacus | Ara vs Aotus | Ara vs Psittacus | Aotus vs Psittacus |\n| Tool use | 0.1 +-0.4 (p=0.79) | **3.7 +-0.4 (p<0.001)** | (see Saimiri vs Aotus) | **3.6 +-0.4 (p<0.001)** | (see Ara vs Aotus) | NA |\n| Navigation / Shelter selection | **1.0 +-0.4 (p<0.01)** | -0.5 +-0.4 (p=0.29) | 0.5 +-0.4 (p=0.13) | **-1.5 +-0.4 (p<0.001)** | -0.5 +-0.3 (p=0.15) | **1.0 +-0.4 (p<0.01)** |\n| Social dynamics | -0.8 +-0.4 (p=0.06) | 0.6 +-0.4 (p=0.16) | -0.3 +-0.4 (p=0.51) | **1.4 +-0.4 (p<0.001)** | 0.5 +-0.4 (p=0.19) | **-0.9 +-0.4 (p<0.01)** |\n| Care of young | 0.1 +-0.3 (p=0.83) | Not measured | -0.3 +-0.3 (p=0.38) | Not measured | -0.4 +-0.3 (p=0.27) | Not measured |\n\n\n \n\n\n[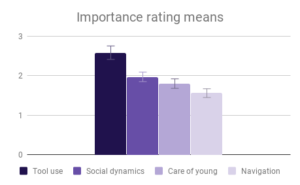](http://aiimpacts.org/wp-content/uploads/2019/02/fig7-animal-survey-page.png)\n\n\n[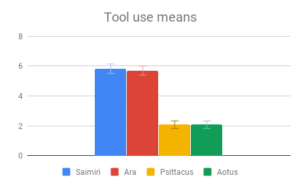](http://aiimpacts.org/wp-content/uploads/2019/02/fig8-animal-survey-page.png)[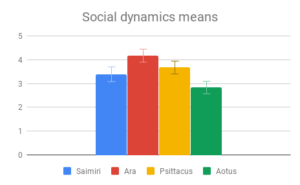](http://aiimpacts.org/wp-content/uploads/2019/02/fig9-animal-survey-page.png)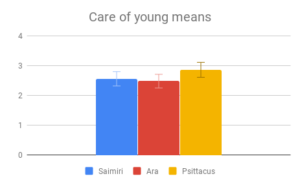 [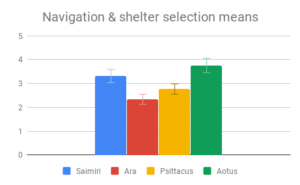](http://aiimpacts.org/wp-content/uploads/2019/02/fig11-animal-survey-page.png)\n\n\n**Figure 3:** *Fields without scores (“Care of young” for Aotus) indicate that insufficient data was found to compose a behavioral description for that animal.*\n\n\nOverall, participants in this sample seemed to find the largest and most important differences between the two large- and two small-brained animals, not between the two primates and two birds. However, they did rate the birds slightly higher on social behaviors, while the primates were rated slightly higher on Navigation and shelter selection.\n\n\nIt’s possible that since the Tool use section compared instances of a behavior with the absence of a similar behavior, differences in scoring may have been inflated, relative to comparison between a tool-using behavior and an unrelated behavior in a non-tool using animal. Indeed, it is probable that the non-tool using animals in our sample have some problem-solving behavior akin to tool use in their repertoire, which was simply subtle enough to go unremarked upon by investigators. This sort of behavior could be seen as a precursor to the development of spontaneous complex tool use, and is probably what enables captive *Psittacus* to learn to solve tool-type problems in a laboratory setting. It is nonetheless striking that both larger-brained genera had strong evidence of spontaneous tool use, being either a regular component of its day-to-day life or an impressively novel use for an unfamiliar object, while no reports of the smaller-brained genera in the wild mentioned comparable problem-solving behaviors.\n\n\n4 Discussion\n------------\n\n\n### 4.1 Conclusion\n\n\nIn all iterations, we found the survey method of estimating animal intelligence to be quite noisy, without strong agreement on the importance of some categories, or on the rankings of species within some categories. This is unsurprising, since participants were given descriptions of behaviors stripped of much potentially relevant context, in the interest of time, and were not experts in either intelligence or animal behavior. However, there was broad agreement between our participants in both versions of the survey on some high-level conclusions, namely: a) that tool use as presented was a particularly important source of evidence; and b) that, when rankings were weighted by importance as judged by participants, the two larger-brained animals outscored to the two smaller-brained animals.\n\n\nBecause of the small number of genera represented in our survey, it is difficult to draw strong conclusions about the relative contributions of neuron count, architecture, and other factors to intelligence. However, our data do not support the hypothesis that one tissue architecture is greatly superior to the other as a rule, and weakly supports the hypothesis that birds and primates with similar neuron numbers have similar cognitive abilities. In particular, given the behaviors described in our survey, participants were not able to systematically distinguish the two birds from the two primates across all categories, but were substantially more able to distinguish the small-brained animals from those with twice as many brain neurons.\n\n\nWe also did not see strong evidence of specialized intelligence that differed between the groups. That is, the two birds in our study seemed not clearly better or worse at any particular kinds of cognitively-demanding behaviors than the two primates. However, this is not a claim that none of the *species* involved have specialized abilities. We could easily imagine it being the case, for example, that if one were to place an owl monkey brain or a grey parrot brain in the body of an ostrich, both would perform similarly well at the *cognitive* challenges presented by ostrich life, while an owl monkey brain would not do nearly as well as a grey parrot brain at living the life of a grey parrot. \n\n\n### 4.2 Implications and future directions\n\n\nWe hope our suggestive–if inconclusive–results spark greater interest in the highly neglected field of comparative animal intelligence. In particular, the further development and use of validated protocols for animal intelligence measurement seems to be a significant bottleneck to further progress. Furthermore, the gold standard of human psychometrics may not be a feasible model for animal intelligence measurement, given the prohibitive expense an analogous program in animals would incur (if traditional psychometric methods could even be applied usefully to most animals).\n\n\nOur surveying method may represent an inexpensive alternative that can produce useable if imperfect results. Although we believe it has reasonably good theoretical support, the method is nonetheless unvalidated and would surely require refinement. To that end, future studies may consider applying our method to species where the rank order is more certain, such as humans and chimpanzees, or the collection of primate species that have been compared by a psychometric battery (see [here](https://docs.google.com/document/d/1xBZbgz4hY4F31o52SHquERvhnr99dMDhIHDeS9xmyok/edit?usp=sharing)).\n\n\nWith regard to the question of avian and primate per-neuron intelligence, our result has limited generalizability due to the small number of genera represented. Even within a broad architecture type, species may still vary in brain characteristics that are relevant to intelligence, and we might expect larger evolutionary distances within Primates or Aves to be reflected in brain differences. Idiosyncratic selective pressures of certain niches likely also have an impact here. In future, it may be fruitful to compare other orders of bird, such as Passeriformes (and especially Corvidae), with primates. As a particularly evolutionarily recent clade made up of strong ecological generalists, Corvidae might have developed structural improvements allowing them to excel in tool use and other cognitive abilities relative to other animals in their brain size class, and indeed there are at least many anecdotal reports of spontaneous tool use in wild corvids. There may also be interesting brain structure differences between New World primates, like the two represented in this study, and Old World primates.\n\n\nSeveral limitations to the applicability of any bird-primate comparisons to the broader question surrounding architecture flexibility should be noted. Firstly, all brain structures other than the cerebral cortex are shared between birds and primates. Although these structures only account for a minority of brain volume, they could nonetheless perform some important precursor function to higher processing, such that an animal with a differently organized version could not perform as well cognitively, no matter their cortical architecture. This possibility seems less likely in light of the existence of cognitively advanced cephalopods like octopi, who are not vertebrates and therefore do not have a spinal cord or any other brain structures in common with birds and mammals.\n\n\nAnother issue pertains to scaling. While bird architectures clearly have the capacity to scale to the size of the smaller primate brains, no larger bird architectures have yet developed. This could be due to a number of limiting factors, including size limits imposed by the need to fly, a lack of adjacent niches that would support larger brains, or inherent randomness in the trajectory of brain evolution across lineages. However, it could also represent an upper bound on the scalability of bird-type cortical architecture.\n\n\n5 Contributions\n---------------\n\n\n*Research, analysis and writing were done by Tegan McCaslin. Editing and feedback were provided by Katja Grace and Justis Mills. Feedback was provided by Daniel Kokotajlo and Carl Shulman.*\n\n\n6 Bibliography\n--------------\n\n\nBailey, R. C., & Mettetal, G. W. (1977). PERCEIVED INTELLIGENCE IN MARRIED PARTNERS. *Social Behavior and Personality: An International Journal*, 5(1), 137–141.![]() . The data covers the first two years of the tournament.\")\n\n\n[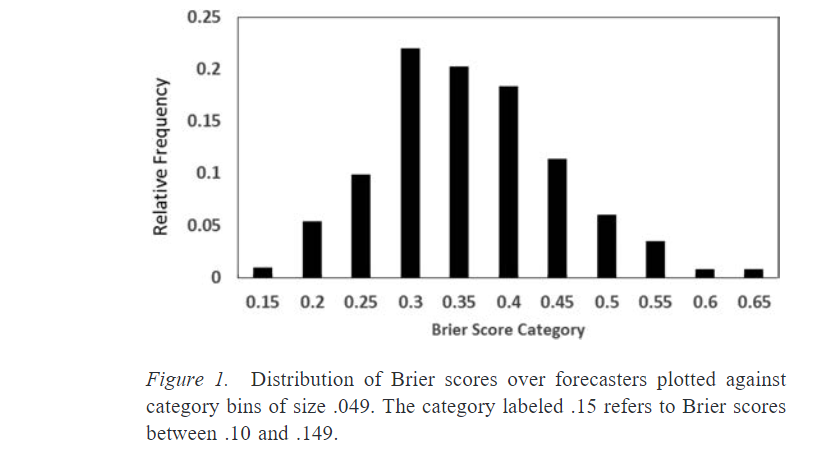](http://aiimpacts.org/wp-content/uploads/2019/02/image9.png)\n\n\nFor this set of questions, guessing randomly (assigning even odds to all possibilities) would yield a Brier score of 0.53. So most forecasters did significantly better than that. Some people—the people on the far left of this chart, the superforecasters—did much better than the average. For example, in year 2, the superforecaster Doug Lorch did best with 0.14. This was more than 60% better than the control group.[12](https://aiimpacts.org/evidence-on-good-forecasting-practices-from-the-good-judgment-project-an-accompanying-blog-post/#easy-footnote-bottom-12-1260 \"Superforecasting p93\") Importantly, being a superforecaster in one year correlated strongly with being a superforecaster the next year; there was some regression to the mean but roughly 70% of the superforecasters maintained their status from one year to the next.[13](https://aiimpacts.org/evidence-on-good-forecasting-practices-from-the-good-judgment-project-an-accompanying-blog-post/#easy-footnote-bottom-13-1260 \"Superforecasting p104\")\n\n\nOK, but what does all this mean, in intuitive terms? Here are three ways to get a sense of how good these scores really are:\n\n\n**Way One:** Let’s calculate some examples of prediction patterns that would give you Brier scores like those mentioned above. Suppose you make a bunch of predictions with 80% confidence and you are correct 80% of the time. Then your Brier score would be 0.32, roughly middle of the pack in this tournament. If instead it was 93% confidence correct 93% of the time, your Brier score would be 0.132, very close to the best superforecasters and to GJP’s aggregated forecasts.[14](https://aiimpacts.org/evidence-on-good-forecasting-practices-from-the-good-judgment-project-an-accompanying-blog-post/#easy-footnote-bottom-14-1260 \"To calculate this, I assumed binary questions and plugged the probability, p, into this formula: P(event_doesn’t_happen)(0-p)^2+P(event_happens)(1-p)^2 = (1-p)(0-p)^2+(p)(1-p)^2. I then doubled it, since we are using the original Brier score that ranges between 0-2 instead of 0-1. I can’t find stats on GJP’s Brier score, but recall that in year 2 it was 78% better than the control group, and Doug Lorch’s 0.14 was 60% better than the control group. (Superforecasting p93)\") In these examples, you are perfectly calibrated, which helps your score—more realistically you would be imperfectly calibrated and thus would need to be right even more often to get those scores.\n\n\n**Way Two:** “An alternative measure of forecast accuracy is the proportion of days on which forecasters’ estimates were on the correct side of 50%. … For all questions in the sample, a chance score was 47%. The mean proportion of days with correct estimates was 75%…”[15](https://aiimpacts.org/evidence-on-good-forecasting-practices-from-the-good-judgment-project-an-accompanying-blog-post/#easy-footnote-bottom-15-1260 \"This is from the same study
. The data covers the first two years of the tournament.\")\n\n\n[](http://aiimpacts.org/wp-content/uploads/2019/02/image9.png)\n\n\nFor this set of questions, guessing randomly (assigning even odds to all possibilities) would yield a Brier score of 0.53. So most forecasters did significantly better than that. Some people—the people on the far left of this chart, the superforecasters—did much better than the average. For example, in year 2, the superforecaster Doug Lorch did best with 0.14. This was more than 60% better than the control group.[12](https://aiimpacts.org/evidence-on-good-forecasting-practices-from-the-good-judgment-project-an-accompanying-blog-post/#easy-footnote-bottom-12-1260 \"Superforecasting p93\") Importantly, being a superforecaster in one year correlated strongly with being a superforecaster the next year; there was some regression to the mean but roughly 70% of the superforecasters maintained their status from one year to the next.[13](https://aiimpacts.org/evidence-on-good-forecasting-practices-from-the-good-judgment-project-an-accompanying-blog-post/#easy-footnote-bottom-13-1260 \"Superforecasting p104\")\n\n\nOK, but what does all this mean, in intuitive terms? Here are three ways to get a sense of how good these scores really are:\n\n\n**Way One:** Let’s calculate some examples of prediction patterns that would give you Brier scores like those mentioned above. Suppose you make a bunch of predictions with 80% confidence and you are correct 80% of the time. Then your Brier score would be 0.32, roughly middle of the pack in this tournament. If instead it was 93% confidence correct 93% of the time, your Brier score would be 0.132, very close to the best superforecasters and to GJP’s aggregated forecasts.[14](https://aiimpacts.org/evidence-on-good-forecasting-practices-from-the-good-judgment-project-an-accompanying-blog-post/#easy-footnote-bottom-14-1260 \"To calculate this, I assumed binary questions and plugged the probability, p, into this formula: P(event_doesn’t_happen)(0-p)^2+P(event_happens)(1-p)^2 = (1-p)(0-p)^2+(p)(1-p)^2. I then doubled it, since we are using the original Brier score that ranges between 0-2 instead of 0-1. I can’t find stats on GJP’s Brier score, but recall that in year 2 it was 78% better than the control group, and Doug Lorch’s 0.14 was 60% better than the control group. (Superforecasting p93)\") In these examples, you are perfectly calibrated, which helps your score—more realistically you would be imperfectly calibrated and thus would need to be right even more often to get those scores.\n\n\n**Way Two:** “An alternative measure of forecast accuracy is the proportion of days on which forecasters’ estimates were on the correct side of 50%. … For all questions in the sample, a chance score was 47%. The mean proportion of days with correct estimates was 75%…”[15](https://aiimpacts.org/evidence-on-good-forecasting-practices-from-the-good-judgment-project-an-accompanying-blog-post/#easy-footnote-bottom-15-1260 \"This is from the same study![]() , as are the two figures.\") According to this chart, the superforecasters were on the right side of 50% almost all the time:[16](https://aiimpacts.org/evidence-on-good-forecasting-practices-from-the-good-judgment-project-an-accompanying-blog-post/#easy-footnote-bottom-16-1260 \"The correlation between average Brier score and how often you were on the right side of 50% was 0.89 (same study
, as are the two figures.\") According to this chart, the superforecasters were on the right side of 50% almost all the time:[16](https://aiimpacts.org/evidence-on-good-forecasting-practices-from-the-good-judgment-project-an-accompanying-blog-post/#easy-footnote-bottom-16-1260 \"The correlation between average Brier score and how often you were on the right side of 50% was 0.89 (same study![]() ), so I think it’s safe to assume the superforecasters were somewhere on the right side of the peak in Figure 2. (I assume they mean being on the right side of 50% correlates with lower Brier scores; the alternative is crazy.) The high proportion of guesses on the right side of 50% is a puzzling fact—doesn’t it suggest that they were poorly calibrated, and that they could improve their scores by extremizing their judgments? I think what’s going on here is that the majority of forecasts made on most questions by superforecasters were highly (>90%) confident, and also almost always correct.\")\n\n\n[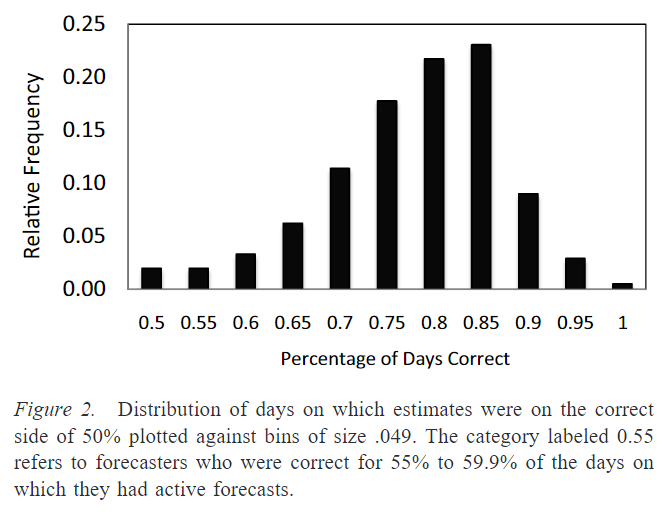](http://aiimpacts.org/wp-content/uploads/2019/02/image1.png)\n\n\n**Way Three:** “Across all four years of the tournament, *superforecasters looking out three hundred days were more accurate than regular forecasters looking out one hundred days*.”[17](https://aiimpacts.org/evidence-on-good-forecasting-practices-from-the-good-judgment-project-an-accompanying-blog-post/#easy-footnote-bottom-17-1260 \"Superforecasting p94, emphasis mine. Later, in the edge.org seminar, Tetlock says “In some other ROC curves—receiver operator characteristic curves, from signal detection theory—that Mark Steyvers at UCSD constructed—superforecasters could assign probabilities 400 days out about as well as regular people could about eighty days out.” The quote is accompanied by a graph; unfortunately, it’s hard to interpret.\") (Bear in mind, this wouldn’t necessarily hold for a different genre of questions. For example, information about the weather decays in days, while information about the climate lasts for decades or more.)\n\n\n3. Correlates of good judgment\n------------------------------\n\n\nThe data from this tournament is useful in two ways: It helps us decide whose predictions to trust, and it helps us make better predictions ourselves. This section will focus on which kinds of people and practices best correlate with success—information which is relevant to both goals. Section 4 will cover the training experiment, which helps to address causation vs. correlation worries.\n\n\nFeast your eyes on this:[18](https://aiimpacts.org/evidence-on-good-forecasting-practices-from-the-good-judgment-project-an-accompanying-blog-post/#easy-footnote-bottom-18-1260 \"This table is from the same study
), so I think it’s safe to assume the superforecasters were somewhere on the right side of the peak in Figure 2. (I assume they mean being on the right side of 50% correlates with lower Brier scores; the alternative is crazy.) The high proportion of guesses on the right side of 50% is a puzzling fact—doesn’t it suggest that they were poorly calibrated, and that they could improve their scores by extremizing their judgments? I think what’s going on here is that the majority of forecasts made on most questions by superforecasters were highly (>90%) confident, and also almost always correct.\")\n\n\n[](http://aiimpacts.org/wp-content/uploads/2019/02/image1.png)\n\n\n**Way Three:** “Across all four years of the tournament, *superforecasters looking out three hundred days were more accurate than regular forecasters looking out one hundred days*.”[17](https://aiimpacts.org/evidence-on-good-forecasting-practices-from-the-good-judgment-project-an-accompanying-blog-post/#easy-footnote-bottom-17-1260 \"Superforecasting p94, emphasis mine. Later, in the edge.org seminar, Tetlock says “In some other ROC curves—receiver operator characteristic curves, from signal detection theory—that Mark Steyvers at UCSD constructed—superforecasters could assign probabilities 400 days out about as well as regular people could about eighty days out.” The quote is accompanied by a graph; unfortunately, it’s hard to interpret.\") (Bear in mind, this wouldn’t necessarily hold for a different genre of questions. For example, information about the weather decays in days, while information about the climate lasts for decades or more.)\n\n\n3. Correlates of good judgment\n------------------------------\n\n\nThe data from this tournament is useful in two ways: It helps us decide whose predictions to trust, and it helps us make better predictions ourselves. This section will focus on which kinds of people and practices best correlate with success—information which is relevant to both goals. Section 4 will cover the training experiment, which helps to address causation vs. correlation worries.\n\n\nFeast your eyes on this:[18](https://aiimpacts.org/evidence-on-good-forecasting-practices-from-the-good-judgment-project-an-accompanying-blog-post/#easy-footnote-bottom-18-1260 \"This table is from the same study![]() .\")\n\n\n[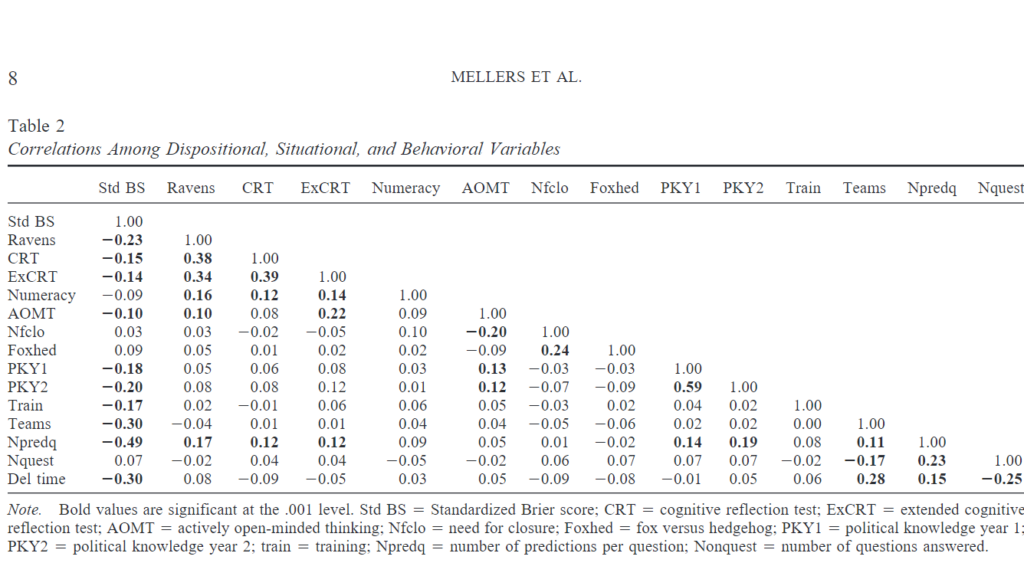](http://aiimpacts.org/wp-content/uploads/2019/02/image8.png)\n\n\nThis shows the correlations between various things.[19](https://aiimpacts.org/evidence-on-good-forecasting-practices-from-the-good-judgment-project-an-accompanying-blog-post/#easy-footnote-bottom-19-1260 \"“Ravens” is an IQ test, “Numeracy” is a mathematical aptitude test.\") The leftmost column is the most important; it shows how each variable correlates with (standardized) Brier score. (Recall that Brier scores measure inaccuracy, so negative correlations are good.)\n\n\nIt’s worth mentioning that while intelligence correlated with accuracy, it didn’t steal the show.[20](https://aiimpacts.org/evidence-on-good-forecasting-practices-from-the-good-judgment-project-an-accompanying-blog-post/#easy-footnote-bottom-20-1260 \"That said, as Carl Shulman pointed out, the forecasters in this sample were probably above-average IQ, so the correlation between IQ and accuracy in this sample is almost certainly smaller than the “true” correlation in the population at large. See e.g. restriction of range and the Thorndike Correction.\") The same goes for time spent deliberating.[21](https://aiimpacts.org/evidence-on-good-forecasting-practices-from-the-good-judgment-project-an-accompanying-blog-post/#easy-footnote-bottom-21-1260 \"“Deliberation time, which was only measured in Year 2, was transformed by a logarithmic function (to reduce tail effects) and averaged over questions. The average length of deliberation time was 3.60 min, and the average number of questions tried throughout the 2-year period was 121 out of 199 (61% of all questions). Correlations between standardized Brier score accuracy and effort were statistically significant for belief updating, … and deliberation time, … but not for number of forecasting questions attempted.” (study
.\")\n\n\n[](http://aiimpacts.org/wp-content/uploads/2019/02/image8.png)\n\n\nThis shows the correlations between various things.[19](https://aiimpacts.org/evidence-on-good-forecasting-practices-from-the-good-judgment-project-an-accompanying-blog-post/#easy-footnote-bottom-19-1260 \"“Ravens” is an IQ test, “Numeracy” is a mathematical aptitude test.\") The leftmost column is the most important; it shows how each variable correlates with (standardized) Brier score. (Recall that Brier scores measure inaccuracy, so negative correlations are good.)\n\n\nIt’s worth mentioning that while intelligence correlated with accuracy, it didn’t steal the show.[20](https://aiimpacts.org/evidence-on-good-forecasting-practices-from-the-good-judgment-project-an-accompanying-blog-post/#easy-footnote-bottom-20-1260 \"That said, as Carl Shulman pointed out, the forecasters in this sample were probably above-average IQ, so the correlation between IQ and accuracy in this sample is almost certainly smaller than the “true” correlation in the population at large. See e.g. restriction of range and the Thorndike Correction.\") The same goes for time spent deliberating.[21](https://aiimpacts.org/evidence-on-good-forecasting-practices-from-the-good-judgment-project-an-accompanying-blog-post/#easy-footnote-bottom-21-1260 \"“Deliberation time, which was only measured in Year 2, was transformed by a logarithmic function (to reduce tail effects) and averaged over questions. The average length of deliberation time was 3.60 min, and the average number of questions tried throughout the 2-year period was 121 out of 199 (61% of all questions). Correlations between standardized Brier score accuracy and effort were statistically significant for belief updating, … and deliberation time, … but not for number of forecasting questions attempted.” (study![]() ) Anecdotally, I spoke to a superforecaster who said that the best of the best typically put a lot of time into it; he spends maybe fifteen minutes each day making predictions but several hours per day reading news, listening to relevant podcasts, etc.\") The authors summarize the results as follows: “The best forecasters scored higher on both intelligence and political knowledge than the already well-above-average group of forecasters. The best forecasters had more open-minded cognitive styles. They benefited from better working environments with probability training and collaborative teams. And while making predictions, they spent more time deliberating and updating their forecasts.”[22](https://aiimpacts.org/evidence-on-good-forecasting-practices-from-the-good-judgment-project-an-accompanying-blog-post/#easy-footnote-bottom-22-1260 \"This is from the same study
) Anecdotally, I spoke to a superforecaster who said that the best of the best typically put a lot of time into it; he spends maybe fifteen minutes each day making predictions but several hours per day reading news, listening to relevant podcasts, etc.\") The authors summarize the results as follows: “The best forecasters scored higher on both intelligence and political knowledge than the already well-above-average group of forecasters. The best forecasters had more open-minded cognitive styles. They benefited from better working environments with probability training and collaborative teams. And while making predictions, they spent more time deliberating and updating their forecasts.”[22](https://aiimpacts.org/evidence-on-good-forecasting-practices-from-the-good-judgment-project-an-accompanying-blog-post/#easy-footnote-bottom-22-1260 \"This is from the same study![]() \")\n\n\nThat big chart depicts all the correlations individually. Can we use them to construct a model to take in all of these variables and spit out a prediction for what your Brier score will be? Yes we can:\n\n\n[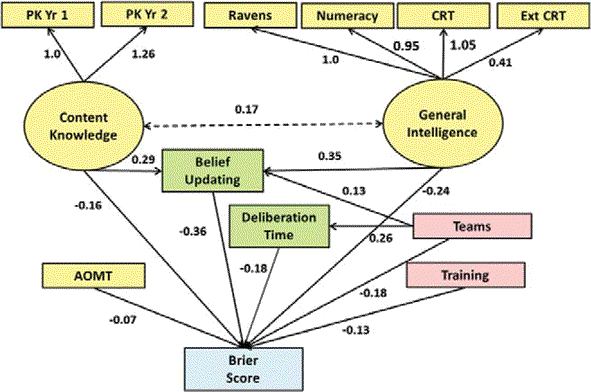](http://aiimpacts.org/wp-content/uploads/2019/02/image5.png)Figure 3. Structural equation model with standardized coefficients.\nThis model has a multiple correlation of 0.64.[23](https://aiimpacts.org/evidence-on-good-forecasting-practices-from-the-good-judgment-project-an-accompanying-blog-post/#easy-footnote-bottom-23-1260 \"“Nonetheless, as we saw in the structural model, and confirm here, the best model uses dispositional, situational, and behavioral variables. The combination produced a multiple correlation of .64.” (study
\")\n\n\nThat big chart depicts all the correlations individually. Can we use them to construct a model to take in all of these variables and spit out a prediction for what your Brier score will be? Yes we can:\n\n\n[](http://aiimpacts.org/wp-content/uploads/2019/02/image5.png)Figure 3. Structural equation model with standardized coefficients.\nThis model has a multiple correlation of 0.64.[23](https://aiimpacts.org/evidence-on-good-forecasting-practices-from-the-good-judgment-project-an-accompanying-blog-post/#easy-footnote-bottom-23-1260 \"“Nonetheless, as we saw in the structural model, and confirm here, the best model uses dispositional, situational, and behavioral variables. The combination produced a multiple correlation of .64.” (study![]() ) Yellow ovals are latent dispositional variables, yellow rectangles are observed dispositional variables, pink rectangles are experimentally manipulated situational variables, and green rectangles are observed behavioral variables. If this diagram follows convention, single-headed arrows represent hypothesized causation, whereas the double-headed arrow represents a correlation without any claim being made about causation.\") Earlier, we noted that superforecasters typically remained superforecasters (i.e. in the top 2%), proving that their success wasn’t mostly due to luck. Across all the forecasters, the correlation between performance in one year and performance in the next year is 0.65.[24](https://aiimpacts.org/evidence-on-good-forecasting-practices-from-the-good-judgment-project-an-accompanying-blog-post/#easy-footnote-bottom-24-1260 \"Superforecasting p104\") So we have two good ways to predict how accurate someone will be: Look at their past performance, and look at how well they score on the structural model above.\n\n\nI speculate that these correlations underestimate the true predictability of accuracy, because the forecasters were all unpaid online volunteers, and many of them presumably had random things come up in their life that got in the way of making good predictions—perhaps they have a kid, or get sick, or move to a new job and so stop reading the news for a month, and their accuracy declines.[25](https://aiimpacts.org/evidence-on-good-forecasting-practices-from-the-good-judgment-project-an-accompanying-blog-post/#easy-footnote-bottom-25-1260 \"Of course, these things can happen in the real world too—maybe our AI timelines forecasters will get sick and stop making good forecasts. What I’m suggesting is that this data is inherently noisier than data from a group of full-time staff whose job it is to predict things would be. Moreover, when these things happen in the real world, we can see that they are happening and adjust our model accordingly, e.g. “Bob’s really busy with kids this month, so let’s not lean as heavily on his forecasts as we usually do.”\") Yet still 70% of the superforecasters in one year remained superforecasters in the next.\n\n\nFinally, what about superforecasters in particular? Is there anything to say about what it takes to be in the top 2%? \n \nTetlock devotes much of his book to this. It is hard to tell how much his recommendations come from data analysis and how much are just his own synthesis of the interviews he’s conducted with superforecasters. Here is his “Portrait of the modal superforecaster.”[26](https://aiimpacts.org/evidence-on-good-forecasting-practices-from-the-good-judgment-project-an-accompanying-blog-post/#easy-footnote-bottom-26-1260 \"Superforecasting p191\")\n\n\n**Philosophic outlook:**\n\n\n* **Cautious:** Nothing is certain.\n* **Humble:** Reality is infinitely complex.\n* **Nondeterministic:** Whatever happens is not meant to be and does not have to happen.\n\n\n**Abilities & thinking styles:**\n\n\n* **Actively open-minded:** Beliefs are hypotheses to be tested, not treasures to be protected.\n* **Intelligent and knowledgeable, with a “Need for Cognition”:** Intellectually curious, enjoy puzzles and mental challenges.\n* **Reflective:** Introspective and self-critical.\n* **Numerate:** Comfortable with numbers.\n\n\n**Methods of forecasting:**\n\n\n* **Pragmatic:** Not wedded to any idea or agenda.\n* **Analytical:** Capable of stepping back from the tip-of-your-nose perspective and considering other views.\n* **Dragonfly-eyed:** Value diverse views and synthesize them into their own.\n* **Probabilistic:** Judge using many grades of maybe.\n* **Thoughtful updaters:** When facts change, they change their minds.\n* **Good intuitive psychologists:** Aware of the value of checking thinking for cognitive and emotional biases.\n\n\n**Work ethic:**\n\n\n* **Growth mindset:** Believe it’s possible to get better.\n* **Grit:** Determined to keep at it however long it takes.\n\n\nAdditionally, there is experimental evidence that superforecasters are less prone to standard cognitive science biases than ordinary people.[27](https://aiimpacts.org/evidence-on-good-forecasting-practices-from-the-good-judgment-project-an-accompanying-blog-post/#easy-footnote-bottom-27-1260 \"From edge.org: Mellers: “We have given them lots of Kahneman and Tversky-like problems to see if they fall prey to the same sorts of biases and errors. The answer is sort of, some of them do, but not as many. It’s not nearly as frequent as you see with the rest of us ordinary mortals. The other thing that’s interesting is they don’t make the kinds of mistakes that regular people make instead of the right answer. They do something that’s a little bit more thoughtful. They integrate base rates with case-specific information a little bit more.”
) Yellow ovals are latent dispositional variables, yellow rectangles are observed dispositional variables, pink rectangles are experimentally manipulated situational variables, and green rectangles are observed behavioral variables. If this diagram follows convention, single-headed arrows represent hypothesized causation, whereas the double-headed arrow represents a correlation without any claim being made about causation.\") Earlier, we noted that superforecasters typically remained superforecasters (i.e. in the top 2%), proving that their success wasn’t mostly due to luck. Across all the forecasters, the correlation between performance in one year and performance in the next year is 0.65.[24](https://aiimpacts.org/evidence-on-good-forecasting-practices-from-the-good-judgment-project-an-accompanying-blog-post/#easy-footnote-bottom-24-1260 \"Superforecasting p104\") So we have two good ways to predict how accurate someone will be: Look at their past performance, and look at how well they score on the structural model above.\n\n\nI speculate that these correlations underestimate the true predictability of accuracy, because the forecasters were all unpaid online volunteers, and many of them presumably had random things come up in their life that got in the way of making good predictions—perhaps they have a kid, or get sick, or move to a new job and so stop reading the news for a month, and their accuracy declines.[25](https://aiimpacts.org/evidence-on-good-forecasting-practices-from-the-good-judgment-project-an-accompanying-blog-post/#easy-footnote-bottom-25-1260 \"Of course, these things can happen in the real world too—maybe our AI timelines forecasters will get sick and stop making good forecasts. What I’m suggesting is that this data is inherently noisier than data from a group of full-time staff whose job it is to predict things would be. Moreover, when these things happen in the real world, we can see that they are happening and adjust our model accordingly, e.g. “Bob’s really busy with kids this month, so let’s not lean as heavily on his forecasts as we usually do.”\") Yet still 70% of the superforecasters in one year remained superforecasters in the next.\n\n\nFinally, what about superforecasters in particular? Is there anything to say about what it takes to be in the top 2%? \n \nTetlock devotes much of his book to this. It is hard to tell how much his recommendations come from data analysis and how much are just his own synthesis of the interviews he’s conducted with superforecasters. Here is his “Portrait of the modal superforecaster.”[26](https://aiimpacts.org/evidence-on-good-forecasting-practices-from-the-good-judgment-project-an-accompanying-blog-post/#easy-footnote-bottom-26-1260 \"Superforecasting p191\")\n\n\n**Philosophic outlook:**\n\n\n* **Cautious:** Nothing is certain.\n* **Humble:** Reality is infinitely complex.\n* **Nondeterministic:** Whatever happens is not meant to be and does not have to happen.\n\n\n**Abilities & thinking styles:**\n\n\n* **Actively open-minded:** Beliefs are hypotheses to be tested, not treasures to be protected.\n* **Intelligent and knowledgeable, with a “Need for Cognition”:** Intellectually curious, enjoy puzzles and mental challenges.\n* **Reflective:** Introspective and self-critical.\n* **Numerate:** Comfortable with numbers.\n\n\n**Methods of forecasting:**\n\n\n* **Pragmatic:** Not wedded to any idea or agenda.\n* **Analytical:** Capable of stepping back from the tip-of-your-nose perspective and considering other views.\n* **Dragonfly-eyed:** Value diverse views and synthesize them into their own.\n* **Probabilistic:** Judge using many grades of maybe.\n* **Thoughtful updaters:** When facts change, they change their minds.\n* **Good intuitive psychologists:** Aware of the value of checking thinking for cognitive and emotional biases.\n\n\n**Work ethic:**\n\n\n* **Growth mindset:** Believe it’s possible to get better.\n* **Grit:** Determined to keep at it however long it takes.\n\n\nAdditionally, there is experimental evidence that superforecasters are less prone to standard cognitive science biases than ordinary people.[27](https://aiimpacts.org/evidence-on-good-forecasting-practices-from-the-good-judgment-project-an-accompanying-blog-post/#easy-footnote-bottom-27-1260 \"From edge.org: Mellers: “We have given them lots of Kahneman and Tversky-like problems to see if they fall prey to the same sorts of biases and errors. The answer is sort of, some of them do, but not as many. It’s not nearly as frequent as you see with the rest of us ordinary mortals. The other thing that’s interesting is they don’t make the kinds of mistakes that regular people make instead of the right answer. They do something that’s a little bit more thoughtful. They integrate base rates with case-specific information a little bit more.”
Tetlock: “They’re closer to Bayesians.”
Mellers: “Right. They’re a little less sensitive to framing effects. The reference point doesn’t have quite the enormous role that it does with most people.”\") This is particularly exciting because—we can hope—the same sorts of training that help people become superforecasters might also help overcome biases.\n\n\nFinally, Tetlock says that “The strongest predictor of rising into the ranks of superforecasters is perpetual beta, the degree to which one is committed to belief updating and self-improvement. It is roughly three times as powerful a predictor as its closest rival, intelligence.”[28](https://aiimpacts.org/evidence-on-good-forecasting-practices-from-the-good-judgment-project-an-accompanying-blog-post/#easy-footnote-bottom-28-1260 \"Superforecasting p192\") Unfortunately, I couldn’t find any sources or data on this, nor an operational definition of “perpetual beta,” so we don’t know how he measured it.[29](https://aiimpacts.org/evidence-on-good-forecasting-practices-from-the-good-judgment-project-an-accompanying-blog-post/#easy-footnote-bottom-29-1260 \"Moreover, a quick search through Google Scholar and library.unc.edu turned up nothing of interest. I reached out to Tetlock to ask questions but he hasn’t responded yet.\")\n\n\n4. The training and Tetlock’s commandments\n------------------------------------------\n\n\nThis section discusses the surprising effect of the training module on accuracy, and finishes with Tetlock’s training-module-based recommendations for how to become a better forecaster.[30](https://aiimpacts.org/evidence-on-good-forecasting-practices-from-the-good-judgment-project-an-accompanying-blog-post/#easy-footnote-bottom-30-1260 \"“The guidelines sketched here distill key themes in this book and in training systems that have been experimentally demonstrated to boost accuracy in real-world forecasting tournaments.” (277)\")\n\n\nThe training module, which was randomly given to some participants but not others, took about an hour to read.[31](https://aiimpacts.org/evidence-on-good-forecasting-practices-from-the-good-judgment-project-an-accompanying-blog-post/#easy-footnote-bottom-31-1260 \"This is from this study![]() . Relevant quote: “Although the training lasted less than one hour, it consistently improved accuracy (Brier scores) by 6 to 11% over the control condition.”\") The authors describe the content as follows:\n\n\n“Training in year 1 consisted of two different modules: probabilistic reasoning training and scenario training. Scenario-training was a four-step process: 1) developing coherent and logical probabilities under the probability sum rule; 2) exploring and challenging assumptions; 3) identifying the key causal drivers; 4) considering the best and worst case scenarios and developing a sensible 95% confidence interval of possible outcomes; and 5) avoid over-correction biases. … Probabilistic reasoning training consisted of lessons that detailed the difference between calibration and resolution, using comparison classes and base rates (Kahneman & Tversky, 1973; Tversky & Kahneman, 1981), averaging and using crowd wisdom principles (Surowiecki, 2005), finding and utilizing predictive mathematical and statistical models (Arkes, 1981; Kahneman & Tversky, 1982), cautiously using time-series and historical data, and being self-aware of the typical cognitive biases common throughout the population.”[32](https://aiimpacts.org/evidence-on-good-forecasting-practices-from-the-good-judgment-project-an-accompanying-blog-post/#easy-footnote-bottom-32-1260 \"Same study
. Relevant quote: “Although the training lasted less than one hour, it consistently improved accuracy (Brier scores) by 6 to 11% over the control condition.”\") The authors describe the content as follows:\n\n\n“Training in year 1 consisted of two different modules: probabilistic reasoning training and scenario training. Scenario-training was a four-step process: 1) developing coherent and logical probabilities under the probability sum rule; 2) exploring and challenging assumptions; 3) identifying the key causal drivers; 4) considering the best and worst case scenarios and developing a sensible 95% confidence interval of possible outcomes; and 5) avoid over-correction biases. … Probabilistic reasoning training consisted of lessons that detailed the difference between calibration and resolution, using comparison classes and base rates (Kahneman & Tversky, 1973; Tversky & Kahneman, 1981), averaging and using crowd wisdom principles (Surowiecki, 2005), finding and utilizing predictive mathematical and statistical models (Arkes, 1981; Kahneman & Tversky, 1982), cautiously using time-series and historical data, and being self-aware of the typical cognitive biases common throughout the population.”[32](https://aiimpacts.org/evidence-on-good-forecasting-practices-from-the-good-judgment-project-an-accompanying-blog-post/#easy-footnote-bottom-32-1260 \"Same study![]() .\")\n\n\nIn later years, they merged the two modules into one and updated it based on their observations of the best forecasters. The updated training module is organized around an acronym:[33](https://aiimpacts.org/evidence-on-good-forecasting-practices-from-the-good-judgment-project-an-accompanying-blog-post/#easy-footnote-bottom-33-1260 \"Same study
.\")\n\n\nIn later years, they merged the two modules into one and updated it based on their observations of the best forecasters. The updated training module is organized around an acronym:[33](https://aiimpacts.org/evidence-on-good-forecasting-practices-from-the-good-judgment-project-an-accompanying-blog-post/#easy-footnote-bottom-33-1260 \"Same study![]() .\")\n\n\n[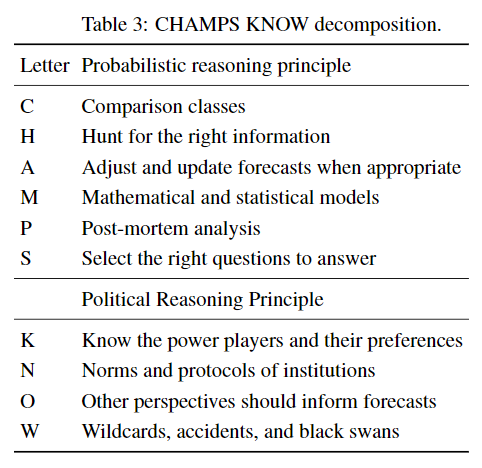](http://aiimpacts.org/wp-content/uploads/2019/02/image6.png)\n\n\nImpressively, this training had a lasting positive effect on accuracy in all four years:\n\n\n[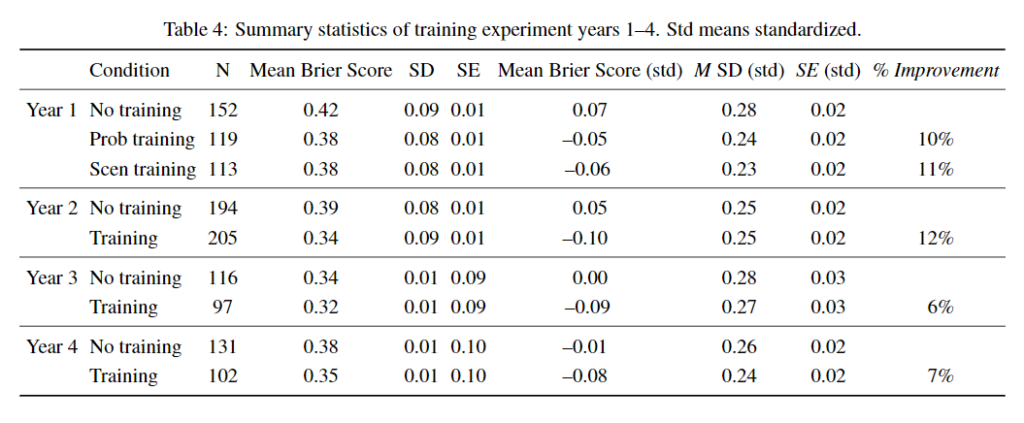](http://aiimpacts.org/wp-content/uploads/2019/02/image3.png)\n\n\nOne might worry that training improves accuracy by motivating the trainees to take their jobs more seriously. Indeed it seems that the trained forecasters made more predictions per question than the control group, though they didn’t make more predictions overall. Nevertheless it seems that the training also had a direct effect on accuracy as well as this indirect effect.[34](https://aiimpacts.org/evidence-on-good-forecasting-practices-from-the-good-judgment-project-an-accompanying-blog-post/#easy-footnote-bottom-34-1260 \"See sections 3.3, 3.5, and 3.6 of this study.
.\")\n\n\n[](http://aiimpacts.org/wp-content/uploads/2019/02/image6.png)\n\n\nImpressively, this training had a lasting positive effect on accuracy in all four years:\n\n\n[](http://aiimpacts.org/wp-content/uploads/2019/02/image3.png)\n\n\nOne might worry that training improves accuracy by motivating the trainees to take their jobs more seriously. Indeed it seems that the trained forecasters made more predictions per question than the control group, though they didn’t make more predictions overall. Nevertheless it seems that the training also had a direct effect on accuracy as well as this indirect effect.[34](https://aiimpacts.org/evidence-on-good-forecasting-practices-from-the-good-judgment-project-an-accompanying-blog-post/#easy-footnote-bottom-34-1260 \"See sections 3.3, 3.5, and 3.6 of this study.![]() \")\n\n\nMoving on, let’s talk about the advice Tetlock gives to his audience in *Superforecasting*, advice which is based on, though not identical to, the CHAMPS-KNOW training. The book has a few paragraphs of explanation for each commandment, a transcript of which is [here](https://www.lesswrong.com/posts/dvYeSKDRd68GcrWoe/ten-commandments-for-aspiring-superforecasters); in this post I’ll give my own abbreviated explanations:\n\n\nTEN COMMANDMENTS FOR ASPIRING SUPERFORECASTERS\n\n\n**(1) Triage:** Don’t waste time on questions that are “clocklike” where a rule of thumb can get you pretty close to the correct answer, or “cloudlike” where even fancy models can’t beat a dart-throwing chimp. \n\n\n**(2) Break seemingly intractable problems into tractable sub-problems:** This is how Fermi estimation works. One related piece of advice is “be wary of accidentally substituting an easy question for a hard one,” e.g. substituting “Would Israel be willing to assassinate Yasser Arafat?” for “Will at least one of the tests for polonium in Arafat’s body turn up positive?” \n\n\n**(3) Strike the right balance between inside and outside views:** In particular, *first* anchor with the outside view and *then* adjust using the inside view. (More on this in Section 5)\n\n\n**(4) Strike the right balance between under- and overreacting to evidence:** “Superforecasters aren’t perfect Bayesian predictors but they are much better than most of us.”[35](https://aiimpacts.org/evidence-on-good-forecasting-practices-from-the-good-judgment-project-an-accompanying-blog-post/#easy-footnote-bottom-35-1260 \"Superforecasting p281\") Usually do many small updates, but occasionally do big updates when the situation calls for it. Take care not to fall for things that seem like good evidence but aren’t; remember to think about P(E|H)/P(E|~H); remember to avoid the base-rate fallacy.\n\n\n**(5) Look for the clashing causal forces at work in each problem:** This is the “dragonfly eye perspective,” which is where you attempt to do a sort of mental wisdom of the crowds: Have tons of different causal models and aggregate their judgments. Use “Devil’s advocate” reasoning. If you think that P, try hard to convince yourself that not-P. You should find yourself saying “On the one hand… on the other hand… on the third hand…” a lot.\n\n\n**(6) Strive to distinguish as many degrees of doubt as the problem permits but no more:** Some people criticize the use of exact probabilities (67%! 21%!) as merely a way to pretend you know more than you do. There might be another post on the subject of why credences are better than hedge words like “maybe” and “probably” and “significant chance;” for now, I’ll simply mention that when the authors rounded the superforecaster’s forecasts to the nearest 0.05, their accuracy dropped.[36](https://aiimpacts.org/evidence-on-good-forecasting-practices-from-the-good-judgment-project-an-accompanying-blog-post/#easy-footnote-bottom-36-1260 \"This is from Friedman et al (2018), available here.\") Superforecasters really were making use of all 101 numbers from 0.00 to 1.00! (EDIT: I am told this may be wrong; the number should be 0.1, not 0.05. See the discussion [here](https://www.metaculus.com/questions/4166/the-lightning-round-tournament-comparing-metaculus-forecasters-to-infectious-disease-experts/#comment-28756 \"https://www.metaculus.com/questions/4166/the-lightning-round-tournament-comparing-metaculus-forecasters-to-infectious-disease-experts/#comment-28756\") and [here](https://forum.effectivealtruism.org/posts/W94KjunX3hXAtZvXJ/evidence-on-good-forecasting-practices-from-the-good?commentId=RtjNoQMNRQvuYtsx5 \"https://forum.effectivealtruism.org/posts/W94KjunX3hXAtZvXJ/evidence-on-good-forecasting-practices-from-the-good?commentId=RtjNoQMNRQvuYtsx5\").)\n\n\n**(7) Strike the right balance between under- and overconfidence, between prudence and decisiveness.**\n\n\n**(8) Look for the errors behind your mistakes but beware of rearview-mirror hindsight biases.**\n\n\n**(9) Bring out the best in others and let others bring out the best in you:** The book spent a whole chapter on this, using the Wehrmacht as an extended case study on good team organization.[37](https://aiimpacts.org/evidence-on-good-forecasting-practices-from-the-good-judgment-project-an-accompanying-blog-post/#easy-footnote-bottom-37-1260 \"Scott Alexander: “Later in the chapter, he admits that his choice of examples might raise some eyebrows, but says that he did it on purpose to teach us to think critically and overcome cognitive dissonance between our moral preconceptions and our factual beliefs. I hope he has tenure.”\") One pervasive guiding principle is “Don’t tell people how to do things; tell them what you want accomplished, and they’ll surprise you with their ingenuity in doing it.” The other pervasive guiding principle is “Cultivate a culture in which people—even subordinates—are encouraged to dissent and give counterarguments.”[38](https://aiimpacts.org/evidence-on-good-forecasting-practices-from-the-good-judgment-project-an-accompanying-blog-post/#easy-footnote-bottom-38-1260 \"See e.g. page 284 of Superforecasting, and the entirety of chapter 9.\")\n\n\n**(10) Master the error-balancing bicycle:** This one should have been called practice, practice, practice. Tetlock says that reading the news and generating probabilities isn’t enough; you need to actually score your predictions so that you know how wrong you were.\n\n\n**(11) Don’t treat commandments as commandments:** Tetlock’s point here is simply that you should use your judgment about whether to follow a commandment or not; sometimes they should be overridden.\n\n\nIt’s worth mentioning at this point that the advice is given at the end of the book, as a sort of summary, and may make less sense to someone who hasn’t read the book. In particular, Chapter 5 gives a less formal but more helpful recipe for making predictions, with accompanying examples. See the end of this blog post for a summary of this recipe.\n\n\n5. On the Outside View & Lessons for AI Impacts\n-----------------------------------------------\n\n\nThe previous section summarized Tetlock’s advice for how to make better forecasts; my own summary of the lessons I think we should learn is more concise and comprehensive and can be found at [this page](http://aiimpacts.org/evidence-on-good-forecasting-practices-from-the-good-judgment-project/). This section goes into detail about one particular, more controversial matter: The importance of the “[outside view](https://www.mckinsey.com/business-functions/strategy-and-corporate-finance/our-insights/daniel-kahneman-beware-the-inside-view),” also known as [reference class forecasting](https://en.wikipedia.org/wiki/Reference_class_forecasting). This research provides us with strong evidence in favor of this method of making predictions; however, the situation is complicated by Tetlock’s insistence that other methods are useful as well. This section discusses the evidence and attempts to interpret it.\n\n\nThe GJP asked people who took the training to self-report which of the CHAMPS-KNOW principles they were using when they explained why they made a forecast; 69% of forecast explanations received tags this way. The only principle significantly positively correlated with successful forecasts was C: Comparison classes.[39](https://aiimpacts.org/evidence-on-good-forecasting-practices-from-the-good-judgment-project-an-accompanying-blog-post/#easy-footnote-bottom-39-1260 \"This is from this paper
\")\n\n\nMoving on, let’s talk about the advice Tetlock gives to his audience in *Superforecasting*, advice which is based on, though not identical to, the CHAMPS-KNOW training. The book has a few paragraphs of explanation for each commandment, a transcript of which is [here](https://www.lesswrong.com/posts/dvYeSKDRd68GcrWoe/ten-commandments-for-aspiring-superforecasters); in this post I’ll give my own abbreviated explanations:\n\n\nTEN COMMANDMENTS FOR ASPIRING SUPERFORECASTERS\n\n\n**(1) Triage:** Don’t waste time on questions that are “clocklike” where a rule of thumb can get you pretty close to the correct answer, or “cloudlike” where even fancy models can’t beat a dart-throwing chimp. \n\n\n**(2) Break seemingly intractable problems into tractable sub-problems:** This is how Fermi estimation works. One related piece of advice is “be wary of accidentally substituting an easy question for a hard one,” e.g. substituting “Would Israel be willing to assassinate Yasser Arafat?” for “Will at least one of the tests for polonium in Arafat’s body turn up positive?” \n\n\n**(3) Strike the right balance between inside and outside views:** In particular, *first* anchor with the outside view and *then* adjust using the inside view. (More on this in Section 5)\n\n\n**(4) Strike the right balance between under- and overreacting to evidence:** “Superforecasters aren’t perfect Bayesian predictors but they are much better than most of us.”[35](https://aiimpacts.org/evidence-on-good-forecasting-practices-from-the-good-judgment-project-an-accompanying-blog-post/#easy-footnote-bottom-35-1260 \"Superforecasting p281\") Usually do many small updates, but occasionally do big updates when the situation calls for it. Take care not to fall for things that seem like good evidence but aren’t; remember to think about P(E|H)/P(E|~H); remember to avoid the base-rate fallacy.\n\n\n**(5) Look for the clashing causal forces at work in each problem:** This is the “dragonfly eye perspective,” which is where you attempt to do a sort of mental wisdom of the crowds: Have tons of different causal models and aggregate their judgments. Use “Devil’s advocate” reasoning. If you think that P, try hard to convince yourself that not-P. You should find yourself saying “On the one hand… on the other hand… on the third hand…” a lot.\n\n\n**(6) Strive to distinguish as many degrees of doubt as the problem permits but no more:** Some people criticize the use of exact probabilities (67%! 21%!) as merely a way to pretend you know more than you do. There might be another post on the subject of why credences are better than hedge words like “maybe” and “probably” and “significant chance;” for now, I’ll simply mention that when the authors rounded the superforecaster’s forecasts to the nearest 0.05, their accuracy dropped.[36](https://aiimpacts.org/evidence-on-good-forecasting-practices-from-the-good-judgment-project-an-accompanying-blog-post/#easy-footnote-bottom-36-1260 \"This is from Friedman et al (2018), available here.\") Superforecasters really were making use of all 101 numbers from 0.00 to 1.00! (EDIT: I am told this may be wrong; the number should be 0.1, not 0.05. See the discussion [here](https://www.metaculus.com/questions/4166/the-lightning-round-tournament-comparing-metaculus-forecasters-to-infectious-disease-experts/#comment-28756 \"https://www.metaculus.com/questions/4166/the-lightning-round-tournament-comparing-metaculus-forecasters-to-infectious-disease-experts/#comment-28756\") and [here](https://forum.effectivealtruism.org/posts/W94KjunX3hXAtZvXJ/evidence-on-good-forecasting-practices-from-the-good?commentId=RtjNoQMNRQvuYtsx5 \"https://forum.effectivealtruism.org/posts/W94KjunX3hXAtZvXJ/evidence-on-good-forecasting-practices-from-the-good?commentId=RtjNoQMNRQvuYtsx5\").)\n\n\n**(7) Strike the right balance between under- and overconfidence, between prudence and decisiveness.**\n\n\n**(8) Look for the errors behind your mistakes but beware of rearview-mirror hindsight biases.**\n\n\n**(9) Bring out the best in others and let others bring out the best in you:** The book spent a whole chapter on this, using the Wehrmacht as an extended case study on good team organization.[37](https://aiimpacts.org/evidence-on-good-forecasting-practices-from-the-good-judgment-project-an-accompanying-blog-post/#easy-footnote-bottom-37-1260 \"Scott Alexander: “Later in the chapter, he admits that his choice of examples might raise some eyebrows, but says that he did it on purpose to teach us to think critically and overcome cognitive dissonance between our moral preconceptions and our factual beliefs. I hope he has tenure.”\") One pervasive guiding principle is “Don’t tell people how to do things; tell them what you want accomplished, and they’ll surprise you with their ingenuity in doing it.” The other pervasive guiding principle is “Cultivate a culture in which people—even subordinates—are encouraged to dissent and give counterarguments.”[38](https://aiimpacts.org/evidence-on-good-forecasting-practices-from-the-good-judgment-project-an-accompanying-blog-post/#easy-footnote-bottom-38-1260 \"See e.g. page 284 of Superforecasting, and the entirety of chapter 9.\")\n\n\n**(10) Master the error-balancing bicycle:** This one should have been called practice, practice, practice. Tetlock says that reading the news and generating probabilities isn’t enough; you need to actually score your predictions so that you know how wrong you were.\n\n\n**(11) Don’t treat commandments as commandments:** Tetlock’s point here is simply that you should use your judgment about whether to follow a commandment or not; sometimes they should be overridden.\n\n\nIt’s worth mentioning at this point that the advice is given at the end of the book, as a sort of summary, and may make less sense to someone who hasn’t read the book. In particular, Chapter 5 gives a less formal but more helpful recipe for making predictions, with accompanying examples. See the end of this blog post for a summary of this recipe.\n\n\n5. On the Outside View & Lessons for AI Impacts\n-----------------------------------------------\n\n\nThe previous section summarized Tetlock’s advice for how to make better forecasts; my own summary of the lessons I think we should learn is more concise and comprehensive and can be found at [this page](http://aiimpacts.org/evidence-on-good-forecasting-practices-from-the-good-judgment-project/). This section goes into detail about one particular, more controversial matter: The importance of the “[outside view](https://www.mckinsey.com/business-functions/strategy-and-corporate-finance/our-insights/daniel-kahneman-beware-the-inside-view),” also known as [reference class forecasting](https://en.wikipedia.org/wiki/Reference_class_forecasting). This research provides us with strong evidence in favor of this method of making predictions; however, the situation is complicated by Tetlock’s insistence that other methods are useful as well. This section discusses the evidence and attempts to interpret it.\n\n\nThe GJP asked people who took the training to self-report which of the CHAMPS-KNOW principles they were using when they explained why they made a forecast; 69% of forecast explanations received tags this way. The only principle significantly positively correlated with successful forecasts was C: Comparison classes.[39](https://aiimpacts.org/evidence-on-good-forecasting-practices-from-the-good-judgment-project-an-accompanying-blog-post/#easy-footnote-bottom-39-1260 \"This is from this paper![]() . One worry I have about it is that another principle, P, was strongly associated with inaccuracy, but the authors explain this away by saying that “Post-mortem analyses,” the P’s, are naturally done usually after bad forecasts. This makes me wonder if a similar explanation could be given for the success of the C’s: Questions for which a good reference class exists are easier than others.\") The authors take this as evidence that the outside view is particularly important. Anecdotally, the superforecaster I interviewed agreed that reference class forecasting was perhaps the most important piece of the training. (He also credited the training in general with helping him reach the ranks of the superforecasters.) \n\n\nMoreover, Tetlock did an earlier, much smaller forecasting tournament from 1987-2003, in which experts of various kinds made the forecasts.[40](https://aiimpacts.org/evidence-on-good-forecasting-practices-from-the-good-judgment-project-an-accompanying-blog-post/#easy-footnote-bottom-40-1260 \"The results and conclusions from this tournament can be found in the resulting book, Expert Political Judgment: How good is it? How can we know? See p242 for a description of the methodology and dates.\") The results were astounding: Many of the experts did worse than random chance, and *all of them did worse than simple algorithms*:\n\n\n[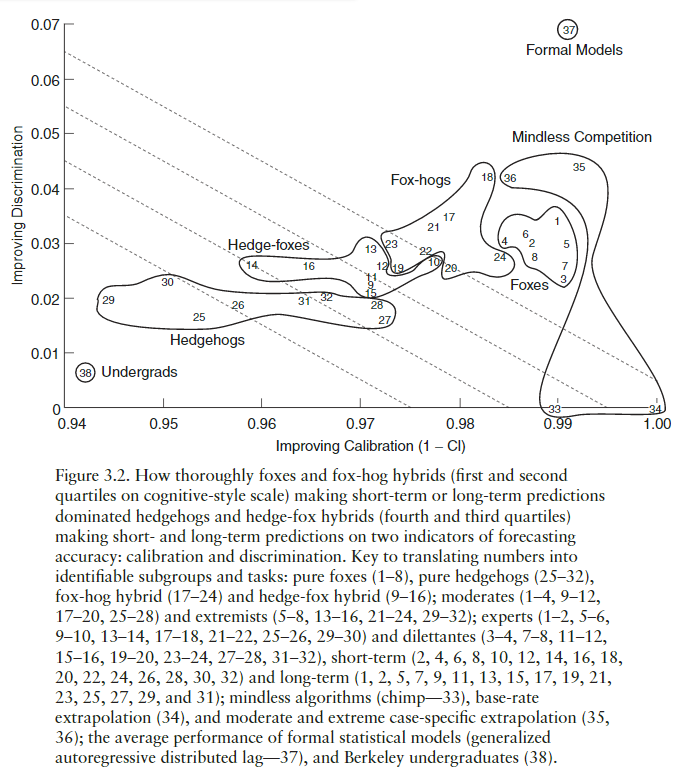](http://aiimpacts.org/wp-content/uploads/2019/02/image10.png)\n\n\nFigure 3.2, pulled from *Expert Political Judgment,* is a gorgeous depiction of some of the main results.[41](https://aiimpacts.org/evidence-on-good-forecasting-practices-from-the-good-judgment-project-an-accompanying-blog-post/#easy-footnote-bottom-41-1260 \"Page 77.\") Tetlock used something very much like a Brier score in this tournament, but he broke it into two components: “Discrimination” and “Calibration.” This graph plots the various experts and algorithms on the axes of discrimination and calibration. Notice in the top right corner the “Formal models” box. I don’t know much about the model used but apparently it was significantly better than all of the humans. This, combined with the fact that simple case-specific trend extrapolations also beat all the humans, is strong evidence for the importance of the outside view.\n\n\nSo we should always use the outside view, right? Well, it’s a bit more complicated than that. Tetlock’s advice is to *start* with the outside view, and then *adjust* using the inside view.[42](https://aiimpacts.org/evidence-on-good-forecasting-practices-from-the-good-judgment-project-an-accompanying-blog-post/#easy-footnote-bottom-42-1260 \"Superforecasting p120\") He even goes so far as to say that *hedgehoggery* and *storytelling* can be valuable when used properly.\n\n\nFirst, what is hedgehoggery? Recall how the human experts fall on a rough spectrum in Figure 3.2, with “hedgehogs” getting the lowest scores and “foxes” getting the highest scores. What makes someone a hedgehog or a fox? Their answers to [these questions](http://www.overcomingbias.com/2006/11/quiz_fox_or_hed.html).[43](https://aiimpacts.org/evidence-on-good-forecasting-practices-from-the-good-judgment-project-an-accompanying-blog-post/#easy-footnote-bottom-43-1260 \"For the data on how these questions were weighted in determining foxyness, see Expert Political Judgment p74\") Tetlock characterizes the distinction as follows:\n\n\nLow scorers look like hedgehogs: thinkers who “know one big thing,” aggressively extend the explanatory reach of that one big thing into new domains, display bristly impatience with those who “do not get it,” and express considerable confidence that they are already pretty proficient forecasters, at least in the long term. High scorers look like foxes: thinkers who know many small things (tricks of their trade), are skeptical of grand schemes, see explanation and prediction not as deductive exercises but rather as exercises in flexible “ad hocery” that require stitching together diverse sources of information, and are rather diffident about their own forecasting prowess, and … rather dubious that the cloudlike subject of politics can be the object of a clocklike science.[44](https://aiimpacts.org/evidence-on-good-forecasting-practices-from-the-good-judgment-project-an-accompanying-blog-post/#easy-footnote-bottom-44-1260 \"Expert Political Judgment p75\")\n\n\nNext, what is storytelling? Using your domain knowledge, you think through a detailed scenario of how the future might go, and you tweak it to make it more plausible, and then you assign a credence based on how plausible it seems. By itself this method is unpromising.[45](https://aiimpacts.org/evidence-on-good-forecasting-practices-from-the-good-judgment-project-an-accompanying-blog-post/#easy-footnote-bottom-45-1260 \"There are several reasons to worry about this method. For one, it’s not what foxes do, and foxes score better than hedgehogs. Tetlock also says it’s not what superforecasters do. More insightfully, Tetlock says we are biased to assign more probability to more vivid and interesting stories, and as a result it’s easy for your probabilities to sum to much more than 1. Anecdote: I was answering a series of “Probability of extinction due to cause X” questions on Metaculus, and I soon realized that my numbers were going to add up to more than 100%, so I had to adjust them all down systematically to make room for the last few kinds of disaster on the list. If I hadn’t been assigning explicit probabilities, I wouldn’t have noticed the error. And if I hadn’t gone through the whole list of possibilities, I would have come away with an unjustifiably high credence in the few I had considered.\")\n\n\nDespite this, Tetlock thinks that storytelling and hedgehoggery are valuable if handled correctly. On hedgehogs, Tetlock says that hedgehogs provide a valuable service by doing the deep thinking necessary to build detailed causal models and raise interesting questions; these models and questions can then be slurped up by foxy superforecasters, evaluated, and aggregated to make good predictions.[46](https://aiimpacts.org/evidence-on-good-forecasting-practices-from-the-good-judgment-project-an-accompanying-blog-post/#easy-footnote-bottom-46-1260 \"Superforecasting p266. This is reminiscent of Yudkowsky’s perspective on what is essentially this same debate.\") The superforecaster Bill Flack is quoted in agreement.[47](https://aiimpacts.org/evidence-on-good-forecasting-practices-from-the-good-judgment-project-an-accompanying-blog-post/#easy-footnote-bottom-47-1260 \" Superforecasting p271.\") As for storytelling, see these slides from Tetlock’s [edge.org seminar](https://www.edge.org/conversation/philip_tetlock-edge-master-class-2015-a-short-course-in-superforecasting-class-v):\n\n\n[](http://aiimpacts.org/wp-content/uploads/2019/02/image4.jpg)\n\n\nAs the second slide indicates, the idea is that we can sometimes “fight fire with fire” by using some stories to counter other stories. In particular, Tetlock says there has been success using stories about the past—about ways that the world could have gone, but didn’t—to “reconnect us to our past states of ignorance.”[48](https://aiimpacts.org/evidence-on-good-forecasting-practices-from-the-good-judgment-project-an-accompanying-blog-post/#easy-footnote-bottom-48-1260 \"Same seminar.\") The superforecaster I interviewed said that it is common practice now on superforecaster forums to have a designated “red team” with the explicit mission of finding counter-arguments to whatever the consensus seems to be. This, I take it, is an example of motivated reasoning being put to good use. \n\n\nMoreover, arguably the outside view simply isn’t useful for some questions.[49](https://aiimpacts.org/evidence-on-good-forecasting-practices-from-the-good-judgment-project-an-accompanying-blog-post/#easy-footnote-bottom-49-1260 \"For example, see Yudkowsky: “Where two sides disagree, this can lead to reference class tennis—both parties get stuck insisting that their own “outside view” is the correct one, based on diverging intuitions about what similarities are relevant. If it isn’t clear what the set of “similar historical cases” is, or what conclusions we should draw from those cases, then we’re forced to use an inside view—thinking about the causal process to distinguish relevant similarities from irrelevant ones. You shouldn’t avoid outside-view-style reasoning in cases where it looks likely to work, like when planning your Christmas shopping. But in many contexts, the outside view simply can’t compete with a good theory.”\") People say this about lots of things—e.g. “The world is changing so fast, so the current situation in Syria is unprecedented and historical averages will be useless!”—and are proven wrong; for example, this research seems to indicate that the outside view is far more useful in geopolitics than people think. Nevertheless, maybe it is true for some of the things we wish to predict about advanced AI. After all, a major limitation of this data is that the questions were mainly on geopolitical events only a few years in the future at most. (Geopolitical events seem to be somewhat predictable up to two years out but much more difficult to predict five, ten, twenty years out.)[50](https://aiimpacts.org/evidence-on-good-forecasting-practices-from-the-good-judgment-project-an-accompanying-blog-post/#easy-footnote-bottom-50-1260 \"Tetlock admits that “there is no evidence that geopolitical or economic forecasters can predict anything ten years out beyond the excruciatingly obvious… These limits on predictability are the predictable results of the butterfly dynamics of nonlinear systems. In my EPJ research, the accuracy of expert predictions declined toward chance five years out.” (Superforecasting p243) I highly recommend the graphic on that page, by the way, also available here: “Thoughts for the 2001 Quadrennial Defense Review.”\") So this research does not *directly* tell us anything about the predictability of the events AI Impacts is interested in, nor about the usefulness of reference-class forecasting for those domains.[51](https://aiimpacts.org/evidence-on-good-forecasting-practices-from-the-good-judgment-project-an-accompanying-blog-post/#easy-footnote-bottom-51-1260 \"The superforecaster I interviewed speculated that predicting things like the continued drop in price of computing hardware or solar panels is fairly easy, but that predicting the appearance of new technologies is very difficult. Tetlock has ideas for how to handle longer-term, nebulous questions. He calls it “Bayesian Question Clustering.” (Superforecasting 263) The idea is to take the question you really want to answer and look for more precise questions that are evidentially relevant to the question you care about. Tetlock intends to test the effectiveness of this idea in future research.\")\n\n\nThat said, the forecasting best practices discovered by this research seem like general truth-finding skills rather than cheap hacks only useful in geopolitics or only useful for near-term predictions. After all, geopolitical questions are themselves a fairly diverse bunch, yet accuracy on some was highly correlated with accuracy on others.[52](https://aiimpacts.org/evidence-on-good-forecasting-practices-from-the-good-judgment-project-an-accompanying-blog-post/#easy-footnote-bottom-52-1260 \"“There are several ways to look for individual consistency across questions. We sorted questions on the basis of response format (binary, multinomial, conditional, ordered), region (Eurzone, Latin America, China, etc.), and duration of question (short, medium, and long). We computed accuracy scores for each individual on each variable within each set (e.g., binary, multinomial, conditional, and ordered) and then constructed correlation matrices. For all three question types, correlations were positive… Then we conducted factor analyses. For each question type, a large proportion of the variance was captured by a single factor, consistent with the hypothesis that one underlying dimension was necessary to capture correlations among response formats, regions, and question duration.” (from this study
. One worry I have about it is that another principle, P, was strongly associated with inaccuracy, but the authors explain this away by saying that “Post-mortem analyses,” the P’s, are naturally done usually after bad forecasts. This makes me wonder if a similar explanation could be given for the success of the C’s: Questions for which a good reference class exists are easier than others.\") The authors take this as evidence that the outside view is particularly important. Anecdotally, the superforecaster I interviewed agreed that reference class forecasting was perhaps the most important piece of the training. (He also credited the training in general with helping him reach the ranks of the superforecasters.) \n\n\nMoreover, Tetlock did an earlier, much smaller forecasting tournament from 1987-2003, in which experts of various kinds made the forecasts.[40](https://aiimpacts.org/evidence-on-good-forecasting-practices-from-the-good-judgment-project-an-accompanying-blog-post/#easy-footnote-bottom-40-1260 \"The results and conclusions from this tournament can be found in the resulting book, Expert Political Judgment: How good is it? How can we know? See p242 for a description of the methodology and dates.\") The results were astounding: Many of the experts did worse than random chance, and *all of them did worse than simple algorithms*:\n\n\n[](http://aiimpacts.org/wp-content/uploads/2019/02/image10.png)\n\n\nFigure 3.2, pulled from *Expert Political Judgment,* is a gorgeous depiction of some of the main results.[41](https://aiimpacts.org/evidence-on-good-forecasting-practices-from-the-good-judgment-project-an-accompanying-blog-post/#easy-footnote-bottom-41-1260 \"Page 77.\") Tetlock used something very much like a Brier score in this tournament, but he broke it into two components: “Discrimination” and “Calibration.” This graph plots the various experts and algorithms on the axes of discrimination and calibration. Notice in the top right corner the “Formal models” box. I don’t know much about the model used but apparently it was significantly better than all of the humans. This, combined with the fact that simple case-specific trend extrapolations also beat all the humans, is strong evidence for the importance of the outside view.\n\n\nSo we should always use the outside view, right? Well, it’s a bit more complicated than that. Tetlock’s advice is to *start* with the outside view, and then *adjust* using the inside view.[42](https://aiimpacts.org/evidence-on-good-forecasting-practices-from-the-good-judgment-project-an-accompanying-blog-post/#easy-footnote-bottom-42-1260 \"Superforecasting p120\") He even goes so far as to say that *hedgehoggery* and *storytelling* can be valuable when used properly.\n\n\nFirst, what is hedgehoggery? Recall how the human experts fall on a rough spectrum in Figure 3.2, with “hedgehogs” getting the lowest scores and “foxes” getting the highest scores. What makes someone a hedgehog or a fox? Their answers to [these questions](http://www.overcomingbias.com/2006/11/quiz_fox_or_hed.html).[43](https://aiimpacts.org/evidence-on-good-forecasting-practices-from-the-good-judgment-project-an-accompanying-blog-post/#easy-footnote-bottom-43-1260 \"For the data on how these questions were weighted in determining foxyness, see Expert Political Judgment p74\") Tetlock characterizes the distinction as follows:\n\n\nLow scorers look like hedgehogs: thinkers who “know one big thing,” aggressively extend the explanatory reach of that one big thing into new domains, display bristly impatience with those who “do not get it,” and express considerable confidence that they are already pretty proficient forecasters, at least in the long term. High scorers look like foxes: thinkers who know many small things (tricks of their trade), are skeptical of grand schemes, see explanation and prediction not as deductive exercises but rather as exercises in flexible “ad hocery” that require stitching together diverse sources of information, and are rather diffident about their own forecasting prowess, and … rather dubious that the cloudlike subject of politics can be the object of a clocklike science.[44](https://aiimpacts.org/evidence-on-good-forecasting-practices-from-the-good-judgment-project-an-accompanying-blog-post/#easy-footnote-bottom-44-1260 \"Expert Political Judgment p75\")\n\n\nNext, what is storytelling? Using your domain knowledge, you think through a detailed scenario of how the future might go, and you tweak it to make it more plausible, and then you assign a credence based on how plausible it seems. By itself this method is unpromising.[45](https://aiimpacts.org/evidence-on-good-forecasting-practices-from-the-good-judgment-project-an-accompanying-blog-post/#easy-footnote-bottom-45-1260 \"There are several reasons to worry about this method. For one, it’s not what foxes do, and foxes score better than hedgehogs. Tetlock also says it’s not what superforecasters do. More insightfully, Tetlock says we are biased to assign more probability to more vivid and interesting stories, and as a result it’s easy for your probabilities to sum to much more than 1. Anecdote: I was answering a series of “Probability of extinction due to cause X” questions on Metaculus, and I soon realized that my numbers were going to add up to more than 100%, so I had to adjust them all down systematically to make room for the last few kinds of disaster on the list. If I hadn’t been assigning explicit probabilities, I wouldn’t have noticed the error. And if I hadn’t gone through the whole list of possibilities, I would have come away with an unjustifiably high credence in the few I had considered.\")\n\n\nDespite this, Tetlock thinks that storytelling and hedgehoggery are valuable if handled correctly. On hedgehogs, Tetlock says that hedgehogs provide a valuable service by doing the deep thinking necessary to build detailed causal models and raise interesting questions; these models and questions can then be slurped up by foxy superforecasters, evaluated, and aggregated to make good predictions.[46](https://aiimpacts.org/evidence-on-good-forecasting-practices-from-the-good-judgment-project-an-accompanying-blog-post/#easy-footnote-bottom-46-1260 \"Superforecasting p266. This is reminiscent of Yudkowsky’s perspective on what is essentially this same debate.\") The superforecaster Bill Flack is quoted in agreement.[47](https://aiimpacts.org/evidence-on-good-forecasting-practices-from-the-good-judgment-project-an-accompanying-blog-post/#easy-footnote-bottom-47-1260 \" Superforecasting p271.\") As for storytelling, see these slides from Tetlock’s [edge.org seminar](https://www.edge.org/conversation/philip_tetlock-edge-master-class-2015-a-short-course-in-superforecasting-class-v):\n\n\n[](http://aiimpacts.org/wp-content/uploads/2019/02/image4.jpg)\n\n\nAs the second slide indicates, the idea is that we can sometimes “fight fire with fire” by using some stories to counter other stories. In particular, Tetlock says there has been success using stories about the past—about ways that the world could have gone, but didn’t—to “reconnect us to our past states of ignorance.”[48](https://aiimpacts.org/evidence-on-good-forecasting-practices-from-the-good-judgment-project-an-accompanying-blog-post/#easy-footnote-bottom-48-1260 \"Same seminar.\") The superforecaster I interviewed said that it is common practice now on superforecaster forums to have a designated “red team” with the explicit mission of finding counter-arguments to whatever the consensus seems to be. This, I take it, is an example of motivated reasoning being put to good use. \n\n\nMoreover, arguably the outside view simply isn’t useful for some questions.[49](https://aiimpacts.org/evidence-on-good-forecasting-practices-from-the-good-judgment-project-an-accompanying-blog-post/#easy-footnote-bottom-49-1260 \"For example, see Yudkowsky: “Where two sides disagree, this can lead to reference class tennis—both parties get stuck insisting that their own “outside view” is the correct one, based on diverging intuitions about what similarities are relevant. If it isn’t clear what the set of “similar historical cases” is, or what conclusions we should draw from those cases, then we’re forced to use an inside view—thinking about the causal process to distinguish relevant similarities from irrelevant ones. You shouldn’t avoid outside-view-style reasoning in cases where it looks likely to work, like when planning your Christmas shopping. But in many contexts, the outside view simply can’t compete with a good theory.”\") People say this about lots of things—e.g. “The world is changing so fast, so the current situation in Syria is unprecedented and historical averages will be useless!”—and are proven wrong; for example, this research seems to indicate that the outside view is far more useful in geopolitics than people think. Nevertheless, maybe it is true for some of the things we wish to predict about advanced AI. After all, a major limitation of this data is that the questions were mainly on geopolitical events only a few years in the future at most. (Geopolitical events seem to be somewhat predictable up to two years out but much more difficult to predict five, ten, twenty years out.)[50](https://aiimpacts.org/evidence-on-good-forecasting-practices-from-the-good-judgment-project-an-accompanying-blog-post/#easy-footnote-bottom-50-1260 \"Tetlock admits that “there is no evidence that geopolitical or economic forecasters can predict anything ten years out beyond the excruciatingly obvious… These limits on predictability are the predictable results of the butterfly dynamics of nonlinear systems. In my EPJ research, the accuracy of expert predictions declined toward chance five years out.” (Superforecasting p243) I highly recommend the graphic on that page, by the way, also available here: “Thoughts for the 2001 Quadrennial Defense Review.”\") So this research does not *directly* tell us anything about the predictability of the events AI Impacts is interested in, nor about the usefulness of reference-class forecasting for those domains.[51](https://aiimpacts.org/evidence-on-good-forecasting-practices-from-the-good-judgment-project-an-accompanying-blog-post/#easy-footnote-bottom-51-1260 \"The superforecaster I interviewed speculated that predicting things like the continued drop in price of computing hardware or solar panels is fairly easy, but that predicting the appearance of new technologies is very difficult. Tetlock has ideas for how to handle longer-term, nebulous questions. He calls it “Bayesian Question Clustering.” (Superforecasting 263) The idea is to take the question you really want to answer and look for more precise questions that are evidentially relevant to the question you care about. Tetlock intends to test the effectiveness of this idea in future research.\")\n\n\nThat said, the forecasting best practices discovered by this research seem like general truth-finding skills rather than cheap hacks only useful in geopolitics or only useful for near-term predictions. After all, geopolitical questions are themselves a fairly diverse bunch, yet accuracy on some was highly correlated with accuracy on others.[52](https://aiimpacts.org/evidence-on-good-forecasting-practices-from-the-good-judgment-project-an-accompanying-blog-post/#easy-footnote-bottom-52-1260 \"“There are several ways to look for individual consistency across questions. We sorted questions on the basis of response format (binary, multinomial, conditional, ordered), region (Eurzone, Latin America, China, etc.), and duration of question (short, medium, and long). We computed accuracy scores for each individual on each variable within each set (e.g., binary, multinomial, conditional, and ordered) and then constructed correlation matrices. For all three question types, correlations were positive… Then we conducted factor analyses. For each question type, a large proportion of the variance was captured by a single factor, consistent with the hypothesis that one underlying dimension was necessary to capture correlations among response formats, regions, and question duration.” (from this study![]() )\") So despite these limitations I think we should do our best to imitate these best-practices, and that means using the outside view far more than we would naturally be inclined.\n\n\nOne final thing worth saying is that, remember, the GJP’s aggregated judgments did at least as well as the best superforecasters.[53](https://aiimpacts.org/evidence-on-good-forecasting-practices-from-the-good-judgment-project-an-accompanying-blog-post/#easy-footnote-bottom-53-1260 \" I haven’t found this said explicitly, but I infer this from Doug Lorch, the best superforecaster in Year 2, beating the control group by at least 60% when the GJP beat the control group by 78%. (Superforecasting 93, 18) That said, page 72 seems to say that in Year 2 exactly one person—Doug Lorch—managed to beat the aggregation algorithm. This is almost a contradiction; I’m not sure what to make of it. At any rate, it seems that the aggregation algorithm pretty reliably does better than the superforecasters in general, even if occasionally one of them beats it.\") Presumably at least one of the forecasters in the tournament was using the outside view a lot; after all, half of them were trained in reference-class forecasting. So I think we can conclude that straightforwardly using the outside view as often as possible wouldn’t get you better scores than the GJP, though it might get you close for all we know. Anecdotally, it seems that when the superforecasters use the outside view they often aggregate between different reference-class forecasts.[54](https://aiimpacts.org/evidence-on-good-forecasting-practices-from-the-good-judgment-project-an-accompanying-blog-post/#easy-footnote-bottom-54-1260 \"This is on page 304. Another example on 313.\") The wisdom of the crowds is powerful; this is consistent with the wider literature on the cognitive superiority of groups, and the literature on ensemble methods in AI.[55](https://aiimpacts.org/evidence-on-good-forecasting-practices-from-the-good-judgment-project-an-accompanying-blog-post/#easy-footnote-bottom-55-1260 \"For more on these, see this page.\")\n\n\nTetlock describes how superforecasters go about making their predictions.[56](https://aiimpacts.org/evidence-on-good-forecasting-practices-from-the-good-judgment-project-an-accompanying-blog-post/#easy-footnote-bottom-56-1260 \"This is my summary of Tetlock’s advice in Chapter 5: “Ultimately, it’s not the number crunching power that counts. It’s how you use it. … You’ve Fermi-ized the question, consulted the outside view, and now, finally, you can consult the inside view … So you have an outside view and an inside view. Now they have to be merged. …”\") Here is an attempt at a summary:\n\n\n1. Sometimes a question can be answered more rigorously if it is first “Fermi-ized,” i.e. broken down into sub-questions for which more rigorous methods can be applied.\n2. Next, use the outside view on the sub-questions (and/or the main question, if possible). You may then adjust your estimates using other considerations (‘the inside view’), but do this cautiously.\n3. Seek out other perspectives, both on the sub-questions and on how to Fermi-ize the main question. You can also generate other perspectives yourself.\n4. Repeat steps 1 – 3 until you hit diminishing returns.\n5. Your final prediction should be based on an aggregation of various models, reference classes, other experts, etc.\n\n\n**Footnotes**\n-------------\n\n\n\n", "url": "https://aiimpacts.org/evidence-on-good-forecasting-practices-from-the-good-judgment-project-an-accompanying-blog-post/", "title": "Evidence on good forecasting practices from the Good Judgment Project: an accompanying blog post", "source": "aiimpacts.org", "source_type": "wordpress", "date_published": "2019-02-07T22:25:29+00:00", "paged_url": "https://aiimpacts.org/feed?paged=12", "authors": ["Daniel Kokotajlo"], "id": "bce5d0c3270226ccd88ef8e65cade88a", "summary": []}
{"text": "Evidence on good forecasting practices from the Good Judgment Project\n\nAccording to experience and data from the Good Judgment Project, the following are associated with successful forecasting, in rough decreasing order of combined importance and confidence:\n\n\n* Past performance in the same broad domain\n* Making more predictions on the same question\n* Deliberation time\n* Collaboration on teams\n* Intelligence\n* Domain expertise\n* Having taken a one-hour training module on these topics\n* ‘Cognitive reflection’ test scores\n* ‘Active open-mindedness’\n* Aggregation of individual judgments\n* Use of precise probabilistic predictions\n* Use of ‘the outside view’\n* ‘Fermi-izing’\n* ‘Bayesian reasoning’\n* Practice\n\n\n\n\n**Details**\n-----------\n\n\n### **1. 1. Process**\n\n\nThe Good Judgment Project (GJP) was the winning team in IARPA’s 2011-2015 forecasting tournament. In the tournament, six teams assigned probabilistic answers to hundreds of questions about geopolitical events months to a year in the future. Each competing team used a different method for coming up with their guesses, so the tournament helps us to evaluate different forecasting methods.\n\n\nThe GJP team, led by Philip Tetlock and Barbara Mellers, gathered thousands of online volunteers and had them answer the tournament questions. They then made their official forecasts by aggregating these answers. In the process, the team collected data about the patterns of performance in their volunteers, and experimented with aggregation methods and improvement interventions. For example, they ran an RCT to test the effect of a short training program on forecasting accuracy. They especially focused on identifying and making use of the most successful two percent of forecasters, dubbed ‘superforecasters’.\n\n\nTetlock’s book *Superforecasting* describes this process and Tetlock’s resulting understanding of how to forecast well.\n\n\n \n\n\n### **1.2. Correlates of successful forecasting**\n\n\n#### 1.2.1. Past performance\n\n\nRoughly 70% of the superforecasters maintained their status from one year to the next [1](https://aiimpacts.org/evidence-on-good-forecasting-practices-from-the-good-judgment-project/#easy-footnote-bottom-1-1283 \" Superforecasting p104 \"). Across all the forecasters, the correlation between performance in one year and performance in the next year was 0.65 [2](https://aiimpacts.org/evidence-on-good-forecasting-practices-from-the-good-judgment-project/#easy-footnote-bottom-2-1283 \" Superforecasting p104 \"). These high correlations are particularly impressive because the forecasters were online volunteers; presumably substantial variance year-to-year came from forecasters throttling down their engagement due to fatigue or changing life circumstances [3](https://aiimpacts.org/evidence-on-good-forecasting-practices-from-the-good-judgment-project/#easy-footnote-bottom-3-1283 \" Technically the forecasters were paid, up to $250 per season. (Superforecasting p72) However their payments did not depend on how accurate they were or how much effort they put in, beyond the minimum. \").\n\n\n \n\n\n#### 1.2.2. Behavioral and dispositional variables\n\n\nTable 2 depicts the correlations between measured variables amongst GJP’s volunteers in the first two years of the tournament [4](https://aiimpacts.org/evidence-on-good-forecasting-practices-from-the-good-judgment-project/#easy-footnote-bottom-4-1283 \" The table is from Mellers et al 2015. “Del time” is deliberation time. \"). Each is described in more detail below.\n\n\n[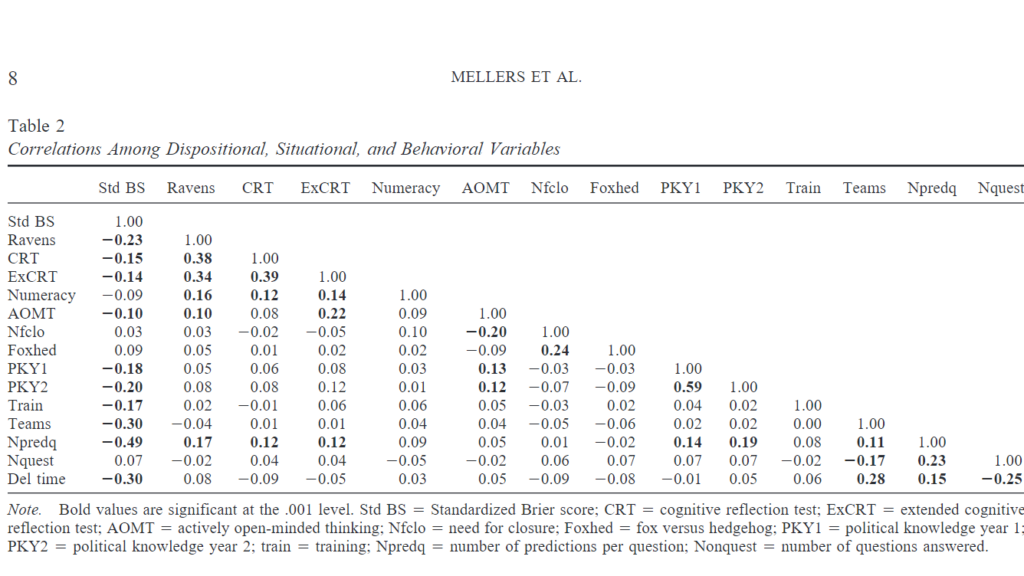](http://aiimpacts.org/wp-content/uploads/2019/02/image2-1.png)\n\n\nThe first column shows the relationship between each variable and standardized [Brier score](https://en.wikipedia.org/wiki/Brier_score), which is a measure of inaccuracy: higher Brier scores mean less accuracy, so negative correlations are good. “Ravens” is an IQ test; “Del time” is deliberation time, and “teams” is whether or not the forecaster was assigned to a team. “Actively open-minded thinking” is an attempt to measure “the tendency to evaluate arguments and evidence without undue bias from one’s own prior beliefs—and with recognition of the fallibility of one’s judgment.” [5](https://aiimpacts.org/evidence-on-good-forecasting-practices-from-the-good-judgment-project/#easy-footnote-bottom-5-1283 \" “Nonetheless, as we saw in the structural model, and confirm here, the best model uses dispositional, situational, and behavioral variables. The combination produced a multiple correlation of .64.” This is from Mellers et al 2015. \")\n\n\nThe authors conducted various statistical analyses to explore the relationships between these variables. They computed a structural equation model to predict a forecaster’s accuracy:\n\n\n[](http://aiimpacts.org/wp-content/uploads/2019/02/image1-1.png)\n\n\nYellow ovals are latent dispositional variables, yellow rectangles are observed dispositional variables, pink rectangles are experimentally manipulated situational variables, and green rectangles are observed behavioral variables. This model has a [multiple correlation](https://en.wikipedia.org/wiki/Multiple_correlation) of 0.64.[6](https://aiimpacts.org/evidence-on-good-forecasting-practices-from-the-good-judgment-project/#easy-footnote-bottom-6-1283 \" This is from Mellers et al 2015. \")\n\n\nAs these data indicate, domain knowledge, intelligence, active open-mindedness, and working in teams each contribute substantially to accuracy. We can also conclude that effort helps, because deliberation time and number of predictions made per question (“belief updating”) both improved accuracy. Finally, training also helps. This is especially surprising because the training module lasted only an hour and its effects persisted for at least a year. The module included content about probabilistic reasoning, using the outside view, avoiding biases, and more.\n\n\n \n\n\n### **1.3. Aggregation algorithms**\n\n\nGJP made their official predictions by aggregating and extremizing the predictions of their volunteers. The aggregation algorithm was elitist, meaning that it weighted more heavily people who were better on various metrics. [7](https://aiimpacts.org/evidence-on-good-forecasting-practices-from-the-good-judgment-project/#easy-footnote-bottom-7-1283 \" On the webpage, it says forecasters with better track-records and those who update more frequently get weighted more. In these slides, Tetlock describes the elitism differently: He says it gives weight to higher-IQ, more open-minded forecasters. \") The extremizing step pushes the aggregated judgment closer to 1 or 0, to make it more confident. The degree to which they extremize depends on how diverse and sophisticated the pool of forecasters is. [8](https://aiimpacts.org/evidence-on-good-forecasting-practices-from-the-good-judgment-project/#easy-footnote-bottom-8-1283 \" The academic papers on this topic are Satopaa et al 2013 and Baron et al 2014. \") Whether extremizing is a good idea is still controversial. [9](https://aiimpacts.org/evidence-on-good-forecasting-practices-from-the-good-judgment-project/#easy-footnote-bottom-9-1283 \" According to one expert I interviewed, more recent data suggests that the successes of the extremizing algorithm during the forecasting tournament were a fluke. After all, a priori one would expect extremizing to lead to small improvements in accuracy most of the time, but big losses in accuracy some of the time. \") \n\n\nGJP beat all of the other teams. They consistently beat the control group—which was a forecast made by averaging ordinary forecasters—by more than 60%. [10](https://aiimpacts.org/evidence-on-good-forecasting-practices-from-the-good-judgment-project/#easy-footnote-bottom-10-1283 \" Superforecasting p18. \") They also beat a prediction market inside the intelligence community—populated by professional analysts with access to classified information—by 25-30%. [11](https://aiimpacts.org/evidence-on-good-forecasting-practices-from-the-good-judgment-project/#easy-footnote-bottom-11-1283 \" This is from this seminar. \")\n\n\nThat said, individual superforecasters did almost as well, so the elitism of the algorithm may account for a lot of its success.[12](https://aiimpacts.org/evidence-on-good-forecasting-practices-from-the-good-judgment-project/#easy-footnote-bottom-12-1283 \" For example, in year 2 one superforecaster beat the extremizing algorithm. More generally, as discussed in this seminar, the aggregation algorithm produces the greatest improvement with ordinary forecasters; the superforecasters were good enough that it didn’t help much. \")\n\n\n \n\n\n### **1.4. Outside View**\n\n\nThe forecasters who received training were asked to record, for each prediction, which parts of the training they used to make it. Some parts of the training—e.g. “Post-mortem analysis”—were correlated with inaccuracy, but others—most notably “Comparison classes”—were correlated with accuracy. [13](https://aiimpacts.org/evidence-on-good-forecasting-practices-from-the-good-judgment-project/#easy-footnote-bottom-13-1283 \" This is from Chang et al 2016. The average brier score of answers tagged “comparison classes” was 0.17, while the next-best tag averaged 0.26.\") ‘Comparison classes’ is another term for [reference-class forecasting](https://en.wikipedia.org/wiki/Reference_class_forecasting), also known as ‘the outside view’. It is the method of assigning a probability by straightforward extrapolation from similar past situations and their outcomes. \n\n\n \n\n\n### **1.5. Tetlock’s “Portrait of the modal superforecaster”**\n\n\nThis subsection and those that follow will lay out some more qualitative results, things that Tetlock recommends on the basis of his research and interviews with superforecasters. Here is Tetlock’s “portrait of the modal superforecaster:” [14](https://aiimpacts.org/evidence-on-good-forecasting-practices-from-the-good-judgment-project/#easy-footnote-bottom-14-1283 \" Superforecasting p191 \")\n\n\n**Philosophic outlook:**\n\n\n* **Cautious:** Nothing is certain.\n* **Humble:** Reality is infinitely complex.\n* **Nondeterministic:** Whatever happens is not meant to be and does not have to happen.\n\n\n**Abilities & thinking styles:**\n\n\n* **Actively open-minded:** Beliefs are hypotheses to be tested, not treasures to be protected.\n* **Intelligent and knowledgeable, with a “Need for Cognition”:** Intellectually curious, enjoy puzzles and mental challenges.\n* **Reflective:** Introspective and self-critical\n* **Numerate:** Comfortable with numbers\n\n\n**Methods of forecasting:**\n\n\n* **Pragmatic:** Not wedded to any idea or agenda\n* **Analytical:** Capable of stepping back from the tip-of-your-nose perspective and considering other views\n* **Dragonfly-eyed:** Value diverse views and synthesize them into their own\n* **Probabilistic:** Judge using many grades of maybe\n* **Thoughtful updaters:** When facts change, they change their minds\n* **Good intuitive psychologists:** Aware of the value of checking thinking for cognitive and emotional biases [15](https://aiimpacts.org/evidence-on-good-forecasting-practices-from-the-good-judgment-project/#easy-footnote-bottom-15-1283 \" There is experimental evidence that superforecasters are less prone to standard cognitive science biases than ordinary people. From edge.org: Mellers: “We have given them lots of Kahneman and Tversky-like problems to see if they fall prey to the same sorts of biases and errors. The answer is sort of, some of them do, but not as many. It’s not nearly as frequent as you see with the rest of us ordinary mortals. The other thing that’s interesting is they don’t make the kinds of mistakes that regular people make instead of the right answer. They do something that’s a little bit more thoughtful. They integrate base rates with case-specific information a little bit more.” \")\n\n\n**Work ethic:**\n\n\n* **Growth mindset:** Believe it’s possible to get better\n* **Grit:** Determined to keep at it however long it takes\n\n\n \n\n\n### **1.6. Tetlock’s “Ten Commandments for Aspiring Superforecasters:”**\n\n\nThis advice is given at the end of the book, and may make less sense to someone who hasn’t read the book. A full transcript of these commandments can be found [here](https://www.lesswrong.com/posts/dvYeSKDRd68GcrWoe/ten-commandments-for-aspiring-superforecasters); this is a summary:\n\n\n**(1) Triage:** Don’t waste time on questions that are “clocklike” where a rule of thumb can get you pretty close to the correct answer, or “cloudlike” where even fancy models can’t beat a dart-throwing chimp. \n\n\n**(2) Break seemingly intractable problems into tractable sub-problems:** This is how Fermi estimation works. One related piece of advice is “be wary of accidentally substituting an easy question for a hard one,” e.g. substituting “Would Israel be willing to assassinate Yasser Arafat?” for “Will at least one of the tests for polonium in Arafat’s body turn up positive?” \n\n\n**(3) Strike the right balance between inside and outside views:** In particular, *first* anchor with the outside view and *then* adjust using the inside view.\n\n\n**(4) Strike the right balance between under- and overreacting to evidence:** Usually do many small updates, but occasionally do big updates when the situation calls for it. Remember to think about P(E|H)/P(E|~H); remember to avoid the base-rate fallacy. “Superforecasters aren’t perfect Bayesian predictors but they are much better than most of us.” [16](https://aiimpacts.org/evidence-on-good-forecasting-practices-from-the-good-judgment-project/#easy-footnote-bottom-16-1283 \" Superforecasting p281 \")\n\n\n**(5) Look for the clashing causal forces at work in each problem:** This is the “dragonfly eye perspective,” which is where you attempt to do a sort of mental wisdom of the crowds: Have tons of different causal models and aggregate their judgments. Use “Devil’s advocate” reasoning. If you think that P, try hard to convince yourself that not-P. You should find yourself saying “On the one hand… on the other hand… on the third hand…” a lot.\n\n\n**(6) Strive to distinguish as many degrees of doubt as the problem permits but no more.**\n\n\n**(7) Strike the right balance between under- and overconfidence, between prudence and decisiveness.**\n\n\n**(8) Look for the errors behind your mistakes but beware of rearview-mirror hindsight biases.**\n\n\n**(9) Bring out the best in others and let others bring out the best in you.** The book spent a whole chapter on this, using the Wehrmacht as an extended case study on good team organization. One pervasive guiding principle is “Don’t tell people how to do things; tell them what you want accomplished, and they’ll surprise you with their ingenuity in doing it.” The other pervasive guiding principle is “Cultivate a culture in which people—even subordinates—are encouraged to dissent and give counterarguments.” [17](https://aiimpacts.org/evidence-on-good-forecasting-practices-from-the-good-judgment-project/#easy-footnote-bottom-17-1283 \" See e.g. page 284 of Superforecasting, and the entirety of chapter 9. \")\n\n\n**(10) Master the error-balancing bicycle:** This one should have been called practice, practice, practice. Tetlock says that reading the news and generating probabilities isn’t enough; you need to actually score your predictions so that you know how wrong you were.\n\n\n**(11) Don’t treat commandments as commandments:** Tetlock’s point here is simply that you should use your judgment about whether to follow a commandment or not; sometimes they should be overridden.\n\n\n \n\n\n### **1.7. Recipe for Making Predictions**\n\n\nTetlock describes how superforecasters go about making their predictions. [18](https://aiimpacts.org/evidence-on-good-forecasting-practices-from-the-good-judgment-project/#easy-footnote-bottom-18-1283 \" See Chapter 5: “Ultimately, it’s not the number crunching power that counts. It’s how you use it. … You’ve Fermi-ized the question, consulted the outside view, and now, finally, you can consult the inside view … So you have an outside view and an inside view. Now they have to be merged. …” \") Here is an attempt at a summary:\n\n\n1. Sometimes a question can be answered more rigorously if it is first “Fermi-ized,” i.e. broken down into sub-questions for which more rigorous methods can be applied.\n2. Next, use the outside view on the sub-questions (and/or the main question, if possible). You may then adjust your estimates using other considerations (‘the inside view’), but do this cautiously.\n3. Seek out other perspectives, both on the sub-questions and on how to Fermi-ize the main question. You can also generate other perspectives yourself.\n4. Repeat steps 1 – 3 until you hit diminishing returns.\n5. Your final prediction should be based on an aggregation of various models, reference classes, other experts, etc.\n\n\n \n\n\n### **1.8.** **Bayesian reasoning & precise probabilistic forecasts**\n\n\nHumans normally express uncertainty with terms like “maybe” and “almost certainly” and “a significant chance.” Tetlock advocates for thinking and speaking in probabilities instead. He recounts many anecdotes of misunderstandings that might have been avoided this way. For example:\n\n\nIn 1961, when the CIA was planning to topple the Castro government by landing a small army of Cuban expatriates at the Bay of Pigs, President John F. Kennedy turned to the military for an unbiased assessment. The Joint Chiefs of Staff concluded that the plan had a “fair chance” of success. The man who wrote the words “fair chance” later said he had in mind odds of 3 to 1 against success. But Kennedy was never told precisely what “fair chance” meant and, not unreasonably, he took it to be a much more positive assessment. [19](https://aiimpacts.org/evidence-on-good-forecasting-practices-from-the-good-judgment-project/#easy-footnote-bottom-19-1283 \" Superforecasting 44 \")\n\n\nThis example hints at another advantage of probabilistic judgments: It’s harder to weasel out of them afterwards, and therefore easier to keep score. Keeping score is crucial for getting feedback from reality, which is crucial for building up expertise.\n\n\nA standard criticism of using probabilities is that they merely conceal uncertainty rather than quantify it—after all, the numbers you pick are themselves guesses. This may be true for people who haven’t practiced much, but it isn’t true for superforecasters, who are impressively well-calibrated and whose accuracy scores decrease when you round their predictions to the nearest 0.05. (EDIT: This should be 0.1)[20](https://aiimpacts.org/evidence-on-good-forecasting-practices-from-the-good-judgment-project/#easy-footnote-bottom-20-1283 \" The superforecasters had a calibration of 0.01, which means that the average difference between a probability they use and the true frequency of occurrence is 0.01. This is from Mellers et al 2015. The fact about rounding their predictions is from Friedman et al 2018. EDIT: Seems I was wrong, thanks to this commenter for noticing.https://www.metaculus.com/questions/4166/the-lightning-round-tournament-comparing-metaculus-forecasters-to-infectious-disease-experts/#comment-28756\")\n\n\nBayesian reasoning is a natural next step once you are thinking and talking probabilities—it is the theoretical ideal in several important ways [21](https://aiimpacts.org/evidence-on-good-forecasting-practices-from-the-good-judgment-project/#easy-footnote-bottom-21-1283 \" For an excellent introduction to Bayesian reasoning and its theoretical foundations, see Strevens’ textbook-like lecture notes. Some of the facts summarized in this paragraph about Superforecasters and Bayesianism can be found on pages 169-172, 281, and 314 of Superforecasting. \") —and Tetlock’s experience and interviews with superforecasters seems to bear this out. Superforecasters seem to do many small updates, with occasional big updates, just as Bayesianism would predict. They recommend thinking in the Bayesian way, and often explicitly make Bayesian calculations. They are good at breaking down difficult questions into more manageable parts and chaining the probabilities together properly.\n\n\n \n\n\n**2. Discussion: Relevance to AI Forecasting**\n----------------------------------------------\n\n\n### **2.1. Limitations**\n\n\nA major limitation is that the forecasts were mainly on geopolitical events only a few years in the future at most. (Uncertain geopolitical events seem to be somewhat predictable up to two years out but much more difficult to predict five years out.) [22](https://aiimpacts.org/evidence-on-good-forecasting-practices-from-the-good-judgment-project/#easy-footnote-bottom-22-1283 \" Tetlock admits that “there is no evidence that geopolitical or economic forecasters can predict anything ten years out beyond the excruciatingly obvious… These limits on predictability are the predictable results of the butterfly dynamics of nonlinear systems. In my EPJ research, the accuracy of expert predictions declined toward chance five years out.” (Superforecasting p243) \") So evidence from the GJP may not generalize to forecasting other types of events (e.g. technological progress and social consequences) or events further in the future. \n\n\nThat said, the forecasting best practices discovered by this research are not overtly specific to geopolitics or near-term events. Also, geopolitical questions are diverse and accuracy on some was highly correlated with accuracy on others. [23](https://aiimpacts.org/evidence-on-good-forecasting-practices-from-the-good-judgment-project/#easy-footnote-bottom-23-1283 \" “There are several ways to look for individual consistency across questions. We sorted questions on the basis of response format (binary, multinomial, conditional, ordered), region (Eurzone, Latin America, China, etc.), and duration of question (short, medium, and long). We computed accuracy scores for each individual on each variable within each set (e.g., binary, multinomial, conditional, and ordered) and then constructed correlation matrices. For all three question types, correlations were positive… Then we conducted factor analyses. For each question type, a large proportion of the variance was captured by a single factor, consistent with the hypothesis that one underlying dimension was necessary to capture correlations among response formats, regions, and question duration.” From Mellers et al 2015. \")\n\n\nTetlock has ideas for how to handle longer-term, nebulous questions. He calls it “Bayesian Question Clustering.” (*Superforecasting* 263) The idea is to take the question you really want to answer and look for more precise questions that are evidentially relevant to the question you care about. Tetlock intends to test the effectiveness of this idea in future research.\n\n\n \n\n\n### **2.2 Value**\n\n\nThe benefits of following these best practices (including identifying and aggregating the best forecasters) appear to be substantial: Superforecasters predicting events 300 days in the future were more accurate than regular forecasters predicting events 100 days in the future, and the GJP did even better. [24](https://aiimpacts.org/evidence-on-good-forecasting-practices-from-the-good-judgment-project/#easy-footnote-bottom-24-1283 \" Superforecasting p94. Later, in the edge.org seminar, Tetlock says “In some other ROC curves—receiver operator characteristic curves, from signal detection theory—that Mark Steyvers at UCSD constructed—superforecasters could assign probabilities 400 days out about as well as regular people could about eighty days out.” The quote is accompanied by a graph; unfortunately, it’s hard to interpret. \") If these benefits generalize beyond the short-term and beyond geopolitics—e.g. to long-term technological and societal development—then this research is highly useful to almost everyone. Even if the benefits do not generalize beyond the near-term, these best practices may still be well worth adopting. For example, it would be extremely useful to have 300 days of warning before strategically important AI milestones are reached, rather than 100.\n\n\n \n\n\n**3. Contributions**\n--------------------\n\n\n*Research, analysis, and writing were done by Daniel Kokotajlo. Katja Grace and Justis Mills contributed feedback and editing. Tegan McCaslin, Carl Shulman, and Jacob Lagerros contributed feedback.*\n\n\n \n\n\n**4. Footnotes**\n----------------\n\n\n \n\n", "url": "https://aiimpacts.org/evidence-on-good-forecasting-practices-from-the-good-judgment-project/", "title": "Evidence on good forecasting practices from the Good Judgment Project", "source": "aiimpacts.org", "source_type": "wordpress", "date_published": "2019-02-07T22:25:19+00:00", "paged_url": "https://aiimpacts.org/feed?paged=12", "authors": ["Daniel Kokotajlo"], "id": "df83489b7a17881065af145fcb54a83d", "summary": ["This post lists some of the key traits which are associated with successful forecasting, based on work from the Good Judgement Project (who won IARPA's forecasting tournament by a wide margin). The top 5: past performance in the same broad domain; making more predictions on the same question; deliberation time; collaboration on teams; and intelligence. The authors also summarise various other ideas from the Superforecasting book."]}
{"text": "Reinterpreting “AI and Compute”\n\n*This is a guest post by Ben Garfinkel. We revised it slightly, at his request, on February 9, 2019.*\n\n\nA recent OpenAI [blog post](https://blog.openai.com/ai-and-compute/), “AI and Compute,” showed that the amount of computing power consumed by the most computationally intensive machine learning projects has been doubling every three months. The post presents this trend as a reason to better prepare for “systems far outside today’s capabilities.” Greg Brockman, the CTO of OpenAI, has also used the trend to argue for the plausibility of “[near-term AGI](https://www.youtube.com/watch?v=YHCSNsLKHfM).” Overall, it seems pretty common to interpret the OpenAI data as evidence that we should expect extremely capable systems sooner than we otherwise would. \n\n\nHowever, I think it’s important to note that the data can also easily be interpreted in the opposite direction. A more pessimistic interpretation goes like this:\n\n\n1. If we were previously underestimating the rate at which computing power was increasing, this means we were *overestimating* the returns on it.\n2. In addition, if we were previously underestimating the rate at which computing power was increasing, this means that we were *overestimating* how sustainable its growth is.[1](https://aiimpacts.org/reinterpreting-ai-and-compute/#easy-footnote-bottom-1-1250 \"As Ryan Carey has argued, we should expect the trend to run up against physical and financial limitations within the decade.\")\n3. Let’s suppose, as the original post does, that increasing computing power is currently one of the main drivers of progress in creating more capable systems. Then — barring any major changes to the status quo — it seems like we should expect progress to slow down pretty soon and we should expect to be underwhelmed by how far along we are when the slowdown hits.\n\n\nI actually think of this more pessimistic interpretation as something like the *default* one. There are many other scientific fields where R&D spending and other inputs are increasing rapidly, and, so far as I’m aware, these trends are nearly always interpreted as reasons for pessimism and concern about future research progress.[2](https://aiimpacts.org/reinterpreting-ai-and-compute/#easy-footnote-bottom-2-1250 \"See, for example, the pharmaceutical industry’s concern about “Eroom’s Law”: the observation that progress in developing new drugs has been steady despite exponentially growing R&D spending and increasingly powerful drug discovery technologies. The recent paper “Are Ideas Getting Harder to Find?” (Bloom et al., 2018) also includes a pessimistic discussion of several other domains, including agriculture and semiconductor manufacturing.\") If we are going to treat the field of artificial intelligence differently, then we should want clearly articulated and compelling reasons for doing so. \n\n \n\nThese reasons certainly might exist.[3](https://aiimpacts.org/reinterpreting-ai-and-compute/#easy-footnote-bottom-3-1250 \"One way to argue for the bullish interpretation is to draw on work (briefly surveyed in Ryan’s post) that attempts to estimate the minimum quantity of computing power required to produce a system with the same functionality as the human brain. We can then attempt to construct an argument where: (a) we estimate this minimum quantity of computing power (using evidence unrelated to the present rate of return on computing power), (b) predict that the quantity will become available before growth trends hit their wall, and (c) argue that having it available would be nearly sufficient to rapidly train systems that can do a large portion of the things humans can do. In this case, the OpenAI data would be evidence that we should expect the computational “threshold” to be reached slightly earlier than we would otherwise have expected to reach it. For example, it might take only five years to reach the threshold rather than ten. However, my view is that it’s very difficult to construct an argument where parts (a)-(c) are all sufficiently compelling. In any case, it still doesn’t seem like the OpenAI data alone should substantially increase the probability anyone assigns to “near-term AGI” (rather than just shifting forward their conditional probability estimates of how “near-term” “near-term AGI” would be).\") Still, whatever the case may be, I think we should not be too quick to interpret the OpenAI data as evidence for dramatically more capable systems coming soon.[4](https://aiimpacts.org/reinterpreting-ai-and-compute/#easy-footnote-bottom-4-1250 \"As a final complication, it’s useful to keep in mind that the OpenAI data only describes the growth rate for the most well-resourced research projects. If you think about progress in developing more “capable” AI systems (whatever you take “capable” to mean) as mostly a matter of what the single most computationally unconstrained team can do at a given time, then this data is obviously relevant. However, if you instead think that something like the typical amount of computing power available to talented researchers is what’s most important — or if you simply think that looking at the amount of computing power available to various groups can’t tell us much at all — then the OpenAI data seems to imply relatively little about future progress.\")\n\n\n*Thank you to Danny Hernandez and Ryan Carey for comments on a draft of this post.*\n\n", "url": "https://aiimpacts.org/reinterpreting-ai-and-compute/", "title": "Reinterpreting “AI and Compute”", "source": "aiimpacts.org", "source_type": "wordpress", "date_published": "2018-12-18T22:51:50+00:00", "paged_url": "https://aiimpacts.org/feed?paged=12", "authors": ["Justis Mills"], "id": "351a52bab1f590ade873f804d90981b8", "summary": ["[Data](https://blog.openai.com/ai-and-compute/) from OpenAI showed that the amount of compute used by the most expensive projects had been growing exponentially with a doubling time of three months. While it is easy to interpret this trend as suggesting that we will get AGI sooner than expected, it is also possible to interpret this trend as evidence in the opposite direction. A surprisingly high rate of increase in amount of compute used suggests that we have been _overestimating_ how helpful more compute is. Since this trend [can't be sustainable over decades](https://aiimpacts.org/interpreting-ai-compute-trends/), we should expect that progress will slow down, and so this data is evidence _against_ near-term AGI."]}
{"text": "Time for AI to cross the human performance range in diabetic retinopathy\n\nIn diabetic retinopathy, automated systems started out just below expert human level performance, and took around ten years to reach expert human level performance.\n\n\nDetails\n-------\n\n\nDiabetic retinopathy is a complication of diabetes in which the back of the eye is damaged by high blood sugar levels.[1](https://aiimpacts.org/diabetic-retinopathy-as-a-case-study-in-time-for-ai-to-cross-the-range-of-human-performance/#easy-footnote-bottom-1-1241 \" See e.g. https://www.nhs.uk/conditions/diabetic-retinopathy/ \") It is the most common cause of blindness among working-age adults.[2](https://aiimpacts.org/diabetic-retinopathy-as-a-case-study-in-time-for-ai-to-cross-the-range-of-human-performance/#easy-footnote-bottom-2-1241 \"See https://nei.nih.gov/health/diabetic/retinopathy\") The disease is diagnosed by examining images of the back of the eye. The gold standard used for diabetic retinopathy diagnosis is typically some sort of pooling mechanism over several expert opinions. Thus, in the papers below, each time expert sensitivity/specificity (Se/Sp) is considered, it is the Se/Sp of individual experts graded against aggregate expert agreement. \n\n\nAs a rough benchmark for expert-level performance we’ll take the average Se/Sp of ophthalmologists from a few studies. Based on Google Brain’s work (detailed below), this paper [3](https://aiimpacts.org/diabetic-retinopathy-as-a-case-study-in-time-for-ai-to-cross-the-range-of-human-performance/#easy-footnote-bottom-3-1241 \" See Results section before adjudication and consensus https://www.ncbi.nlm.nih.gov/pubmed/23494039 \"), and this paper [4](https://aiimpacts.org/diabetic-retinopathy-as-a-case-study-in-time-for-ai-to-cross-the-range-of-human-performance/#easy-footnote-bottom-4-1241 \" See Figure 3 https://www.ncbi.nlm.nih.gov/pmc/articles/PMC2911785/ \") , the average specificity of 14 opthamologists, which indicates expert human-level performance, is 95% and the average sensitivity is 82%.\n\n\nAs far as we can tell, 1996 is when the first algorithm automatically detecting diabetic retinopathy was developed. When compared to opthamologists’ ratings, the algorithm achieved 88.4% sensitivity and 83.5% specificity. \n\n\nIn late 2016 Google algorithms were on par with eight opthamologist diagnoses of diabetic retinopathy. See Figure 1.[5](https://aiimpacts.org/diabetic-retinopathy-as-a-case-study-in-time-for-ai-to-cross-the-range-of-human-performance/#easy-footnote-bottom-5-1241 \" https://ai.googleblog.com/2016/11/deep-learning-for-detection-of-diabetic.html \") The high-sensitivity operating point (labelled on the graph) achieved 97.5/93.4 Se/Sp. \n\n\n[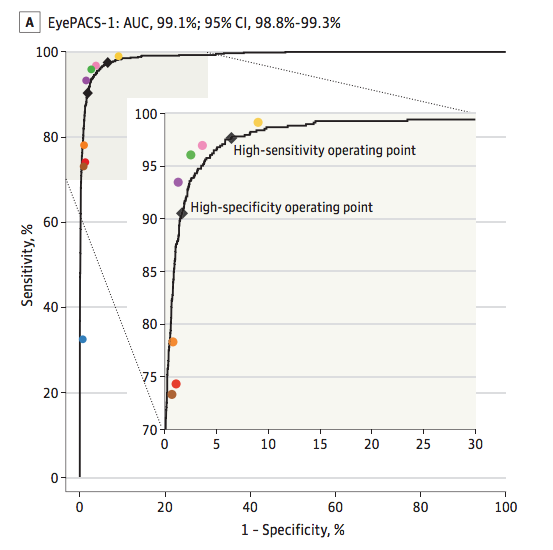](http://aiimpacts.org/wp-content/uploads/2018/11/eyepacs1.png)Figure 1: Performance comparison of a late 2016 Google algorithm, and eight opthalmologists, from here. The black curve represents the algorithm and the eight colored dots are opthamologists.\n\n\nMany other papers were published in between 1996 and 2016. However, none of them achieved better than expert human-level performance on both specificity and sensitivity. For instance 86/77 Se/Sp was achieved in 2007, 97/59 in 2013, and 94/72 by another team in 2016. [6](https://aiimpacts.org/diabetic-retinopathy-as-a-case-study-in-time-for-ai-to-cross-the-range-of-human-performance/#easy-footnote-bottom-6-1241 \" ‘Automated and semi-automated diabetic retinopathy evaluation has been previously studied by other groups. Abràmoff et al4 reported a sensitivity of 96.8% at a specificity of 59.4% for detecting referable diabetic retinopathy on the publicly available Messidor-2 data set.9Solanki et al12 reported a sensitivity of 93.8% at a specificity of 72.2% on the same data set. A study by Philip et al21 reported a sensitivity of 86.2% at a specificity of 76.8% for predicting disease vs no disease on their own data set of 14, 406 images.’ https://jamanetwork.com/journals/jama/fullarticle/2588763 \")\n\n\nThus it took about **ten years** to go from just below expert human level performance to slightly superhuman performance.\n\n\nContributions\n-------------\n\n\n*Aysja Johnson researched and wrote this page. Justis Mills and Katja Grace contributed feedback.*\n\n\nFootnotes\n---------\n\n", "url": "https://aiimpacts.org/diabetic-retinopathy-as-a-case-study-in-time-for-ai-to-cross-the-range-of-human-performance/", "title": "Time for AI to cross the human performance range in diabetic retinopathy", "source": "aiimpacts.org", "source_type": "wordpress", "date_published": "2018-11-21T22:34:37+00:00", "paged_url": "https://aiimpacts.org/feed?paged=12", "authors": ["Aysja Johnson"], "id": "290bbc16d0763b179301f48c5f251da3", "summary": []}
{"text": "AGI-11 survey\n\nThe AGI-11 survey was a survey of 60 participants at the AGI-11 conference. In it:\n\n\n* Nearly half of respondents believed that AGI would appear before 2030.\n* Nearly 90% of respondents believed that AGI would appear before 2100.\n* About 85% of respondents believed that AGI would be beneficial for humankind.\n\n\nDetails\n-------\n\n\nJames Barrat and Ben Goertzel surveyed participants at the [AGI-11](http://agi-conference.org/2011/) conference on [AGI](http://en.wikipedia.org/wiki/Artificial_General_Intelligence) timelines. The survey had two questions, administered over email after the conference. The results were fairly similar to those from the more complex [AGI-09](https://aiimpacts.org/agi-09-survey/) survey, for which Ben Goertzel was also an author.\n\n\nSixty people total responded to the survey, out of [over 200](http://agi-conf.org/2011/2011/08/13/agi-11-a-smashing-success/) conference registrations. Nobody skipped either of the two questions.\n\n\nThe data in this post, and the results tables, are taken from the [write up on this survey](http://hplusmagazine.com/2011/09/16/how-long-till-agi-views-of-agi-11-conference-participants/) in h+ magazine.\n\n\n### Question One\n\n\nQuestion one was: “I believe that AGI (however I define it) will be effectively implemented in the following timeframe:”\n\n\nThe answer choices were:\n\n\n* Before 2030\n* 2030-2049\n* 2050-2099\n* After 2100\n* Never\n\n\nThe results were:\n\n\n\n\n\n### Question Two\n\n\nQuestion two was: “I believe that AGI (however I define it) will be a net positive event for humankind:”\n\n\nThe answer choices were:\n\n\n* True\n* False\n\n\nThe results were:\n\n\n\n\n\n### Comments\n\n\nAs well as the two survey questions, there was also a form where respondents could submit comments. These are recorded in the [h+ magazine](http://hplusmagazine.com/2011/09/16/how-long-till-agi-views-of-agi-11-conference-participants/) write up. Many of the comments expressed concern with the survey structure, suggesting that there could have been more or different options.\n\n\nContributions\n-------------\n\n\n*Justis Mills researched for and wrote this post. Katja Grace provided feedback on style and content. Thanks to James Barrat for linking us to the h+ magazine write up when we reached out to him about his survey.*\n\n", "url": "https://aiimpacts.org/agi-11-survey/", "title": "AGI-11 survey", "source": "aiimpacts.org", "source_type": "wordpress", "date_published": "2018-11-10T23:28:58+00:00", "paged_url": "https://aiimpacts.org/feed?paged=12", "authors": ["Justis Mills"], "id": "b0d4cade3d55f56331302d03ab5fc61e", "summary": ["A survey of participants in the AGI-11 participants (with 60 respondents out of over 200 registrations) found that 43% thought AGI would appear before 2030, 88% thought it would appear before 2100, and 85% believed it would be beneficial for humankind."]}
{"text": "On the (in)applicability of corporate rights cases to digital minds\n\n*This is a guest [cross-post](https://cullenokeefe.com/blog/2018/9/25/on-the-inapplicability-of-corporate-rights-cases-to-digital-minds) by [Cullen O’Keefe,](https://cullenokeefe.com/) 28 September 2018*\n\n\nHigh-Level Takeaway\n-------------------\n\n\nThe extension of rights to corporations likely does *not* provide useful analogy to potential extension of rights to digital minds.\n\n\nIntroduction\n------------\n\n\nExamining how law can protect the welfare of possible future digital minds is part of my research agenda. I expect that study of historical efforts to secure legal protections (“rights”) for previously unprotected classes (e.g., formerly enslaved persons, nonhuman animals, young children) will be crucial to this line of research.\n\n\nI recently read *We the Corporations: How American Businesses Won Their Civil Rights* by [UCLA constitutional law professor Adam Winkler](https://law.ucla.edu/faculty/faculty-profiles/adam-winkler/). The book chronicles how business corporations gradually won various constitutional and statutory civil rights, culminating in the (in)famous recent [*Citizens United*](https://www.oyez.org/cases/2008/08-205) and [*Hobby Lobby*](https://www.oyez.org/cases/2013/13-354) cases.\n\n\nA key insight from Winkler’s book is that, contrary to some popular portrayals of corporate rights cases, these cases usually do *not* rely primarily on corporate personhood: “While the Supreme Court has on occasion said that corporations are people, the justices have more often relied upon a very different conception of the corporation, one that views it as an *association* capable of asserting the rights of its *members*.” *Id.* at xx. The Court, in other words, “pierced the corporate veil” to give corporations rights properly belonging to its members. *See id.* at 54–55.\n\n\nThe Supreme Court’s opinion in *Citizens United* is illustrative. In determining that the First Amendment’s free speech protections applied to corporations, the Court wrote: “[Under the challenged campaign finance statute,] certain disfavored associations of citizens—those that have taken on the corporate form—are penalized for engaging in [otherwise-protected] political speech.” 558 U.S. at 356. The Court held that this was impermissible: the shareholders’ right to free speech imbued the corporation—which it viewed as merely an association of rights-bearing shareholders—with those same rights. *See id.* at 365.\n\n\nEarlier cases that, Winkler argues, exhibit this same pattern include:\n\n\n1. *Bank of U.S. v. Deveaux*, holding that federal jurisdiction over corporations depends on jurisdiction over the individuals comprising the corporation;\n2. *Trustees of Dartmouth Coll. v. Woodward*, holding that corporate charters gave trustees private rights therein, which were protected against state alteration by the Constitution;\n3. *NAACP* v. *Alabama ex rel. Patterson*, holding that non-profit corporation could assert First Amendment rights of its members;\n4. *Bains LLC v. Arco Prod. Co., Div. of Atl. Richfield Co.*, holding that a corporation had standing to bring racial discrimination claim for racial discrimination against its employees.\n\n\nImplications\n------------\n\n\nI believe that this understanding of the corporate civil rights “struggle” has small-but-nontrivial implications for a potential future strategy to secure legal protections for digital minds. Specifically, I think Winkler’s thesis suggests that the extension of rights to corporations is *not* a useful historical or legal analogy for the potential extension of rights to digital minds. This is because Winkler’s book demonstrates that corporations gained rights primarily because their constitutive members (i.e., shareholders) *already had* rights. In the case of digital minds generally, I see no obvious analogy to shareholders: digital minds as such are not mere extensions or associations of entities already bearing rights.\n\n\nMore concretely, this suggests that securing [legal personhood for digital minds](https://www.politico.eu/article/europe-divided-over-robot-ai-artificial-intelligence-personhood/) for instrumental reasons is *not* likely, on its own, to increase the likelihood of legal protections for them.\n\n\nCarrick Flynn suggested to me (and I now agree) that nonhuman animal protections probably provide the best analog for future digital mind protections. To the extent that it rules out another possible method of approaching the question, this post supports that thesis.\n\n\n*This work was financially supported by the Berkeley Existential Risk Initiative.*\n\n", "url": "https://aiimpacts.org/on-the-inapplicability-of-corporate-rights-cases-to-digital-minds/", "title": "On the (in)applicability of corporate rights cases to digital minds", "source": "aiimpacts.org", "source_type": "wordpress", "date_published": "2018-09-28T22:27:26+00:00", "paged_url": "https://aiimpacts.org/feed?paged=12", "authors": ["Katja Grace"], "id": "9c3e69d04b6189e1f76b486a4303d2d4", "summary": []}
{"text": "Hardware overhang\n\n*Hardware overhang* refers to a situation where large quantities of computing hardware can be diverted to running powerful AI systems as soon as the software is developed.\n\n\nDetails\n-------\n\n\n### Definition\n\n\nIn the context of AI forecasting, *hardware overhang* refers to a situation where enough computing hardware to run many powerful AI systems already exists by the time the software to run such systems is developed. If such hardware is repurposed to AI, this would mean that as soon as one powerful AI system exists, probably a large number of them do. This might amplify the impact of the arrival of human-level AI.\n\n\nThe alternative to a hardware overhang is for software sufficient for powerful AI to be developed before the hardware to run it has become cheap. In that case, we might instead expect to see the first powerful AI be built when it is very expensive, and therefore continues to be rare.\n\n", "url": "https://aiimpacts.org/hardware-overhang/", "title": "Hardware overhang", "source": "aiimpacts.org", "source_type": "wordpress", "date_published": "2018-07-16T16:37:30+00:00", "paged_url": "https://aiimpacts.org/feed?paged=13", "authors": ["Katja Grace"], "id": "2f33974c7e3bdc336fd58d06b7461b4a", "summary": []}
{"text": "Historic trends in structure heights\n\nTrends for tallest ever structure heights, tallest ever freestanding structure heights, tallest existing freestanding structure heights, and tallest ever building heights have each seen 5-8 discontinuities of more than ten years. These are:\n\n\n* **Djoser and Meidum pyramids** (~2600BC, >1000 year discontinuities in all structure trends)\n* Three cathedrals that were shorter than the all-time record (**Beauvais** **Cathedral** in 1569, **St Nikolai** in 1874, and **Rouen** **Cathedral** in 1876, all >100 year discontinuities in current freestanding structure trend)\n* **Washington Monument** (1884, >100 year discontinuity in both tallest ever structure trends, but not a notable discontinuity in existing structure trend)\n* **Eiffel Tower** (1889, ~10,000 year discontinuity in both tallest ever structure trends, 54 year discontinuity in existing structure trend)\n* Two early skyscrapers: the **Singer Building** and the **Metropolitan Life Tower** (1908 and 1909, each >300 year discontinuities in building height only)\n* **Empire State Building** (1931, 19 years in all structure trends, 10 years in buildings trend)\n* **KVLY-TV mast** (1963, 20 year discontinuity in tallest ever structure trend)\n* **Taipei 101** (2004, 13 year discontinuity in building height only)\n* **Burj Khalifa** (2009, ~30 year discontinuity in both freestanding structure trends, 90 year discontinuity in building height trend)\n\n\nDetails\n-------\n\n\n### Background\n\n\nOver human history, the tallest man-made structures have included mounds, pyramids, churches, towers, a monument, skyscrapers, and radio and TV masts.\n\n\nHeight records often distinguish between structures and buildings, where a building is ‘regularly inhabited or occupied’ according to Wikipedia, or is ‘designed for residential, business or manufacturing purposes’ and ‘has floors’ according to the Council on Tall Buildings and Urban Habitat.[1](https://aiimpacts.org/discontinuity-from-the-burj-khalifa/#easy-footnote-bottom-1-1178 \"“However, though all of these are structures, some are not buildings in the sense of being regularly inhabited or occupied. It is in this sense of being regularly inhabited or occupied that the term “building” is generally understood to mean when determining what is the world’s tallest building. The non-profit international organization Council on Tall Buildings and Urban Habitat (CTBUH), which maintains a set of criteria for determining the height of tall buildings, defines a “building” as “(A) structure that is designed for residential, business or manufacturing purposes” and “has floors”.” – “History Of The World’s Tallest Buildings”. 2011. En.Wikipedia.Org. Accessed July 3 2019. https://en.wikipedia.org/w/index.php?title=History_of_the_world%27s_tallest_buildings&oldid=903623843\") Figure 1a is an illustration from Wikipedia showing the historic relationship between the heights of buildings and structures.[2](https://aiimpacts.org/discontinuity-from-the-burj-khalifa/#easy-footnote-bottom-2-1178 \"“History Of The World’s Tallest Buildings”. 2011. En.Wikipedia.Org. Accessed July 3 2019. https://en.wikipedia.org/w/index.php?title=History_of_the_world%27s_tallest_buildings&oldid=903623843\")\n[](http://aiimpacts.org/wp-content/uploads/2018/07/History_of_tallest_buildings_chart.jpg)\nFigure 1a: Recent history of tall structures by type.[3](https://aiimpacts.org/discontinuity-from-the-burj-khalifa/#easy-footnote-bottom-3-1178 \"From Wikimedia Commons:Herostratus [CC BY-SA 3.0 (https://creativecommons.org/licenses/by-sa/3.0)]\")\nHeight records also distinguish ‘freestanding’ structures from other structures. According to Wikipedia, “To be freestanding a structure must not be supported by guy wires, the sea or other types of support. It therefore does not include guyed masts, partially guyed towers and drilling platforms but does include towers, skyscrapers (pinnacle height) and chimneys.”[4](https://aiimpacts.org/discontinuity-from-the-burj-khalifa/#easy-footnote-bottom-4-1178 \"“List of Tallest Freestanding Structures.” In Wikipedia, January 22, 2020. https://en.wikipedia.org/w/index.php?title=List_of_tallest_freestanding_structures&oldid=937089557.
)\") So despite these limitations I think we should do our best to imitate these best-practices, and that means using the outside view far more than we would naturally be inclined.\n\n\nOne final thing worth saying is that, remember, the GJP’s aggregated judgments did at least as well as the best superforecasters.[53](https://aiimpacts.org/evidence-on-good-forecasting-practices-from-the-good-judgment-project-an-accompanying-blog-post/#easy-footnote-bottom-53-1260 \" I haven’t found this said explicitly, but I infer this from Doug Lorch, the best superforecaster in Year 2, beating the control group by at least 60% when the GJP beat the control group by 78%. (Superforecasting 93, 18) That said, page 72 seems to say that in Year 2 exactly one person—Doug Lorch—managed to beat the aggregation algorithm. This is almost a contradiction; I’m not sure what to make of it. At any rate, it seems that the aggregation algorithm pretty reliably does better than the superforecasters in general, even if occasionally one of them beats it.\") Presumably at least one of the forecasters in the tournament was using the outside view a lot; after all, half of them were trained in reference-class forecasting. So I think we can conclude that straightforwardly using the outside view as often as possible wouldn’t get you better scores than the GJP, though it might get you close for all we know. Anecdotally, it seems that when the superforecasters use the outside view they often aggregate between different reference-class forecasts.[54](https://aiimpacts.org/evidence-on-good-forecasting-practices-from-the-good-judgment-project-an-accompanying-blog-post/#easy-footnote-bottom-54-1260 \"This is on page 304. Another example on 313.\") The wisdom of the crowds is powerful; this is consistent with the wider literature on the cognitive superiority of groups, and the literature on ensemble methods in AI.[55](https://aiimpacts.org/evidence-on-good-forecasting-practices-from-the-good-judgment-project-an-accompanying-blog-post/#easy-footnote-bottom-55-1260 \"For more on these, see this page.\")\n\n\nTetlock describes how superforecasters go about making their predictions.[56](https://aiimpacts.org/evidence-on-good-forecasting-practices-from-the-good-judgment-project-an-accompanying-blog-post/#easy-footnote-bottom-56-1260 \"This is my summary of Tetlock’s advice in Chapter 5: “Ultimately, it’s not the number crunching power that counts. It’s how you use it. … You’ve Fermi-ized the question, consulted the outside view, and now, finally, you can consult the inside view … So you have an outside view and an inside view. Now they have to be merged. …”\") Here is an attempt at a summary:\n\n\n1. Sometimes a question can be answered more rigorously if it is first “Fermi-ized,” i.e. broken down into sub-questions for which more rigorous methods can be applied.\n2. Next, use the outside view on the sub-questions (and/or the main question, if possible). You may then adjust your estimates using other considerations (‘the inside view’), but do this cautiously.\n3. Seek out other perspectives, both on the sub-questions and on how to Fermi-ize the main question. You can also generate other perspectives yourself.\n4. Repeat steps 1 – 3 until you hit diminishing returns.\n5. Your final prediction should be based on an aggregation of various models, reference classes, other experts, etc.\n\n\n**Footnotes**\n-------------\n\n\n\n", "url": "https://aiimpacts.org/evidence-on-good-forecasting-practices-from-the-good-judgment-project-an-accompanying-blog-post/", "title": "Evidence on good forecasting practices from the Good Judgment Project: an accompanying blog post", "source": "aiimpacts.org", "source_type": "wordpress", "date_published": "2019-02-07T22:25:29+00:00", "paged_url": "https://aiimpacts.org/feed?paged=12", "authors": ["Daniel Kokotajlo"], "id": "bce5d0c3270226ccd88ef8e65cade88a", "summary": []}
{"text": "Evidence on good forecasting practices from the Good Judgment Project\n\nAccording to experience and data from the Good Judgment Project, the following are associated with successful forecasting, in rough decreasing order of combined importance and confidence:\n\n\n* Past performance in the same broad domain\n* Making more predictions on the same question\n* Deliberation time\n* Collaboration on teams\n* Intelligence\n* Domain expertise\n* Having taken a one-hour training module on these topics\n* ‘Cognitive reflection’ test scores\n* ‘Active open-mindedness’\n* Aggregation of individual judgments\n* Use of precise probabilistic predictions\n* Use of ‘the outside view’\n* ‘Fermi-izing’\n* ‘Bayesian reasoning’\n* Practice\n\n\n\n\n**Details**\n-----------\n\n\n### **1. 1. Process**\n\n\nThe Good Judgment Project (GJP) was the winning team in IARPA’s 2011-2015 forecasting tournament. In the tournament, six teams assigned probabilistic answers to hundreds of questions about geopolitical events months to a year in the future. Each competing team used a different method for coming up with their guesses, so the tournament helps us to evaluate different forecasting methods.\n\n\nThe GJP team, led by Philip Tetlock and Barbara Mellers, gathered thousands of online volunteers and had them answer the tournament questions. They then made their official forecasts by aggregating these answers. In the process, the team collected data about the patterns of performance in their volunteers, and experimented with aggregation methods and improvement interventions. For example, they ran an RCT to test the effect of a short training program on forecasting accuracy. They especially focused on identifying and making use of the most successful two percent of forecasters, dubbed ‘superforecasters’.\n\n\nTetlock’s book *Superforecasting* describes this process and Tetlock’s resulting understanding of how to forecast well.\n\n\n \n\n\n### **1.2. Correlates of successful forecasting**\n\n\n#### 1.2.1. Past performance\n\n\nRoughly 70% of the superforecasters maintained their status from one year to the next [1](https://aiimpacts.org/evidence-on-good-forecasting-practices-from-the-good-judgment-project/#easy-footnote-bottom-1-1283 \" Superforecasting p104 \"). Across all the forecasters, the correlation between performance in one year and performance in the next year was 0.65 [2](https://aiimpacts.org/evidence-on-good-forecasting-practices-from-the-good-judgment-project/#easy-footnote-bottom-2-1283 \" Superforecasting p104 \"). These high correlations are particularly impressive because the forecasters were online volunteers; presumably substantial variance year-to-year came from forecasters throttling down their engagement due to fatigue or changing life circumstances [3](https://aiimpacts.org/evidence-on-good-forecasting-practices-from-the-good-judgment-project/#easy-footnote-bottom-3-1283 \" Technically the forecasters were paid, up to $250 per season. (Superforecasting p72) However their payments did not depend on how accurate they were or how much effort they put in, beyond the minimum. \").\n\n\n \n\n\n#### 1.2.2. Behavioral and dispositional variables\n\n\nTable 2 depicts the correlations between measured variables amongst GJP’s volunteers in the first two years of the tournament [4](https://aiimpacts.org/evidence-on-good-forecasting-practices-from-the-good-judgment-project/#easy-footnote-bottom-4-1283 \" The table is from Mellers et al 2015. “Del time” is deliberation time. \"). Each is described in more detail below.\n\n\n[](http://aiimpacts.org/wp-content/uploads/2019/02/image2-1.png)\n\n\nThe first column shows the relationship between each variable and standardized [Brier score](https://en.wikipedia.org/wiki/Brier_score), which is a measure of inaccuracy: higher Brier scores mean less accuracy, so negative correlations are good. “Ravens” is an IQ test; “Del time” is deliberation time, and “teams” is whether or not the forecaster was assigned to a team. “Actively open-minded thinking” is an attempt to measure “the tendency to evaluate arguments and evidence without undue bias from one’s own prior beliefs—and with recognition of the fallibility of one’s judgment.” [5](https://aiimpacts.org/evidence-on-good-forecasting-practices-from-the-good-judgment-project/#easy-footnote-bottom-5-1283 \" “Nonetheless, as we saw in the structural model, and confirm here, the best model uses dispositional, situational, and behavioral variables. The combination produced a multiple correlation of .64.” This is from Mellers et al 2015. \")\n\n\nThe authors conducted various statistical analyses to explore the relationships between these variables. They computed a structural equation model to predict a forecaster’s accuracy:\n\n\n[](http://aiimpacts.org/wp-content/uploads/2019/02/image1-1.png)\n\n\nYellow ovals are latent dispositional variables, yellow rectangles are observed dispositional variables, pink rectangles are experimentally manipulated situational variables, and green rectangles are observed behavioral variables. This model has a [multiple correlation](https://en.wikipedia.org/wiki/Multiple_correlation) of 0.64.[6](https://aiimpacts.org/evidence-on-good-forecasting-practices-from-the-good-judgment-project/#easy-footnote-bottom-6-1283 \" This is from Mellers et al 2015. \")\n\n\nAs these data indicate, domain knowledge, intelligence, active open-mindedness, and working in teams each contribute substantially to accuracy. We can also conclude that effort helps, because deliberation time and number of predictions made per question (“belief updating”) both improved accuracy. Finally, training also helps. This is especially surprising because the training module lasted only an hour and its effects persisted for at least a year. The module included content about probabilistic reasoning, using the outside view, avoiding biases, and more.\n\n\n \n\n\n### **1.3. Aggregation algorithms**\n\n\nGJP made their official predictions by aggregating and extremizing the predictions of their volunteers. The aggregation algorithm was elitist, meaning that it weighted more heavily people who were better on various metrics. [7](https://aiimpacts.org/evidence-on-good-forecasting-practices-from-the-good-judgment-project/#easy-footnote-bottom-7-1283 \" On the webpage, it says forecasters with better track-records and those who update more frequently get weighted more. In these slides, Tetlock describes the elitism differently: He says it gives weight to higher-IQ, more open-minded forecasters. \") The extremizing step pushes the aggregated judgment closer to 1 or 0, to make it more confident. The degree to which they extremize depends on how diverse and sophisticated the pool of forecasters is. [8](https://aiimpacts.org/evidence-on-good-forecasting-practices-from-the-good-judgment-project/#easy-footnote-bottom-8-1283 \" The academic papers on this topic are Satopaa et al 2013 and Baron et al 2014. \") Whether extremizing is a good idea is still controversial. [9](https://aiimpacts.org/evidence-on-good-forecasting-practices-from-the-good-judgment-project/#easy-footnote-bottom-9-1283 \" According to one expert I interviewed, more recent data suggests that the successes of the extremizing algorithm during the forecasting tournament were a fluke. After all, a priori one would expect extremizing to lead to small improvements in accuracy most of the time, but big losses in accuracy some of the time. \") \n\n\nGJP beat all of the other teams. They consistently beat the control group—which was a forecast made by averaging ordinary forecasters—by more than 60%. [10](https://aiimpacts.org/evidence-on-good-forecasting-practices-from-the-good-judgment-project/#easy-footnote-bottom-10-1283 \" Superforecasting p18. \") They also beat a prediction market inside the intelligence community—populated by professional analysts with access to classified information—by 25-30%. [11](https://aiimpacts.org/evidence-on-good-forecasting-practices-from-the-good-judgment-project/#easy-footnote-bottom-11-1283 \" This is from this seminar. \")\n\n\nThat said, individual superforecasters did almost as well, so the elitism of the algorithm may account for a lot of its success.[12](https://aiimpacts.org/evidence-on-good-forecasting-practices-from-the-good-judgment-project/#easy-footnote-bottom-12-1283 \" For example, in year 2 one superforecaster beat the extremizing algorithm. More generally, as discussed in this seminar, the aggregation algorithm produces the greatest improvement with ordinary forecasters; the superforecasters were good enough that it didn’t help much. \")\n\n\n \n\n\n### **1.4. Outside View**\n\n\nThe forecasters who received training were asked to record, for each prediction, which parts of the training they used to make it. Some parts of the training—e.g. “Post-mortem analysis”—were correlated with inaccuracy, but others—most notably “Comparison classes”—were correlated with accuracy. [13](https://aiimpacts.org/evidence-on-good-forecasting-practices-from-the-good-judgment-project/#easy-footnote-bottom-13-1283 \" This is from Chang et al 2016. The average brier score of answers tagged “comparison classes” was 0.17, while the next-best tag averaged 0.26.\") ‘Comparison classes’ is another term for [reference-class forecasting](https://en.wikipedia.org/wiki/Reference_class_forecasting), also known as ‘the outside view’. It is the method of assigning a probability by straightforward extrapolation from similar past situations and their outcomes. \n\n\n \n\n\n### **1.5. Tetlock’s “Portrait of the modal superforecaster”**\n\n\nThis subsection and those that follow will lay out some more qualitative results, things that Tetlock recommends on the basis of his research and interviews with superforecasters. Here is Tetlock’s “portrait of the modal superforecaster:” [14](https://aiimpacts.org/evidence-on-good-forecasting-practices-from-the-good-judgment-project/#easy-footnote-bottom-14-1283 \" Superforecasting p191 \")\n\n\n**Philosophic outlook:**\n\n\n* **Cautious:** Nothing is certain.\n* **Humble:** Reality is infinitely complex.\n* **Nondeterministic:** Whatever happens is not meant to be and does not have to happen.\n\n\n**Abilities & thinking styles:**\n\n\n* **Actively open-minded:** Beliefs are hypotheses to be tested, not treasures to be protected.\n* **Intelligent and knowledgeable, with a “Need for Cognition”:** Intellectually curious, enjoy puzzles and mental challenges.\n* **Reflective:** Introspective and self-critical\n* **Numerate:** Comfortable with numbers\n\n\n**Methods of forecasting:**\n\n\n* **Pragmatic:** Not wedded to any idea or agenda\n* **Analytical:** Capable of stepping back from the tip-of-your-nose perspective and considering other views\n* **Dragonfly-eyed:** Value diverse views and synthesize them into their own\n* **Probabilistic:** Judge using many grades of maybe\n* **Thoughtful updaters:** When facts change, they change their minds\n* **Good intuitive psychologists:** Aware of the value of checking thinking for cognitive and emotional biases [15](https://aiimpacts.org/evidence-on-good-forecasting-practices-from-the-good-judgment-project/#easy-footnote-bottom-15-1283 \" There is experimental evidence that superforecasters are less prone to standard cognitive science biases than ordinary people. From edge.org: Mellers: “We have given them lots of Kahneman and Tversky-like problems to see if they fall prey to the same sorts of biases and errors. The answer is sort of, some of them do, but not as many. It’s not nearly as frequent as you see with the rest of us ordinary mortals. The other thing that’s interesting is they don’t make the kinds of mistakes that regular people make instead of the right answer. They do something that’s a little bit more thoughtful. They integrate base rates with case-specific information a little bit more.” \")\n\n\n**Work ethic:**\n\n\n* **Growth mindset:** Believe it’s possible to get better\n* **Grit:** Determined to keep at it however long it takes\n\n\n \n\n\n### **1.6. Tetlock’s “Ten Commandments for Aspiring Superforecasters:”**\n\n\nThis advice is given at the end of the book, and may make less sense to someone who hasn’t read the book. A full transcript of these commandments can be found [here](https://www.lesswrong.com/posts/dvYeSKDRd68GcrWoe/ten-commandments-for-aspiring-superforecasters); this is a summary:\n\n\n**(1) Triage:** Don’t waste time on questions that are “clocklike” where a rule of thumb can get you pretty close to the correct answer, or “cloudlike” where even fancy models can’t beat a dart-throwing chimp. \n\n\n**(2) Break seemingly intractable problems into tractable sub-problems:** This is how Fermi estimation works. One related piece of advice is “be wary of accidentally substituting an easy question for a hard one,” e.g. substituting “Would Israel be willing to assassinate Yasser Arafat?” for “Will at least one of the tests for polonium in Arafat’s body turn up positive?” \n\n\n**(3) Strike the right balance between inside and outside views:** In particular, *first* anchor with the outside view and *then* adjust using the inside view.\n\n\n**(4) Strike the right balance between under- and overreacting to evidence:** Usually do many small updates, but occasionally do big updates when the situation calls for it. Remember to think about P(E|H)/P(E|~H); remember to avoid the base-rate fallacy. “Superforecasters aren’t perfect Bayesian predictors but they are much better than most of us.” [16](https://aiimpacts.org/evidence-on-good-forecasting-practices-from-the-good-judgment-project/#easy-footnote-bottom-16-1283 \" Superforecasting p281 \")\n\n\n**(5) Look for the clashing causal forces at work in each problem:** This is the “dragonfly eye perspective,” which is where you attempt to do a sort of mental wisdom of the crowds: Have tons of different causal models and aggregate their judgments. Use “Devil’s advocate” reasoning. If you think that P, try hard to convince yourself that not-P. You should find yourself saying “On the one hand… on the other hand… on the third hand…” a lot.\n\n\n**(6) Strive to distinguish as many degrees of doubt as the problem permits but no more.**\n\n\n**(7) Strike the right balance between under- and overconfidence, between prudence and decisiveness.**\n\n\n**(8) Look for the errors behind your mistakes but beware of rearview-mirror hindsight biases.**\n\n\n**(9) Bring out the best in others and let others bring out the best in you.** The book spent a whole chapter on this, using the Wehrmacht as an extended case study on good team organization. One pervasive guiding principle is “Don’t tell people how to do things; tell them what you want accomplished, and they’ll surprise you with their ingenuity in doing it.” The other pervasive guiding principle is “Cultivate a culture in which people—even subordinates—are encouraged to dissent and give counterarguments.” [17](https://aiimpacts.org/evidence-on-good-forecasting-practices-from-the-good-judgment-project/#easy-footnote-bottom-17-1283 \" See e.g. page 284 of Superforecasting, and the entirety of chapter 9. \")\n\n\n**(10) Master the error-balancing bicycle:** This one should have been called practice, practice, practice. Tetlock says that reading the news and generating probabilities isn’t enough; you need to actually score your predictions so that you know how wrong you were.\n\n\n**(11) Don’t treat commandments as commandments:** Tetlock’s point here is simply that you should use your judgment about whether to follow a commandment or not; sometimes they should be overridden.\n\n\n \n\n\n### **1.7. Recipe for Making Predictions**\n\n\nTetlock describes how superforecasters go about making their predictions. [18](https://aiimpacts.org/evidence-on-good-forecasting-practices-from-the-good-judgment-project/#easy-footnote-bottom-18-1283 \" See Chapter 5: “Ultimately, it’s not the number crunching power that counts. It’s how you use it. … You’ve Fermi-ized the question, consulted the outside view, and now, finally, you can consult the inside view … So you have an outside view and an inside view. Now they have to be merged. …” \") Here is an attempt at a summary:\n\n\n1. Sometimes a question can be answered more rigorously if it is first “Fermi-ized,” i.e. broken down into sub-questions for which more rigorous methods can be applied.\n2. Next, use the outside view on the sub-questions (and/or the main question, if possible). You may then adjust your estimates using other considerations (‘the inside view’), but do this cautiously.\n3. Seek out other perspectives, both on the sub-questions and on how to Fermi-ize the main question. You can also generate other perspectives yourself.\n4. Repeat steps 1 – 3 until you hit diminishing returns.\n5. Your final prediction should be based on an aggregation of various models, reference classes, other experts, etc.\n\n\n \n\n\n### **1.8.** **Bayesian reasoning & precise probabilistic forecasts**\n\n\nHumans normally express uncertainty with terms like “maybe” and “almost certainly” and “a significant chance.” Tetlock advocates for thinking and speaking in probabilities instead. He recounts many anecdotes of misunderstandings that might have been avoided this way. For example:\n\n\nIn 1961, when the CIA was planning to topple the Castro government by landing a small army of Cuban expatriates at the Bay of Pigs, President John F. Kennedy turned to the military for an unbiased assessment. The Joint Chiefs of Staff concluded that the plan had a “fair chance” of success. The man who wrote the words “fair chance” later said he had in mind odds of 3 to 1 against success. But Kennedy was never told precisely what “fair chance” meant and, not unreasonably, he took it to be a much more positive assessment. [19](https://aiimpacts.org/evidence-on-good-forecasting-practices-from-the-good-judgment-project/#easy-footnote-bottom-19-1283 \" Superforecasting 44 \")\n\n\nThis example hints at another advantage of probabilistic judgments: It’s harder to weasel out of them afterwards, and therefore easier to keep score. Keeping score is crucial for getting feedback from reality, which is crucial for building up expertise.\n\n\nA standard criticism of using probabilities is that they merely conceal uncertainty rather than quantify it—after all, the numbers you pick are themselves guesses. This may be true for people who haven’t practiced much, but it isn’t true for superforecasters, who are impressively well-calibrated and whose accuracy scores decrease when you round their predictions to the nearest 0.05. (EDIT: This should be 0.1)[20](https://aiimpacts.org/evidence-on-good-forecasting-practices-from-the-good-judgment-project/#easy-footnote-bottom-20-1283 \" The superforecasters had a calibration of 0.01, which means that the average difference between a probability they use and the true frequency of occurrence is 0.01. This is from Mellers et al 2015. The fact about rounding their predictions is from Friedman et al 2018. EDIT: Seems I was wrong, thanks to this commenter for noticing.https://www.metaculus.com/questions/4166/the-lightning-round-tournament-comparing-metaculus-forecasters-to-infectious-disease-experts/#comment-28756\")\n\n\nBayesian reasoning is a natural next step once you are thinking and talking probabilities—it is the theoretical ideal in several important ways [21](https://aiimpacts.org/evidence-on-good-forecasting-practices-from-the-good-judgment-project/#easy-footnote-bottom-21-1283 \" For an excellent introduction to Bayesian reasoning and its theoretical foundations, see Strevens’ textbook-like lecture notes. Some of the facts summarized in this paragraph about Superforecasters and Bayesianism can be found on pages 169-172, 281, and 314 of Superforecasting. \") —and Tetlock’s experience and interviews with superforecasters seems to bear this out. Superforecasters seem to do many small updates, with occasional big updates, just as Bayesianism would predict. They recommend thinking in the Bayesian way, and often explicitly make Bayesian calculations. They are good at breaking down difficult questions into more manageable parts and chaining the probabilities together properly.\n\n\n \n\n\n**2. Discussion: Relevance to AI Forecasting**\n----------------------------------------------\n\n\n### **2.1. Limitations**\n\n\nA major limitation is that the forecasts were mainly on geopolitical events only a few years in the future at most. (Uncertain geopolitical events seem to be somewhat predictable up to two years out but much more difficult to predict five years out.) [22](https://aiimpacts.org/evidence-on-good-forecasting-practices-from-the-good-judgment-project/#easy-footnote-bottom-22-1283 \" Tetlock admits that “there is no evidence that geopolitical or economic forecasters can predict anything ten years out beyond the excruciatingly obvious… These limits on predictability are the predictable results of the butterfly dynamics of nonlinear systems. In my EPJ research, the accuracy of expert predictions declined toward chance five years out.” (Superforecasting p243) \") So evidence from the GJP may not generalize to forecasting other types of events (e.g. technological progress and social consequences) or events further in the future. \n\n\nThat said, the forecasting best practices discovered by this research are not overtly specific to geopolitics or near-term events. Also, geopolitical questions are diverse and accuracy on some was highly correlated with accuracy on others. [23](https://aiimpacts.org/evidence-on-good-forecasting-practices-from-the-good-judgment-project/#easy-footnote-bottom-23-1283 \" “There are several ways to look for individual consistency across questions. We sorted questions on the basis of response format (binary, multinomial, conditional, ordered), region (Eurzone, Latin America, China, etc.), and duration of question (short, medium, and long). We computed accuracy scores for each individual on each variable within each set (e.g., binary, multinomial, conditional, and ordered) and then constructed correlation matrices. For all three question types, correlations were positive… Then we conducted factor analyses. For each question type, a large proportion of the variance was captured by a single factor, consistent with the hypothesis that one underlying dimension was necessary to capture correlations among response formats, regions, and question duration.” From Mellers et al 2015. \")\n\n\nTetlock has ideas for how to handle longer-term, nebulous questions. He calls it “Bayesian Question Clustering.” (*Superforecasting* 263) The idea is to take the question you really want to answer and look for more precise questions that are evidentially relevant to the question you care about. Tetlock intends to test the effectiveness of this idea in future research.\n\n\n \n\n\n### **2.2 Value**\n\n\nThe benefits of following these best practices (including identifying and aggregating the best forecasters) appear to be substantial: Superforecasters predicting events 300 days in the future were more accurate than regular forecasters predicting events 100 days in the future, and the GJP did even better. [24](https://aiimpacts.org/evidence-on-good-forecasting-practices-from-the-good-judgment-project/#easy-footnote-bottom-24-1283 \" Superforecasting p94. Later, in the edge.org seminar, Tetlock says “In some other ROC curves—receiver operator characteristic curves, from signal detection theory—that Mark Steyvers at UCSD constructed—superforecasters could assign probabilities 400 days out about as well as regular people could about eighty days out.” The quote is accompanied by a graph; unfortunately, it’s hard to interpret. \") If these benefits generalize beyond the short-term and beyond geopolitics—e.g. to long-term technological and societal development—then this research is highly useful to almost everyone. Even if the benefits do not generalize beyond the near-term, these best practices may still be well worth adopting. For example, it would be extremely useful to have 300 days of warning before strategically important AI milestones are reached, rather than 100.\n\n\n \n\n\n**3. Contributions**\n--------------------\n\n\n*Research, analysis, and writing were done by Daniel Kokotajlo. Katja Grace and Justis Mills contributed feedback and editing. Tegan McCaslin, Carl Shulman, and Jacob Lagerros contributed feedback.*\n\n\n \n\n\n**4. Footnotes**\n----------------\n\n\n \n\n", "url": "https://aiimpacts.org/evidence-on-good-forecasting-practices-from-the-good-judgment-project/", "title": "Evidence on good forecasting practices from the Good Judgment Project", "source": "aiimpacts.org", "source_type": "wordpress", "date_published": "2019-02-07T22:25:19+00:00", "paged_url": "https://aiimpacts.org/feed?paged=12", "authors": ["Daniel Kokotajlo"], "id": "df83489b7a17881065af145fcb54a83d", "summary": ["This post lists some of the key traits which are associated with successful forecasting, based on work from the Good Judgement Project (who won IARPA's forecasting tournament by a wide margin). The top 5: past performance in the same broad domain; making more predictions on the same question; deliberation time; collaboration on teams; and intelligence. The authors also summarise various other ideas from the Superforecasting book."]}
{"text": "Reinterpreting “AI and Compute”\n\n*This is a guest post by Ben Garfinkel. We revised it slightly, at his request, on February 9, 2019.*\n\n\nA recent OpenAI [blog post](https://blog.openai.com/ai-and-compute/), “AI and Compute,” showed that the amount of computing power consumed by the most computationally intensive machine learning projects has been doubling every three months. The post presents this trend as a reason to better prepare for “systems far outside today’s capabilities.” Greg Brockman, the CTO of OpenAI, has also used the trend to argue for the plausibility of “[near-term AGI](https://www.youtube.com/watch?v=YHCSNsLKHfM).” Overall, it seems pretty common to interpret the OpenAI data as evidence that we should expect extremely capable systems sooner than we otherwise would. \n\n\nHowever, I think it’s important to note that the data can also easily be interpreted in the opposite direction. A more pessimistic interpretation goes like this:\n\n\n1. If we were previously underestimating the rate at which computing power was increasing, this means we were *overestimating* the returns on it.\n2. In addition, if we were previously underestimating the rate at which computing power was increasing, this means that we were *overestimating* how sustainable its growth is.[1](https://aiimpacts.org/reinterpreting-ai-and-compute/#easy-footnote-bottom-1-1250 \"As Ryan Carey has argued, we should expect the trend to run up against physical and financial limitations within the decade.\")\n3. Let’s suppose, as the original post does, that increasing computing power is currently one of the main drivers of progress in creating more capable systems. Then — barring any major changes to the status quo — it seems like we should expect progress to slow down pretty soon and we should expect to be underwhelmed by how far along we are when the slowdown hits.\n\n\nI actually think of this more pessimistic interpretation as something like the *default* one. There are many other scientific fields where R&D spending and other inputs are increasing rapidly, and, so far as I’m aware, these trends are nearly always interpreted as reasons for pessimism and concern about future research progress.[2](https://aiimpacts.org/reinterpreting-ai-and-compute/#easy-footnote-bottom-2-1250 \"See, for example, the pharmaceutical industry’s concern about “Eroom’s Law”: the observation that progress in developing new drugs has been steady despite exponentially growing R&D spending and increasingly powerful drug discovery technologies. The recent paper “Are Ideas Getting Harder to Find?” (Bloom et al., 2018) also includes a pessimistic discussion of several other domains, including agriculture and semiconductor manufacturing.\") If we are going to treat the field of artificial intelligence differently, then we should want clearly articulated and compelling reasons for doing so. \n\n \n\nThese reasons certainly might exist.[3](https://aiimpacts.org/reinterpreting-ai-and-compute/#easy-footnote-bottom-3-1250 \"One way to argue for the bullish interpretation is to draw on work (briefly surveyed in Ryan’s post) that attempts to estimate the minimum quantity of computing power required to produce a system with the same functionality as the human brain. We can then attempt to construct an argument where: (a) we estimate this minimum quantity of computing power (using evidence unrelated to the present rate of return on computing power), (b) predict that the quantity will become available before growth trends hit their wall, and (c) argue that having it available would be nearly sufficient to rapidly train systems that can do a large portion of the things humans can do. In this case, the OpenAI data would be evidence that we should expect the computational “threshold” to be reached slightly earlier than we would otherwise have expected to reach it. For example, it might take only five years to reach the threshold rather than ten. However, my view is that it’s very difficult to construct an argument where parts (a)-(c) are all sufficiently compelling. In any case, it still doesn’t seem like the OpenAI data alone should substantially increase the probability anyone assigns to “near-term AGI” (rather than just shifting forward their conditional probability estimates of how “near-term” “near-term AGI” would be).\") Still, whatever the case may be, I think we should not be too quick to interpret the OpenAI data as evidence for dramatically more capable systems coming soon.[4](https://aiimpacts.org/reinterpreting-ai-and-compute/#easy-footnote-bottom-4-1250 \"As a final complication, it’s useful to keep in mind that the OpenAI data only describes the growth rate for the most well-resourced research projects. If you think about progress in developing more “capable” AI systems (whatever you take “capable” to mean) as mostly a matter of what the single most computationally unconstrained team can do at a given time, then this data is obviously relevant. However, if you instead think that something like the typical amount of computing power available to talented researchers is what’s most important — or if you simply think that looking at the amount of computing power available to various groups can’t tell us much at all — then the OpenAI data seems to imply relatively little about future progress.\")\n\n\n*Thank you to Danny Hernandez and Ryan Carey for comments on a draft of this post.*\n\n", "url": "https://aiimpacts.org/reinterpreting-ai-and-compute/", "title": "Reinterpreting “AI and Compute”", "source": "aiimpacts.org", "source_type": "wordpress", "date_published": "2018-12-18T22:51:50+00:00", "paged_url": "https://aiimpacts.org/feed?paged=12", "authors": ["Justis Mills"], "id": "351a52bab1f590ade873f804d90981b8", "summary": ["[Data](https://blog.openai.com/ai-and-compute/) from OpenAI showed that the amount of compute used by the most expensive projects had been growing exponentially with a doubling time of three months. While it is easy to interpret this trend as suggesting that we will get AGI sooner than expected, it is also possible to interpret this trend as evidence in the opposite direction. A surprisingly high rate of increase in amount of compute used suggests that we have been _overestimating_ how helpful more compute is. Since this trend [can't be sustainable over decades](https://aiimpacts.org/interpreting-ai-compute-trends/), we should expect that progress will slow down, and so this data is evidence _against_ near-term AGI."]}
{"text": "Time for AI to cross the human performance range in diabetic retinopathy\n\nIn diabetic retinopathy, automated systems started out just below expert human level performance, and took around ten years to reach expert human level performance.\n\n\nDetails\n-------\n\n\nDiabetic retinopathy is a complication of diabetes in which the back of the eye is damaged by high blood sugar levels.[1](https://aiimpacts.org/diabetic-retinopathy-as-a-case-study-in-time-for-ai-to-cross-the-range-of-human-performance/#easy-footnote-bottom-1-1241 \" See e.g. https://www.nhs.uk/conditions/diabetic-retinopathy/ \") It is the most common cause of blindness among working-age adults.[2](https://aiimpacts.org/diabetic-retinopathy-as-a-case-study-in-time-for-ai-to-cross-the-range-of-human-performance/#easy-footnote-bottom-2-1241 \"See https://nei.nih.gov/health/diabetic/retinopathy\") The disease is diagnosed by examining images of the back of the eye. The gold standard used for diabetic retinopathy diagnosis is typically some sort of pooling mechanism over several expert opinions. Thus, in the papers below, each time expert sensitivity/specificity (Se/Sp) is considered, it is the Se/Sp of individual experts graded against aggregate expert agreement. \n\n\nAs a rough benchmark for expert-level performance we’ll take the average Se/Sp of ophthalmologists from a few studies. Based on Google Brain’s work (detailed below), this paper [3](https://aiimpacts.org/diabetic-retinopathy-as-a-case-study-in-time-for-ai-to-cross-the-range-of-human-performance/#easy-footnote-bottom-3-1241 \" See Results section before adjudication and consensus https://www.ncbi.nlm.nih.gov/pubmed/23494039 \"), and this paper [4](https://aiimpacts.org/diabetic-retinopathy-as-a-case-study-in-time-for-ai-to-cross-the-range-of-human-performance/#easy-footnote-bottom-4-1241 \" See Figure 3 https://www.ncbi.nlm.nih.gov/pmc/articles/PMC2911785/ \") , the average specificity of 14 opthamologists, which indicates expert human-level performance, is 95% and the average sensitivity is 82%.\n\n\nAs far as we can tell, 1996 is when the first algorithm automatically detecting diabetic retinopathy was developed. When compared to opthamologists’ ratings, the algorithm achieved 88.4% sensitivity and 83.5% specificity. \n\n\nIn late 2016 Google algorithms were on par with eight opthamologist diagnoses of diabetic retinopathy. See Figure 1.[5](https://aiimpacts.org/diabetic-retinopathy-as-a-case-study-in-time-for-ai-to-cross-the-range-of-human-performance/#easy-footnote-bottom-5-1241 \" https://ai.googleblog.com/2016/11/deep-learning-for-detection-of-diabetic.html \") The high-sensitivity operating point (labelled on the graph) achieved 97.5/93.4 Se/Sp. \n\n\n[](http://aiimpacts.org/wp-content/uploads/2018/11/eyepacs1.png)Figure 1: Performance comparison of a late 2016 Google algorithm, and eight opthalmologists, from here. The black curve represents the algorithm and the eight colored dots are opthamologists.\n\n\nMany other papers were published in between 1996 and 2016. However, none of them achieved better than expert human-level performance on both specificity and sensitivity. For instance 86/77 Se/Sp was achieved in 2007, 97/59 in 2013, and 94/72 by another team in 2016. [6](https://aiimpacts.org/diabetic-retinopathy-as-a-case-study-in-time-for-ai-to-cross-the-range-of-human-performance/#easy-footnote-bottom-6-1241 \" ‘Automated and semi-automated diabetic retinopathy evaluation has been previously studied by other groups. Abràmoff et al4 reported a sensitivity of 96.8% at a specificity of 59.4% for detecting referable diabetic retinopathy on the publicly available Messidor-2 data set.9Solanki et al12 reported a sensitivity of 93.8% at a specificity of 72.2% on the same data set. A study by Philip et al21 reported a sensitivity of 86.2% at a specificity of 76.8% for predicting disease vs no disease on their own data set of 14, 406 images.’ https://jamanetwork.com/journals/jama/fullarticle/2588763 \")\n\n\nThus it took about **ten years** to go from just below expert human level performance to slightly superhuman performance.\n\n\nContributions\n-------------\n\n\n*Aysja Johnson researched and wrote this page. Justis Mills and Katja Grace contributed feedback.*\n\n\nFootnotes\n---------\n\n", "url": "https://aiimpacts.org/diabetic-retinopathy-as-a-case-study-in-time-for-ai-to-cross-the-range-of-human-performance/", "title": "Time for AI to cross the human performance range in diabetic retinopathy", "source": "aiimpacts.org", "source_type": "wordpress", "date_published": "2018-11-21T22:34:37+00:00", "paged_url": "https://aiimpacts.org/feed?paged=12", "authors": ["Aysja Johnson"], "id": "290bbc16d0763b179301f48c5f251da3", "summary": []}
{"text": "AGI-11 survey\n\nThe AGI-11 survey was a survey of 60 participants at the AGI-11 conference. In it:\n\n\n* Nearly half of respondents believed that AGI would appear before 2030.\n* Nearly 90% of respondents believed that AGI would appear before 2100.\n* About 85% of respondents believed that AGI would be beneficial for humankind.\n\n\nDetails\n-------\n\n\nJames Barrat and Ben Goertzel surveyed participants at the [AGI-11](http://agi-conference.org/2011/) conference on [AGI](http://en.wikipedia.org/wiki/Artificial_General_Intelligence) timelines. The survey had two questions, administered over email after the conference. The results were fairly similar to those from the more complex [AGI-09](https://aiimpacts.org/agi-09-survey/) survey, for which Ben Goertzel was also an author.\n\n\nSixty people total responded to the survey, out of [over 200](http://agi-conf.org/2011/2011/08/13/agi-11-a-smashing-success/) conference registrations. Nobody skipped either of the two questions.\n\n\nThe data in this post, and the results tables, are taken from the [write up on this survey](http://hplusmagazine.com/2011/09/16/how-long-till-agi-views-of-agi-11-conference-participants/) in h+ magazine.\n\n\n### Question One\n\n\nQuestion one was: “I believe that AGI (however I define it) will be effectively implemented in the following timeframe:”\n\n\nThe answer choices were:\n\n\n* Before 2030\n* 2030-2049\n* 2050-2099\n* After 2100\n* Never\n\n\nThe results were:\n\n\n\n\n\n### Question Two\n\n\nQuestion two was: “I believe that AGI (however I define it) will be a net positive event for humankind:”\n\n\nThe answer choices were:\n\n\n* True\n* False\n\n\nThe results were:\n\n\n\n\n\n### Comments\n\n\nAs well as the two survey questions, there was also a form where respondents could submit comments. These are recorded in the [h+ magazine](http://hplusmagazine.com/2011/09/16/how-long-till-agi-views-of-agi-11-conference-participants/) write up. Many of the comments expressed concern with the survey structure, suggesting that there could have been more or different options.\n\n\nContributions\n-------------\n\n\n*Justis Mills researched for and wrote this post. Katja Grace provided feedback on style and content. Thanks to James Barrat for linking us to the h+ magazine write up when we reached out to him about his survey.*\n\n", "url": "https://aiimpacts.org/agi-11-survey/", "title": "AGI-11 survey", "source": "aiimpacts.org", "source_type": "wordpress", "date_published": "2018-11-10T23:28:58+00:00", "paged_url": "https://aiimpacts.org/feed?paged=12", "authors": ["Justis Mills"], "id": "b0d4cade3d55f56331302d03ab5fc61e", "summary": ["A survey of participants in the AGI-11 participants (with 60 respondents out of over 200 registrations) found that 43% thought AGI would appear before 2030, 88% thought it would appear before 2100, and 85% believed it would be beneficial for humankind."]}
{"text": "On the (in)applicability of corporate rights cases to digital minds\n\n*This is a guest [cross-post](https://cullenokeefe.com/blog/2018/9/25/on-the-inapplicability-of-corporate-rights-cases-to-digital-minds) by [Cullen O’Keefe,](https://cullenokeefe.com/) 28 September 2018*\n\n\nHigh-Level Takeaway\n-------------------\n\n\nThe extension of rights to corporations likely does *not* provide useful analogy to potential extension of rights to digital minds.\n\n\nIntroduction\n------------\n\n\nExamining how law can protect the welfare of possible future digital minds is part of my research agenda. I expect that study of historical efforts to secure legal protections (“rights”) for previously unprotected classes (e.g., formerly enslaved persons, nonhuman animals, young children) will be crucial to this line of research.\n\n\nI recently read *We the Corporations: How American Businesses Won Their Civil Rights* by [UCLA constitutional law professor Adam Winkler](https://law.ucla.edu/faculty/faculty-profiles/adam-winkler/). The book chronicles how business corporations gradually won various constitutional and statutory civil rights, culminating in the (in)famous recent [*Citizens United*](https://www.oyez.org/cases/2008/08-205) and [*Hobby Lobby*](https://www.oyez.org/cases/2013/13-354) cases.\n\n\nA key insight from Winkler’s book is that, contrary to some popular portrayals of corporate rights cases, these cases usually do *not* rely primarily on corporate personhood: “While the Supreme Court has on occasion said that corporations are people, the justices have more often relied upon a very different conception of the corporation, one that views it as an *association* capable of asserting the rights of its *members*.” *Id.* at xx. The Court, in other words, “pierced the corporate veil” to give corporations rights properly belonging to its members. *See id.* at 54–55.\n\n\nThe Supreme Court’s opinion in *Citizens United* is illustrative. In determining that the First Amendment’s free speech protections applied to corporations, the Court wrote: “[Under the challenged campaign finance statute,] certain disfavored associations of citizens—those that have taken on the corporate form—are penalized for engaging in [otherwise-protected] political speech.” 558 U.S. at 356. The Court held that this was impermissible: the shareholders’ right to free speech imbued the corporation—which it viewed as merely an association of rights-bearing shareholders—with those same rights. *See id.* at 365.\n\n\nEarlier cases that, Winkler argues, exhibit this same pattern include:\n\n\n1. *Bank of U.S. v. Deveaux*, holding that federal jurisdiction over corporations depends on jurisdiction over the individuals comprising the corporation;\n2. *Trustees of Dartmouth Coll. v. Woodward*, holding that corporate charters gave trustees private rights therein, which were protected against state alteration by the Constitution;\n3. *NAACP* v. *Alabama ex rel. Patterson*, holding that non-profit corporation could assert First Amendment rights of its members;\n4. *Bains LLC v. Arco Prod. Co., Div. of Atl. Richfield Co.*, holding that a corporation had standing to bring racial discrimination claim for racial discrimination against its employees.\n\n\nImplications\n------------\n\n\nI believe that this understanding of the corporate civil rights “struggle” has small-but-nontrivial implications for a potential future strategy to secure legal protections for digital minds. Specifically, I think Winkler’s thesis suggests that the extension of rights to corporations is *not* a useful historical or legal analogy for the potential extension of rights to digital minds. This is because Winkler’s book demonstrates that corporations gained rights primarily because their constitutive members (i.e., shareholders) *already had* rights. In the case of digital minds generally, I see no obvious analogy to shareholders: digital minds as such are not mere extensions or associations of entities already bearing rights.\n\n\nMore concretely, this suggests that securing [legal personhood for digital minds](https://www.politico.eu/article/europe-divided-over-robot-ai-artificial-intelligence-personhood/) for instrumental reasons is *not* likely, on its own, to increase the likelihood of legal protections for them.\n\n\nCarrick Flynn suggested to me (and I now agree) that nonhuman animal protections probably provide the best analog for future digital mind protections. To the extent that it rules out another possible method of approaching the question, this post supports that thesis.\n\n\n*This work was financially supported by the Berkeley Existential Risk Initiative.*\n\n", "url": "https://aiimpacts.org/on-the-inapplicability-of-corporate-rights-cases-to-digital-minds/", "title": "On the (in)applicability of corporate rights cases to digital minds", "source": "aiimpacts.org", "source_type": "wordpress", "date_published": "2018-09-28T22:27:26+00:00", "paged_url": "https://aiimpacts.org/feed?paged=12", "authors": ["Katja Grace"], "id": "9c3e69d04b6189e1f76b486a4303d2d4", "summary": []}
{"text": "Hardware overhang\n\n*Hardware overhang* refers to a situation where large quantities of computing hardware can be diverted to running powerful AI systems as soon as the software is developed.\n\n\nDetails\n-------\n\n\n### Definition\n\n\nIn the context of AI forecasting, *hardware overhang* refers to a situation where enough computing hardware to run many powerful AI systems already exists by the time the software to run such systems is developed. If such hardware is repurposed to AI, this would mean that as soon as one powerful AI system exists, probably a large number of them do. This might amplify the impact of the arrival of human-level AI.\n\n\nThe alternative to a hardware overhang is for software sufficient for powerful AI to be developed before the hardware to run it has become cheap. In that case, we might instead expect to see the first powerful AI be built when it is very expensive, and therefore continues to be rare.\n\n", "url": "https://aiimpacts.org/hardware-overhang/", "title": "Hardware overhang", "source": "aiimpacts.org", "source_type": "wordpress", "date_published": "2018-07-16T16:37:30+00:00", "paged_url": "https://aiimpacts.org/feed?paged=13", "authors": ["Katja Grace"], "id": "2f33974c7e3bdc336fd58d06b7461b4a", "summary": []}
{"text": "Historic trends in structure heights\n\nTrends for tallest ever structure heights, tallest ever freestanding structure heights, tallest existing freestanding structure heights, and tallest ever building heights have each seen 5-8 discontinuities of more than ten years. These are:\n\n\n* **Djoser and Meidum pyramids** (~2600BC, >1000 year discontinuities in all structure trends)\n* Three cathedrals that were shorter than the all-time record (**Beauvais** **Cathedral** in 1569, **St Nikolai** in 1874, and **Rouen** **Cathedral** in 1876, all >100 year discontinuities in current freestanding structure trend)\n* **Washington Monument** (1884, >100 year discontinuity in both tallest ever structure trends, but not a notable discontinuity in existing structure trend)\n* **Eiffel Tower** (1889, ~10,000 year discontinuity in both tallest ever structure trends, 54 year discontinuity in existing structure trend)\n* Two early skyscrapers: the **Singer Building** and the **Metropolitan Life Tower** (1908 and 1909, each >300 year discontinuities in building height only)\n* **Empire State Building** (1931, 19 years in all structure trends, 10 years in buildings trend)\n* **KVLY-TV mast** (1963, 20 year discontinuity in tallest ever structure trend)\n* **Taipei 101** (2004, 13 year discontinuity in building height only)\n* **Burj Khalifa** (2009, ~30 year discontinuity in both freestanding structure trends, 90 year discontinuity in building height trend)\n\n\nDetails\n-------\n\n\n### Background\n\n\nOver human history, the tallest man-made structures have included mounds, pyramids, churches, towers, a monument, skyscrapers, and radio and TV masts.\n\n\nHeight records often distinguish between structures and buildings, where a building is ‘regularly inhabited or occupied’ according to Wikipedia, or is ‘designed for residential, business or manufacturing purposes’ and ‘has floors’ according to the Council on Tall Buildings and Urban Habitat.[1](https://aiimpacts.org/discontinuity-from-the-burj-khalifa/#easy-footnote-bottom-1-1178 \"“However, though all of these are structures, some are not buildings in the sense of being regularly inhabited or occupied. It is in this sense of being regularly inhabited or occupied that the term “building” is generally understood to mean when determining what is the world’s tallest building. The non-profit international organization Council on Tall Buildings and Urban Habitat (CTBUH), which maintains a set of criteria for determining the height of tall buildings, defines a “building” as “(A) structure that is designed for residential, business or manufacturing purposes” and “has floors”.” – “History Of The World’s Tallest Buildings”. 2011. En.Wikipedia.Org. Accessed July 3 2019. https://en.wikipedia.org/w/index.php?title=History_of_the_world%27s_tallest_buildings&oldid=903623843\") Figure 1a is an illustration from Wikipedia showing the historic relationship between the heights of buildings and structures.[2](https://aiimpacts.org/discontinuity-from-the-burj-khalifa/#easy-footnote-bottom-2-1178 \"“History Of The World’s Tallest Buildings”. 2011. En.Wikipedia.Org. Accessed July 3 2019. https://en.wikipedia.org/w/index.php?title=History_of_the_world%27s_tallest_buildings&oldid=903623843\")\n[](http://aiimpacts.org/wp-content/uploads/2018/07/History_of_tallest_buildings_chart.jpg)\nFigure 1a: Recent history of tall structures by type.[3](https://aiimpacts.org/discontinuity-from-the-burj-khalifa/#easy-footnote-bottom-3-1178 \"From Wikimedia Commons:Herostratus [CC BY-SA 3.0 (https://creativecommons.org/licenses/by-sa/3.0)]\")\nHeight records also distinguish ‘freestanding’ structures from other structures. According to Wikipedia, “To be freestanding a structure must not be supported by guy wires, the sea or other types of support. It therefore does not include guyed masts, partially guyed towers and drilling platforms but does include towers, skyscrapers (pinnacle height) and chimneys.”[4](https://aiimpacts.org/discontinuity-from-the-burj-khalifa/#easy-footnote-bottom-4-1178 \"“List of Tallest Freestanding Structures.” In Wikipedia, January 22, 2020. https://en.wikipedia.org/w/index.php?title=List_of_tallest_freestanding_structures&oldid=937089557.
\") Definitions vary, for instance Guinness World Records apparently treats underwater structures as ‘freestanding’.[5](https://aiimpacts.org/discontinuity-from-the-burj-khalifa/#easy-footnote-bottom-5-1178 \"“The Petronius Platform stands 610 m (2,000 ft) off the sea floor leading some, including Guinness World Records 2007, to claim it as the tallest freestanding structure in the world. However, it is debated whether underwater height should be counted, in the same manner as height below ground is ignored on buildings.”
“List of Tallest Buildings and Structures.” In Wikipedia, February 2, 2020. https://en.wikipedia.org/w/index.php?title=List_of_tallest_buildings_and_structures&oldid=938797794.\") We ignore underwater height in general, excluding underwater structures from ‘freestanding’ records and and ‘all structures’ records. \n \nThe heights of buildings in particular are commonly measured in terms of ‘architectural height’ or ‘height to tip’, which both start at the lowest, significant, open-air, pedestrian entrance, but differ in that ‘to tip’ includes ‘functional-technical equipment’ like antennae, signage or flag poles, while architectural height does not[6](https://aiimpacts.org/discontinuity-from-the-burj-khalifa/#easy-footnote-bottom-6-1178 \"Definitions from CTBUH’s Skyscraper Center:
Height: Architectural Height is measured from the level of the lowest, significant, open-air, pedestrian entrance to the architectural top of the building, including spires, but not including antennae, signage, flag poles or other functional-technical equipment. This measurement is the most widely utilized and is employed to define the Council on Tall Buildings and Urban Habitat (CTBUH) rankings of the “World’s Tallest Buildings.”
Height: To Tip Height is measured from the level of the lowest, significant, open-air, pedestrian entrance to the highest point of the building, irrespective of material or function of the highest element (i.e., including antennae, flagpoles, signage and other functional-technical equipment).
“The Skyscraper Center.” Accessed February 3, 2020. https://www.skyscrapercenter.com/definitions/Building. \") Our understanding is that ‘pinnacle height’ is the same as ‘height to tip’. There are also several less common measures in use.\n\n\nHeight records must also distinguish between the tallest structure standing at a given time, and the tallest structure to have ever existed, at that time. The tallest building or structure at a particular time is sometimes not the tallest ever, when the tallest is damaged without anything taller being built. For instance, the tallest structures in the 1700s were shorter than earlier records, because those were church spires which became damaged without replacement (see Figure 1b).\n\n\n[](http://aiimpacts.org/wp-content/uploads/2018/07/Wikipedia-structure-heights.png)\nFigure 1b: An illustration of structure heights over time by location from Wikipedia. [7](https://aiimpacts.org/discontinuity-from-the-burj-khalifa/#easy-footnote-bottom-7-1178 \"“History of the World’s Tallest Buildings,” in Wikipedia, July 19, 2019, https://en.wikipedia.org/w/index.php?title=History_of_the_world%27s_tallest_buildings&oldid=906924179.\") (Click to enlarge)\n\n\n### Trends\n\n\nWe collected data for several combinations of measurement possibilities mentioned:\n\n\n* Tallest ever structures on land (i.e. freestanding or not, but not underwater), measured to tip\n* Tallest ever *freestanding* structures, measured to tip\n* Tallest *existing* freestanding structures, measured to tip\n* Tallest ever *buildings*, measured to architectural height\n\n\n#### Tallest ever structure heights\n\n\n##### Data\n\n\nWe collected height records from numerous Wikipedia lists of tall buildings and structures.[8](https://aiimpacts.org/discontinuity-from-the-burj-khalifa/#easy-footnote-bottom-8-1178 \"For instance, https://en.wikipedia.org/wiki/List_of_tallest_structures_built_before_the_20th_century, https://en.wikipedia.orug/wiki/List_of_tallest_buildings_and_structures#Tallest_freestanding_structures_on_land, https://en.wikipedia.org/wiki/List_of_tallest_freestanding_structures#Timeline_of_world’s_tallest_freestanding_structures, https://en.wikipedia.org/wiki/History_of_the_world%27s_tallest_buildings\") We have not extensively verified these sources, though we made minor adjustments and additions from elsewhere online where sources were inconsistent or records incomplete. Our data is in [this spreadsheet](https://docs.google.com/spreadsheets/d/1cnvlMpQsLye0Z0m98vMXN7k4nryxvoN3L1_aH9xho4I/edit?usp=sharing), sheet ‘Structures collection’. Figure 2 shows this data.\n\n\n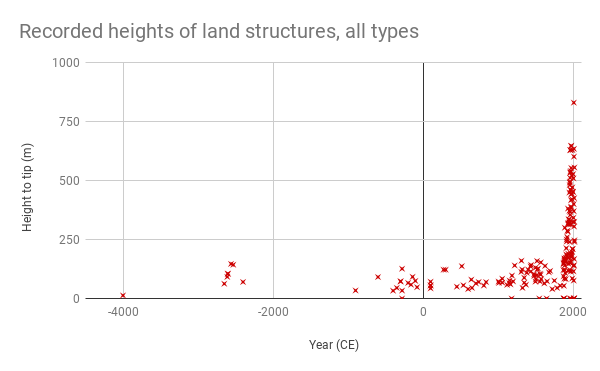Figure 2: Our collection of height records for man-made above ground structures, from a variety of online sources (excluding two earlier records). Note that some records are repeated in slightly different versions or are for the same structure being extended, or becoming a record again after the destruction of another structure. The collection is constructed to contain the tallest structures, but the subset of non-tallest structures included is arbitrary.\nWe constructed a timeline of tallest ever structures by pinnacle height from the tallest ever records in this dataset (see sheet ‘Structures (all time, pinnacle)’ in [the spreadsheet](https://docs.google.com/spreadsheets/d/1cnvlMpQsLye0Z0m98vMXN7k4nryxvoN3L1_aH9xho4I/edit?usp=sharing)). This is shown in figures 3a and 3b below.\n\n\n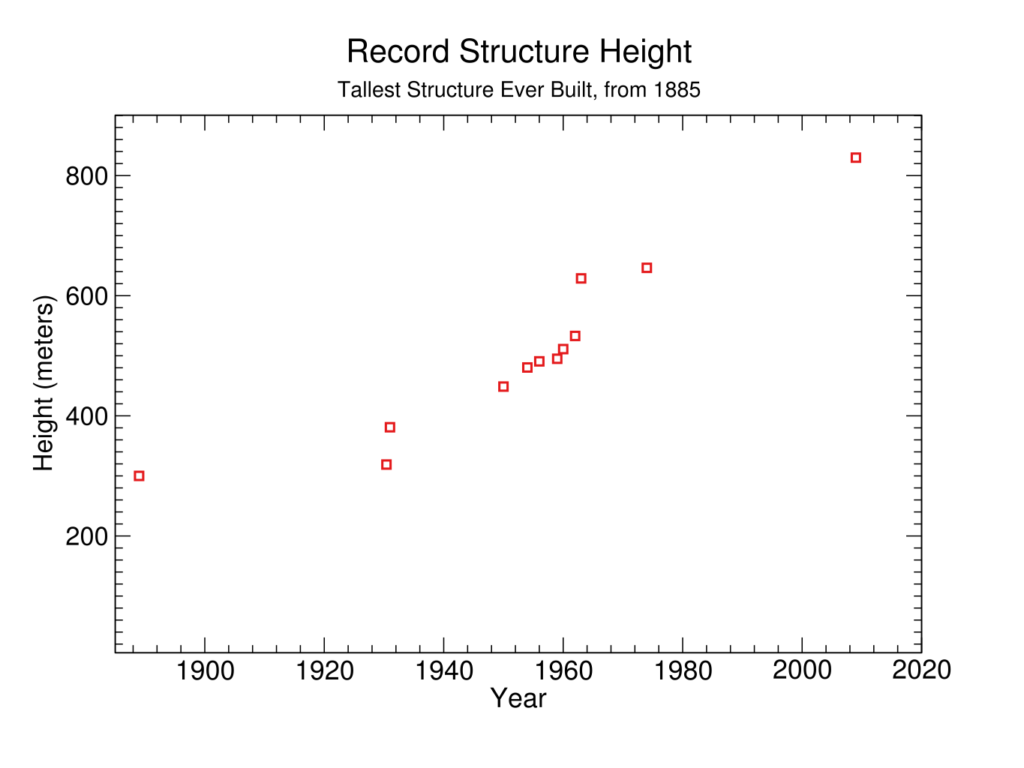**Figure 3a:** Recent history of tallest structures ever built on land (not necessarily freestanding). The record may be taller than any structure standing at a given time.\n**Figure 3b:** Longer term history of tallest structures ever built on land (not necessarily freestanding), on a log scale. The record may be taller than any structure standing at a given time.\n##### \n\n\n##### Discontinuity measurement\n\n\nWe treat this data as exponential initially followed by three linear trends. Using these trends as the previous rate to compare to, we calculated for each record how many years ahead of the trend it was.[9](https://aiimpacts.org/discontinuity-from-the-burj-khalifa/#easy-footnote-bottom-9-1178 \"See our methodology page for details on how we choose what to treat as the ‘previous trend’ at a given point, and how we calculate discontinuities. See our spreadsheet, sheet ‘Structures (all time, pinnacle)’ for the division of our data into different trends and the discontinuity calculations.\") The series contained six unambiguous greater-than-ten-year discontinuities, shown in Table 1 below.\n\n\nThe Bent Pyramid appears to represent a 12 year discontinuity, but we ignore this because its date of construction seems uncertain relative to the small discontinuity.[10](https://aiimpacts.org/discontinuity-from-the-burj-khalifa/#easy-footnote-bottom-10-1178 \"The pyramid is around 4600 years old, and for instance, the source we used had 2605 BC as its record date, whereas the pyramid’s own Wikipedia page gives ‘c 2600 BC’ as its date of construction.
\n\n\n\n“Bent Pyramid.” In Wikipedia, December 12, 2019. https://en.wikipedia.org/w/index.php?title=Bent_Pyramid&oldid=930419772. \")\nWhile our early records are presumably incomplete, we do not avoid measuring early discontinuities for this reason, because the large discontinuities that we find before the 19th Century seem unlikely to depend substantially on the exact set of earlier records.\n\n\n**Table 1:** discontinuities in tallest ever structure heights\n\n\n\n\n| | | | |\n| --- | --- | --- | --- |\n| **Year** | **Height (m)** | **Discontinuity (years)** | **Structure** |\n| 2650 BC | 62.5 | ~9000 | Pyramid of Djoser |\n| 2610 BC | 91.65 | ~1000 | Meidum Pyramid |\n| 1884 | 169.3 | 106 | Washington Monument |\n| 1889 | 300 | ~10,000 | Eiffel Tower |\n| 1931 | 381 | 19 | Empire State Building |\n| 1963 | 628.8 | 20 | KVLY-TV mast |\n\n\nA number of other potentially relevant metrics are tabulated [here](https://docs.google.com/spreadsheets/d/1iMIZ57Ka9-ZYednnGeonC-NqwGC7dKiHN9S-TAxfVdQ/edit?usp=sharing).\n\n\n#### Tallest ever freestanding structure heights\n\n\n##### Data\n\n\nThis data is another subset of the ‘structures collection’ described above, this time including only records for ‘freestanding’ structures. This excludes structures supported by guy ropes, such as radio masts. Guyed masts were the tallest structures on land overall between 1954 and 2008, so this dataset differs from the ‘tallest ever structure heights’ dataset above between those years.\n\n\nThis dataset can be found in [this spreadsheet](https://docs.google.com/spreadsheets/d/1cnvlMpQsLye0Z0m98vMXN7k4nryxvoN3L1_aH9xho4I/edit?usp=sharing), sheet ‘Freestanding structures (all time, pinnacle)’. Figures 4-5 below illustrate it.\n\n\nFigure 4: Recent history of tallest freestanding structures ever built.\nFigure 5: Longer term history of tallest freestanding structures ever built, on a log scale.\n##### Discontinuity measurement\n\n\nWe treat this data as exponential initially followed by three linear trends. Using these trends as the previous rate to compare to, we calculated for each record how many years ahead of the trend it was.[11](https://aiimpacts.org/discontinuity-from-the-burj-khalifa/#easy-footnote-bottom-11-1178 \"See our methodology page for details on how we choose what to treat as the ‘previous trend’ at a given point, and how we calculate discontinuities. See our spreadsheet, sheet ‘Freestanding structures (all time, pinnacle)‘ for the division of our data into different trends and the discontinuity calculations.\") The series contained six unambiguous greater-than-ten-year discontinuities. The first five are the same as those in the previous dataset, since the series do not diverge until later (see *Tallest ever structure heights* section above for further details). The last discontinuity is a 32 year jump in 2009 from the Burj Khalifa.\n\n\nWe tabulated a number of other potentially relevant metrics [here](https://docs.google.com/spreadsheets/d/1iMIZ57Ka9-ZYednnGeonC-NqwGC7dKiHN9S-TAxfVdQ/edit?usp=sharing).\n\n\n#### Tallest existing freestanding structure heights\n\n\nWe constructed a dataset of tallest freestanding structures over time largely from Wikipedia’s Timeline of world’s tallest freestanding structures[12](https://aiimpacts.org/discontinuity-from-the-burj-khalifa/#easy-footnote-bottom-12-1178 \" “List of Tallest Freestanding Structures.” In Wikipedia, January 22, 2020. https://en.wikipedia.org/w/index.php?title=List_of_tallest_freestanding_structures&oldid=937089557. \"), with some modifications. This is available in [our spreadsheet](https://docs.google.com/spreadsheets/d/1cnvlMpQsLye0Z0m98vMXN7k4nryxvoN3L1_aH9xho4I/edit?usp=sharing), sheet ‘Freestanding structures (current, pinnacle)’, and is shown in Figures 6-7 below.\n\n\n**Figure 6:** Recent history of tallest freestanding structures standing. New records are sometimes shorter than old records.\nFigure 7: Longer term history of tallest freestanding structures standing, on a log scale. New records are sometimes shorter than old records.\n##### Discontinuity measurement\n\n\nWe treat this data as exponential initially, followed by four linear trends. Using these trends as the ‘previous rate’ to compare to,[13](https://aiimpacts.org/discontinuity-from-the-burj-khalifa/#easy-footnote-bottom-13-1178 \"See our methodology page for details on how we choose what to treat as the ‘previous trend’ at a given point. See our spreadsheet, sheet ‘Freestanding structures (current, pinnacle)’ for the trends.\") the data contained eight unambiguous greater than ten year discontinuities, shown in Table 2 below.[14](https://aiimpacts.org/discontinuity-from-the-burj-khalifa/#easy-footnote-bottom-14-1178 \"We again ignore the Bent Pyramid, because the apparent discontinuity is small relative to uncertainty about its date of construction. See our methodology page for explanation of how we calculated discontinuities. Also see our spreadsheet, sheet ‘Freestanding structures (current, pinnacle)’ for these calculations.\")\nThis series differs from that of all-time tallest freestanding structures above by the insertion of a series of records between Lincoln Cathedral in 1311 and the Washington Monument in 1889. This change made the Washington Monument unexceptional rather than a 100 year discontinuity, and the Eiffel Tower a fifty-year discontinuity rather than a ten-thousand year one. Later discontinuities from the Empire State Building and Burj Khalifa are very similar.\n\n\nTable 2: discontinuities in tallest existing freestanding structures\n\n\n\n\n| | | | |\n| --- | --- | --- | --- |\n| **Year** | **Height (m)** | **Discontinuity (years)** | **Structure** |\n| 2650 BC | 62.5 | ~9000 | Pyramid of Djoser |\n| 2610 BC | 91.65 | ~1000 | Meidum Pyramid |\n| 1569 | 153 | 138 | Beauvais Cathedral |\n| 1874 | 147.3 | 224 | St Nikolai |\n| 1876 | 151 | 307 | Rouen Cathedral |\n| 1889 | 300 | 54 | Eiffel Tower |\n| 1931 | 381 | 19 | Empire State Building |\n| 2009 | 829.8 | 35 | Burj Khalifa |\n\n\nWe have tabulated a number of other potentially relevant metrics [here](https://docs.google.com/spreadsheets/d/1iMIZ57Ka9-ZYednnGeonC-NqwGC7dKiHN9S-TAxfVdQ/edit?usp=sharing).[15](https://aiimpacts.org/discontinuity-from-the-burj-khalifa/#easy-footnote-bottom-15-1178 \"See our our methodology page for more details.\")\n#### Tallest ever building heights\n\n\n##### Data\n\n\nWe collected data on the tallest ever buildings from Wikipedia’s *History of the world’s tallest buildings*,[16](https://aiimpacts.org/discontinuity-from-the-burj-khalifa/#easy-footnote-bottom-16-1178 \"“History Of The World’s Tallest Buildings”. 2011. En.Wikipedia.Org. Accessed May 26 2019. https://en.wikipedia.org/wiki/History_of_the_world%27s_tallest_buildings.\") and added it to [this spreadsheet](https://docs.google.com/spreadsheets/d/1cnvlMpQsLye0Z0m98vMXN7k4nryxvoN3L1_aH9xho4I/edit?usp=sharing) (sheet ‘Buildings (all time, architectural)’). We have not thoroughly verified it, but have made minor modifications (noted in the spreadsheet). Figure 8 shows this data.\n\n\nFigure 8: Height of tallest buildings ever built, measured using ‘architectural height’, which excludes some additions such as antennae.\nFigure 9: Close up of Figure 8\n##### Discontinuity measurement\n\n\nWe treated this data as an exponential trend followed by a linear trend.[17](https://aiimpacts.org/discontinuity-from-the-burj-khalifa/#easy-footnote-bottom-17-1178 \"See our methodology page for details on how we decide what to treat as the past trend for each point.\") Compared to previous rates within these trends, tallest buildings over time contained five greater than ten year discontinuities, shown in Table 3 below.[18](https://aiimpacts.org/discontinuity-from-the-burj-khalifa/#easy-footnote-bottom-18-1178 \"See our methodology page for explanation of how we calculated these numbers. See our spreadsheet, sheet ‘Buildings (all time, architectural)’ for these calculations.\")\n**Table 3:** discontinuities in tallest ever building heights\n\n\n\n\n| | | | |\n| --- | --- | --- | --- |\n| **Year** | **Height (m)** | **Discontinuity (years)** | **Building** |\n| 1908 | 186.57 | 383 | Singer Building |\n| 1909 | 213.36 | 320 | [Metropolitan Life Tower](https://en.wikipedia.org/wiki/Metropolitan_Life_Insurance_Company_Tower) |\n| 1931 | 381 | 10 | [Empire State Building](https://en.wikipedia.org/wiki/Empire_State_Building) |\n| 2004 | 509.2 | 13 | [Taipei 101](https://en.wikipedia.org/wiki/Taipei_101) |\n| 2010 | 828 | 90 | [Burj Khalifa](https://en.wikipedia.org/wiki/Burj_Khalifa) |\n\n\nWe have tabulated a number of other potentially relevant metrics [here](https://docs.google.com/spreadsheets/d/1iMIZ57Ka9-ZYednnGeonC-NqwGC7dKiHN9S-TAxfVdQ/edit?usp=sharing).[19](https://aiimpacts.org/discontinuity-from-the-burj-khalifa/#easy-footnote-bottom-19-1178 \"See our methodology page for more details.\")\nFigure 10: Burj Khalifa, current record holder for every listed metric, and discontinuously tall freestanding structure and building.\nNotes\n-----\n\n\n\n\n\n\n\n\n\n\n\n\n\n\n\n", "url": "https://aiimpacts.org/discontinuity-from-the-burj-khalifa/", "title": "Historic trends in structure heights", "source": "aiimpacts.org", "source_type": "wordpress", "date_published": "2018-07-12T17:15:02+00:00", "paged_url": "https://aiimpacts.org/feed?paged=13", "authors": ["Katja Grace"], "id": "6b180fb53ced41926822ea04a1920494", "summary": []} {"text": "Interpreting AI compute trends\n\n*This is a guest post by Ryan Carey, 10 July 2018.*\n\n\nOver the last few years, we know that AI experiments have used much more computation than previously. But just last month, an [investigation by OpenAI](https://blog.openai.com/ai-and-compute/) made some initial estimates of just how fast this growth has been. Comparing AlphaGo Zero to AlexNet, they found that the largest experiment now is 300,000-fold larger than the largest experiment six years ago. In the intervening time, the largest experiment in each year has been growing exponentially, with a doubling time of 3.5 months.\n\n\nThe rate of growth of experiments according to this *AI-Compute trend* is astoundingly fast, and this deserves some analysis. In this piece, I explore two issues. The first is that if experiments keep growing so fast, they will quickly become unaffordable, and so the trend will have to draw to a close. Unless the economy is drastically reshaped, this trend can be sustained for at most 3.5-10 years, depending on spending levels and how the cost of compute evolves over time. The second issue is that if this trend is sustained for even 3.5 more years, the amount of compute used in an AI experiment will have passed some interesting milestones. Specifically, the compute used by an experiment will have passed the amount required to simulate, using spiking neurons, a human mind thinking for eighteen years. Very roughly speaking, we could say that the trend would surpass the level required to reach the level of intelligence of an adult human, given an equally efficient algorithm. In sections (1) and (2), I will explore these issues in turn, and then in section (3), I will discuss the limitations of this analysis and weigh how this work might bear on AGI forecasts.\n\n\n1. How long can the AI-Compute trend be sustained?\n--------------------------------------------------\n\n\nTo figure out how long the AI-Compute trend can be economically sustained, we need to know three things: the rate of growth of the cost of experiments, the cost of current experiments, and the maximum amount that can be spent on an experiment in the future.\n\n\nThe size of the largest experiments is increasing with a doubling time of 3.5 months, (about an order of magnitude per year)[1](https://aiimpacts.org/interpreting-ai-compute-trends/#easy-footnote-bottom-1-1170 \"3.5/(log10(2))/12 = 0.9689, the number of years over which each 10x increase in compute occurs.\"), while the cost per unit of computation is decreasing by an order of magnitude every 4-12 years (the long-run trend has improved costs by 10x every 4 years, whereas recent trends have improved costs by 10x every 12 years)[2](https://aiimpacts.org/interpreting-ai-compute-trends/#easy-footnote-bottom-2-1170 \"AI Impacts gives a recent-hardware-prices figure, and past quarter-century FLOPS/$ figure, and I use these as a range. “The cheapest hardware prices (for single precision FLOPS/$) appear to be falling by around an order of magnitude every 10-16 years. This rate is slower than the trend of FLOPS/$ observed over the past quarter century, which was an order of magnitude every 4 years. There is no particular sign of slowing between 2011 and 2017.” “Figure 4 shows the 95th percentile fits an exponential trendline quite well, with a doubling time of 3.7 years, for an order of magnitude every 12 years. This has been fairly consistent, and shows no sign of slowing by early 2017. This supports the 10-16 year time we estimated from the Wikipedia theoretical performance above.”\"). So the cost of the largest experiments is increasing by an order of magnitude every 1.1 – 1.4 years.[3](https://aiimpacts.org/interpreting-ai-compute-trends/#easy-footnote-bottom-3-1170 \"12/(12×.96889-1) = 1.129 years. 4/(4×.96889-1) = 1.391 years.\")\n\n\nThe largest current experiment, AlphaGo Zero, probably cost about $10M.[4](https://aiimpacts.org/interpreting-ai-compute-trends/#easy-footnote-bottom-4-1170 \"$10M is a rough estimate of the costs of computation including pre-run experiments, based on two lines of evidence. First, the stated hardware costs. “During the development of Zero, Hassabis says the system was trained on hardware that cost the company as much as $35 million. The hardware is also used for other DeepMind projects.” If we allow for some non-AlphaGo usage of this hardware, and some other (e.g. electricity) costs for running AlphaGo, then the total compute cost for AlphaGo would be something like $10-30M. Second, the costs of the final training run, based on costs of public compute. If the TPU compute cost Google the $6.50/hr rate offered to the general public, then it would have cost $35M. Cloud compute is probably 10x more expensive than Google’s internal compute costs, so the cost of the final training run is probably around $3M, and the cost of the whole experiment something like $3-10M.\")\n\n\nThe largest that experiments can get depends who is performing them. The richest actor is probably the US government. Previously, the US spent 1% of annual GDP[5](https://aiimpacts.org/interpreting-ai-compute-trends/#easy-footnote-bottom-5-1170 \"Peak spending for the Manhattan project itself was around 1%, although total spending on nuclear weaponry in general was a little higher at 4.5% for several years following. “After getting fully underway in 1942, the Manhattan Project’s three-year cost of $2 billion (in 1940’s dollars) comprised nearly 1% of 1945 U.S. GDP. Extraordinary levels of spending and commitment of national resources to nuclear technology continued for many decades afterward. From 1947-1952, spending on nuclear weapons averaged 30% of total defense spending, which in 1952 was 15% of U.S. GDP.”
\nAllen, Greg, and Taniel Chan. Artificial Intelligence and National Security. Belfer Center for Science and International Affairs, 2017.\") on the Manhattan Project, and ~0.5% of annual GDP on NASA during the Apollo program.[6](https://aiimpacts.org/interpreting-ai-compute-trends/#easy-footnote-bottom-6-1170 \"NASA spending peaked at $4.5B/yr in 1966 (during the Apollo program), while US GDP was $815B https://history.nasa.gov/SP-4029/Apollo_18-16_Apollo_Program_Budget_Appropriations.htm
\nhttps://data.worldbank.org/indicator/NY.GDP.MKTP.CD?end=1990&locations=US-CN-KR&start=1966\") So let’s suppose they could similarly spend at most 1% of GDP, or $200B, on one AI experiment. Given the growth of one order of magnitude per 1.1-1.4 years, and the initial experiment size of $10M, the AI-Compute trend predicts that we would see a $200B experiment in 5-6 years.[7](https://aiimpacts.org/interpreting-ai-compute-trends/#easy-footnote-bottom-7-1170 \"1.129×log10(200B/10M) = 4.86 years. log10(200B/10M)×1.391 = 5.98 years.\") So given a broadly similar economic situation to the present one, that would have to mark an end to the AI-Compute trend.\n\n\nWe can also consider how long the trend can last if government is not involved. Due to their smaller size, economic barriers hit a little sooner for private actors. The largest among these are tech companies: Amazon and Google have current research and development budgets of about ~20B/yr each[8](https://aiimpacts.org/interpreting-ai-compute-trends/#easy-footnote-bottom-8-1170 \"Amazon and Google, the two largest players, have research and development budgets of $22.6B and $16.6B respectively. (Confirmed also from the primary source, “Research and development expenses 16,625 [in 2017]” on p36 of GOOG 10k).\"), so we can suppose that the largest individual experiment outside of government is $20B. Then the private sector can keep pace with the AI-Compute trend for around ¾ as long as government, or ~3.5-4.5 years.[9](https://aiimpacts.org/interpreting-ai-compute-trends/#easy-footnote-bottom-9-1170 \"log10(200B/10M)/log10(200B/10M) = 0.767 times as long. 1.129×log10(2000)=3.727 years. 1.391×log10(2000) = 4.591 years.\")[10](https://aiimpacts.org/interpreting-ai-compute-trends/#easy-footnote-bottom-10-1170 \"Greg Brockman of OpenAI recently said of the AI-Compute trend at a House Committee Hearing: “We expect this to continue for the next 5 years, using only today’s proven hardware technologies and not assuming any breakthroughs like quantum or optical.” This is a bold prediction according to my models. After five years, private organizations have already become unable to keep pace with the trend, and government would be unable to keep pace for more than another year.\")\n\n\nOn the other hand, the development of specialized hardware could cheapen computation, and thereby cause the trend to be sustainable for a longer period. If some new hardware cheapened compute by 1000x over and above price-performance Moore’s Law, then the economic barriers bite a little later– after an extra 3-4 years.[11](https://aiimpacts.org/interpreting-ai-compute-trends/#easy-footnote-bottom-11-1170 \"1.129 years×log10(1000) = 3.387 years. 1.391×log10(1000) = 4.173 years.\")\n\n\nIn order for the AI-Compute trend to be maintained for a really long time (more than about a decade), economic output would have to start growing by an order of magnitude or more per year. This is a really extreme scenario, but the main thing that would make it possible would presumably be some massive economic gains from some extremely powerful AI technology, that would also serve to justify the massive ongoing AI investment.\n\n\nOf course, it’s important to be clear that these figures are upper bounds, and they do not preclude the possibility that the AI-Compute trend may halt sooner (e.g. if AI research proves less economically useful than expected) either in a sudden or more gradual fashion.\n\n\nSo we have shown one kind of conclusion from a rapid trend — that it cannot continue for very long, specifically, beyond 3.5-10 years.\n\n\n2. When will the AI-Compute trend pass potentially AGI-relevant milestones?\n---------------------------------------------------------------------------\n\n\nThe second conclusion that we can draw is that if the AI-Compute trend continues at its current rapid pace, it will pass some interesting milestones. If the AI-Compute trend continues for 3.5-10 more years, then the size of the largest experiment is projected to reach 107-5×10¹³ Petaflop/s-days, and so the question is which milestones arrive below that level.[12](https://aiimpacts.org/interpreting-ai-compute-trends/#easy-footnote-bottom-12-1170 \"2^((3.727×12)/3.5) = 7025-fold growth of experiment.
\n2^(((5.98 + 4.173)×12)/3.5) = 3.01×10¹⁰-fold growth of experiment.
\nAlphago Zero size is 1860 Petaflop/s-days so projected experiment size is 1.3×10⁷-5.6×10¹³ Petaflop/s-days.\") Which milestones might allow the development of AGI is a controversial topic, but three candidates are:\n\n\n1. The amount of compute required to simulate a human brain for the duration of a human childhood\n2. The amount of compute required to simulate a human brain to play the number of Go games Alphago Zero required to become superhuman\n3. The amount of compute required to simulate the evolution of the human brain\n\n\n### Human-childhood milestone\n\n\nOne natural guess for the amount of computation required to create artificial intelligence is the amount of computation used by the human brain. Suppose an AI had (compared to a human):\n\n\n* a similarly efficient algorithm for learning to perform diverse tasks (with respect to both both compute and data),\n* similar knowledge built in to its architecture,\n* similar data, and\n* enough computation to simulate a human brain running for eighteen years, at sufficient resolution to capture the intellectual performance of that brain.\n\n\nThen, this AI should be able to learn to solve a similarly wide range of problems as an eighteen year-old can solve.[13](https://aiimpacts.org/interpreting-ai-compute-trends/#easy-footnote-bottom-13-1170 \"An implicit premise is that the amount of computation used by the human brain is less than the amount used to simulate the human brain. The idea here is that some fraction of the resources used to simulate a human brain are actually used for thinking.\")\n\n\nThere is a range of estimates for how many floating point operations per second are required to simulate a human brain for one second. Those [collected by AI Impacts](https://aiimpacts.org/brain-performance-in-flops/) have a median of 1018 FLOPS (corresponding roughly to a whole-brain simulation using Hodgkin-Huxley neurons[14](https://aiimpacts.org/interpreting-ai-compute-trends/#easy-footnote-bottom-14-1170 \"Table 9 of the WBE roadmap shows that a spiking neural network would use 1×1011 neurons. Table 7 shows that a Hodgkin-Huxley model would use about 1.2 million floating point operations to simulate a neuron for one second. Their product yields the 1×1018 figure.\")), and ranging from 3×10¹³FLOPS (Moravec’s estimate) to 1×1025FLOPS (simulating the metabolome). Running such simulations for eighteen years would correspond to a median of 7 million Petaflop/s-days (range 200 – 7×10¹³ Petaflop/s-days).[15](https://aiimpacts.org/interpreting-ai-compute-trends/#easy-footnote-bottom-15-1170 \"3×1013×365×18 = 1.97×1017. 1×1018×365×18 = 6.57×1021. 1×1025×365×18 = 6.57×1028.\")\n\n\nSo for the shortest estimates, such as the Moravec estimate, we have already reached enough compute to pass the human-childhood milestone. For the median estimate, and the Hodgkin-Huxley estimates, we will have reached the milestone within 3.5 years. For the metabolome estimates, the required amount of compute cannot be reached within the coming ten year window before the AI-Compute trend is halted by economic barriers. After the AI-Compute trend is halted, it’s worth noting that Moore’s Law could come back to the fore, and cause the size of experiments to continue to slowly grow. But on Moore’s Law, milestones like the metabolome estimate are still likely decades away.\n\n\n### AlphaGo Zero-games milestone\n\n\nOne objection to the human-childhood milestone is that AI systems presently are “slower-learners” than humans. AlphaGo Zero used 2.5 million Go games to become superhuman[16](https://aiimpacts.org/interpreting-ai-compute-trends/#easy-footnote-bottom-16-1170 \"From figure 3a, in the Alphago Zero paper, reinforcement learning surpassed AlphaGo Lee (which in turn defeated Lee Sedol) around halfway through a series of 4.9 million games of self-play. This analysis is from a guesstimate model by Median Group.\"), which if each game took at hour, would correspond to 300 years of Go games[17](https://aiimpacts.org/interpreting-ai-compute-trends/#easy-footnote-bottom-17-1170 \"2.5×106 / 24 / 365 = 285 years\"). We might ask how long it would take to run something as complex as the human brain, for 300 years, rather than just eighteen. In order for this milestone to be reached, the trend would have to continue for another 14 months longer than the human-childhood milestone[18](https://aiimpacts.org/interpreting-ai-compute-trends/#easy-footnote-bottom-18-1170 \"0.9689×log10(285/18) = 1.16\").\n\n\n### Brain-evolution milestone\n\n\nA more conservative milestone is the amount of compute required to simulate all neural evolution. One approach, described by [Shulman and Bostrom 2012](http://datascienceassn.org/sites/default/files/How%20Hard%20is%20Artificial%20Intelligence%20-%20Evolutionary%20Arguments%20and%20Selection%20Effects.pdf), is to look at the cost of simulating the evolution of nervous systems. This entails simulating 1025 neurons for one billion years.[19](https://aiimpacts.org/interpreting-ai-compute-trends/#easy-footnote-bottom-19-1170 \"From How Hard is Artificial Intelligence? “Erring on the side of conservatively high, if we assigned all 1019 insects fruit-fly numbers of neurons the total would be 1024 insect neurons in the world. This could be augmented with an additional order of magnitude, to reflect aquatic copepods, birds, reptiles, mammals, etc., to reach 1025”\") Shulman and Bostrom estimate the cost simulating a neuron for one second at 1-1010 floating point operations,[20](https://aiimpacts.org/interpreting-ai-compute-trends/#easy-footnote-bottom-20-1170 \"“The computational cost of simulating one neuron depends on the level of detail… Extremely simple neuron models use about 1,000 floating-point operations per second (FLOPS) to simulate one neuron (for one second of simulated time); an electrophysiologically realistic Hodgkin-Huxley model uses 1,200,000 FLOPS; a more detailed multicompartmental model would add another 3-4 orders of magnitude, while higher-level models that abstract systems of neurons could subtract 2-3 orders of magnitude from the simple models.” This range is 2-3 orders of magnitude lower than the per-neuron costs implied by the range of collated AI Impacts estimates for brain simulation.\") and so the total cost for simulating evolution is 3×10²¹-3×1031 Petaflop/s-days[21](https://aiimpacts.org/interpreting-ai-compute-trends/#easy-footnote-bottom-21-1170 \"1025×365×109×1 = 3.65×1036 FLOP/s-days. 1025×365×109×1010 = 3.65×1046 FLOP/s-days\"). This figure would not be reached until far beyond the time when the current AI-Compute trend must end. So the AI-Compute trend does not change the conclusion of Shulman and Bostrom that simulation of brain evolution on Earth is far away — even with a rapid increase in spending, this compute milestone would take many decades of advancement of Moore’s Law to be reached[22](https://aiimpacts.org/interpreting-ai-compute-trends/#easy-footnote-bottom-22-1170 \"This only slightly shortens the timelines compared to Shulman and Bostrom’s remarks: “The computing resources to match historical numbers of neurons in straightforward simulation of biological evolution on Earth are severely out of reach, even if Moore’s law continues for a century. The argument from evolutionary algorithms depends crucially on the magnitude of efficiency gains from clever search, with perhaps as many as thirty orders of magnitude required.”\").\n\n\nOverall, we can see that although the brain-evolution milestone is well beyond the AI-Compute trend, the others are not necessarily. For some estimates — especially metabolome estimates — the human-childhood and AlphaGo Zero-games milestones cannot be reached either. But some of the human-childhood and AlphaGo Zero-games milestones will be reached if the AI Compute trend continues for the next few years.\n\n\n3. Discussion and Limitations\n-----------------------------\n\n\nIn light of this analysis, a reasonable question to ask is: for the purpose of predicting AGI, which milestone should we care most about? This is very uncertain, but I would guess that building AGI is easier than the brain-evolution milestone would suggest, but that AGI could arrive either before, or after the AlphaGo Zero-games milestone is reached.\n\n\nThe first claim is because the brain-evolution milestone assumes that the process of algorithm discovery must be performed by the AI itself. It seems more likely to me that the appropriate algorithm is provided (or mostly provided) by the human designers at no computational cost (or at hardly any cost compared to simulating evolution).\n\n\nThe second matter — evaluating the difficulty of AGI relative to the AlphaGo Zero-games milestone — is more complex. One reason for thinking that the AlphaGo Zero-games milestone makes AGI look too easy is that more training examples ought to be required to teach general intelligence, than are required to learn the game of Go.[23](https://aiimpacts.org/interpreting-ai-compute-trends/#easy-footnote-bottom-23-1170 \"Analogously to the “Difficulty ratio” in the guesstimate model by Median Group.\") In order to perform a wider range of tasks, it will be necessary to consider a larger range of dependencies and to learn a more intricate mapping from actions to utilities. This matter could be explored further by comparing the sample efficiency of various solved AI problems and extrapolating the sample efficiency of AGI based on how much more complicated general intelligence seems. However, there are also reasons the AlphaGo Zero-games milestone might make things look too hard. Firstly, AlphaGo Zero does not use any pre-existing knowledge, whereas AGI systems might. If we had looked instead at the original AlphaGo, this would have required an order of magnitude fewer games relative to AlphaGo Zero[24](https://aiimpacts.org/interpreting-ai-compute-trends/#easy-footnote-bottom-24-1170 \"AlphaGo used hundreds of thousands, rather than single-digit millions of games. From Mastering the game of Go with deep neural networks and tree search: “We trained the policy network to classify positions according to expert moves played in the KGS data set. This data set contains 29.4 million positions from 160,000 games played by KGS 6 to 9 dan human players; 35.4% of the games are handicap games… The policy network was trained in this way for 10,000 minibatches of 128 games, using 50 GPUs, for one day”\"), and further efficiency gains might be possible for more general learning tasks. Secondly, there might be one or more orders of magnitude of conservatism built-in to the approach of using simulations of the human brain. Simulating the human brain on current hardware may be a rather inefficient way to capture its computing function: that is, the human brain might only be using some fraction of the computation that is needed to simulate it. So it’s hard to judge whether the AlphaGo Zero-games milestone is too late or too soon for AGI.\n\n\nThere is another reason for some more assurance that AGI is more than six years away. We can simply look at the AI-Compute trend and ask ourselves: is AGI as close to AlphaGo Zero as AlphaGo Zero is to AlexNet? If we think that the difference (in terms of some combination of capabilities, compute, or AI research) between the first pair is larger than the second, then we should think that AGI is more than six years away.\n\n\nIn conclusion, we can see that the AI-Compute trend is an extraordinarily fast trend that economic forces (absent large increases in GDP) cannot sustain beyond 3.5-10 more years. Yet the trend is also fast enough that if it is sustained for even a few years from now, it will sweep past some compute milestones that could plausibly correspond to the requirements for AGI, including the amount of compute required to simulate a human brain thinking for eighteen years, using Hodgkin Huxley neurons. However, other milestones will not be reached before economic factors halt the AI-Compute trend. For example, this analysis shows that we will not have enough compute to simulate the evolution of the human brain for (at least) decades.\n\n\n*Thanks Jack Gallagher, Danny Hernandez, Jan Leike, and Carl Shulman for discussions that helped with this post.*\n\n\n\n\n---\n\n", "url": "https://aiimpacts.org/interpreting-ai-compute-trends/", "title": "Interpreting AI compute trends", "source": "aiimpacts.org", "source_type": "wordpress", "date_published": "2018-07-10T22:04:45+00:00", "paged_url": "https://aiimpacts.org/feed?paged=13", "authors": ["Katja Grace"], "id": "19c5586a6fa3f2f92a3cc3527502bc8e", "summary": ["A previous [OpenAI post](https://blog.openai.com/ai-and-compute/) showed that the amount of compute used in the most expensive AI experiments has been growing exponentially for six years, with a doubling time of 3.5 _months_. This is extraordinarily fast, and can be thought of as a combination of growth in the amount spent on an experiment, and a decrease in the cost of computation. Such a trend can only continue for a few more years, before the cost of the experiment exceeds the budget of even the richest actors (such as the US government). However, this might still be enough to reach some important milestones for compute, such as \"enough compute to simulate a human brain for 18 years\", which is plausibly enough to get to AGI. (This would not happen for some of the larger estimates of the amount of computation in the human brain, but would happen for some of the smaller estimates.) It is still an open question which milestone we should care about."]} {"text": "Occasional update July 5 2018\n\n*By Katja Grace, 5 July 2018*\n\n\nBefore I get to substantive points, there has been some confusion over the distinction between blog posts and pages on AI Impacts. To make it clearer, this **blog post** shall proceed in a way that is silly, to distinguish it from the very serious and authoritative reference pages that comprise the bulk of AI Impacts.\n\n\nNow for a picture of a duck, to remind you that this is silly, and also that we are all fragile biological organisms that evolved because apparently that’s what happens if you just leave a bunch of wet mud on a space rock for long enough, alone and vulnerable in a hostile and uncharted world.\n\n\n[](http://aiimpacts.org/wp-content/uploads/2018/07/animal-bird-cute-162142.jpg)\n\n\nAnd now to the exciting facts on the ground, as we try to marginally rectify that situation.\n\n\n### People\n\n\nTegan McCaslin is now working at AI Impacts, as far as I can tell about five hundred hours a week. It’s going well, except that the rate at which she sends me extensive, carefully researched articles about neuroanatomy and genetics and such to review is in slight tension with my preferred lifestyle.\n\n\nWe also welcome Carl Shulman as occasional consultant on everything, and reviewer of things (especially articles about neuroanatomy and genetics and such…)\n\n\nJustis Mills joined us last year, to work on miscellany. He usually does one of those software related things, but in his spare time he has been [making illustrative timelines of near-term AI predictions](https://cdn.knightlab.com/libs/timeline3/latest/embed/index.html?source=1NbsZ5kiaRxTW8Jo6jkJgOkHatVQHtMqKu22WwdMrwZc&font=Default&lang=en&initial_zoom=2&height=650) and checking whether everything on AI Impacts isn’t obviously false, and fixing bits of it, and such.\n\n\nWe mostly-farewell Michael Wulfsohn—an Australian economist, [called to us](https://aiimpacts.org/the-tyranny-of-the-god-scenario/) from the Central Bank of Lesotho by [WaitButWhy](https://waitbutwhy.com/2015/01/artificial-intelligence-revolution-1.html)—who is winding up his assessment of how great avoiding human extinction might be (having already estimated how [how much of a bother it might be](https://aiimpacts.org/costs-of-extinction-risk-mitigation/)). He has gone to get a PhD, the better to save the world.\n\n\n### Places\n\n\nOur implicit office has moved from a spare room in my house to Tegan’s house. This is good, because she has an absurdly nice rug, and an excellent snack drawer, and it is a minor ambition of mine to head an organization which has Bay Area start-up quality snack areas.\n\n\nWe have also been trying out co-working with other save-the-world-something-something-AI related folks around Berkeley, which seems promising. We have also been trying out co-working with Oxford, which seems promising, but not as Bay Area convenient as we would like.\n\n\n### Things we want\n\n\nWe [want to hire](https://aiimpacts.org/jobs/) more people. Relatedly, we would like [money](https://aiimpacts.org/donate/). We think these things would nicely complement our many brilliant and tractable [research ideas](https://aiimpacts.org/promising-research-projects/) and our ambition. We also want to have our own T-shirts, but that is on the back-burner.\n\n\n### Things we got\n\n\n[$100,000 from The Open Philanthropy Project](https://www.openphilanthropy.org/focus/global-catastrophic-risks/potential-risks-advanced-artificial-intelligence/ai-impacts-general-support-2018), for the next two years.\n\n\n$39,000 from another donor to support several specific research projects from our [list of promising research projects](https://aiimpacts.org/promising-research-projects/).\n\n\n### Projects\n\n\nYou can mostly see what we are up to by watching various parts of [our front page](https://aiimpacts.org/), so I shan’t go into it all, except to say that I for one am especially enjoying my investigation into reasons to (or not to) expect [AI discontinuities](https://aiimpacts.org/likelihood-of-discontinuous-progress-around-the-development-of-agi/). If you too are fascinated by this topic, and want to give especially many pointed comments on it, you can do so [on this doc version](https://docs.google.com/document/d/1Gf_G_5AYy11Xgu1O_SbpXHQ5dtpWeY8L3gIurHDfUk0/edit?usp=sharing).\n\n\nOur [survey](https://aiimpacts.org/2016-expert-survey-on-progress-in-ai/) became the [16th most discussed journal article](https://www.altmetric.com/top100/2017/#list&article=20475804) of 2017, so that was neat. If I recall, I was at least relatively in favor of not writing a paper about it, so I was probably wrong there. (Probably good job, everyone else!) I suspect this success is related to the journalists who have been writing to me endlessly, and me being invited to give talks, and [go to Chile](https://worldlypositions.tumblr.com/post/170134252744/chile-vii-futures-congress) and be on the radio and that kind of thing. Which has all been an unusual experience.\n\n\n### How you can get involved\n\n\nIf you want to do this kind of work, consider applying for a [job](https://aiimpacts.org/jobs/) with us, or just doing one of [these projects](https://aiimpacts.org/promising-research-projects/) anyway, and sending it to us. If you want to chat about this kind of research, or spy on it, or help a tiny bit noncommittally, ask us nicely and we might add you to our fairly open Slack. If you want to help in some other way, we especially welcome money and any good researchers you have hanging around, but are open to other ideas.\n\n", "url": "https://aiimpacts.org/occasional-update-july-5-2018/", "title": "Occasional update July 5 2018", "source": "aiimpacts.org", "source_type": "wordpress", "date_published": "2018-07-05T15:36:59+00:00", "paged_url": "https://aiimpacts.org/feed?paged=13", "authors": ["Katja Grace"], "id": "84dd088e850da0d4330a2d806d7592e7", "summary": []} {"text": "Trend in compute used in training for headline AI results\n\nCompute used in the largest AI training runs appears to have roughly doubled every 3.5 months between 2012 and 2018.\n\n\nDetails\n-------\n\n\nAccording to [Amodei and Hernandez, on the OpenAI Blog](https://blog.openai.com/ai-and-compute/):\n\n\n\n> …since 2012, the amount of compute used in the largest AI training runs has been increasing exponentially with a 3.5 month-doubling time (by comparison, Moore’s Law [had](https://www.nature.com/articles/s41928-017-0005-9) an 18-month doubling period). Since 2012, this metric has grown by more than 300,000x (an 18-month doubling period would yield only a 12x increase)…\n> \n> \n\n\nThey give the following figure, and some of their calculations. We have not verified their calculations, or looked for other reports on this issue.\n\n\n[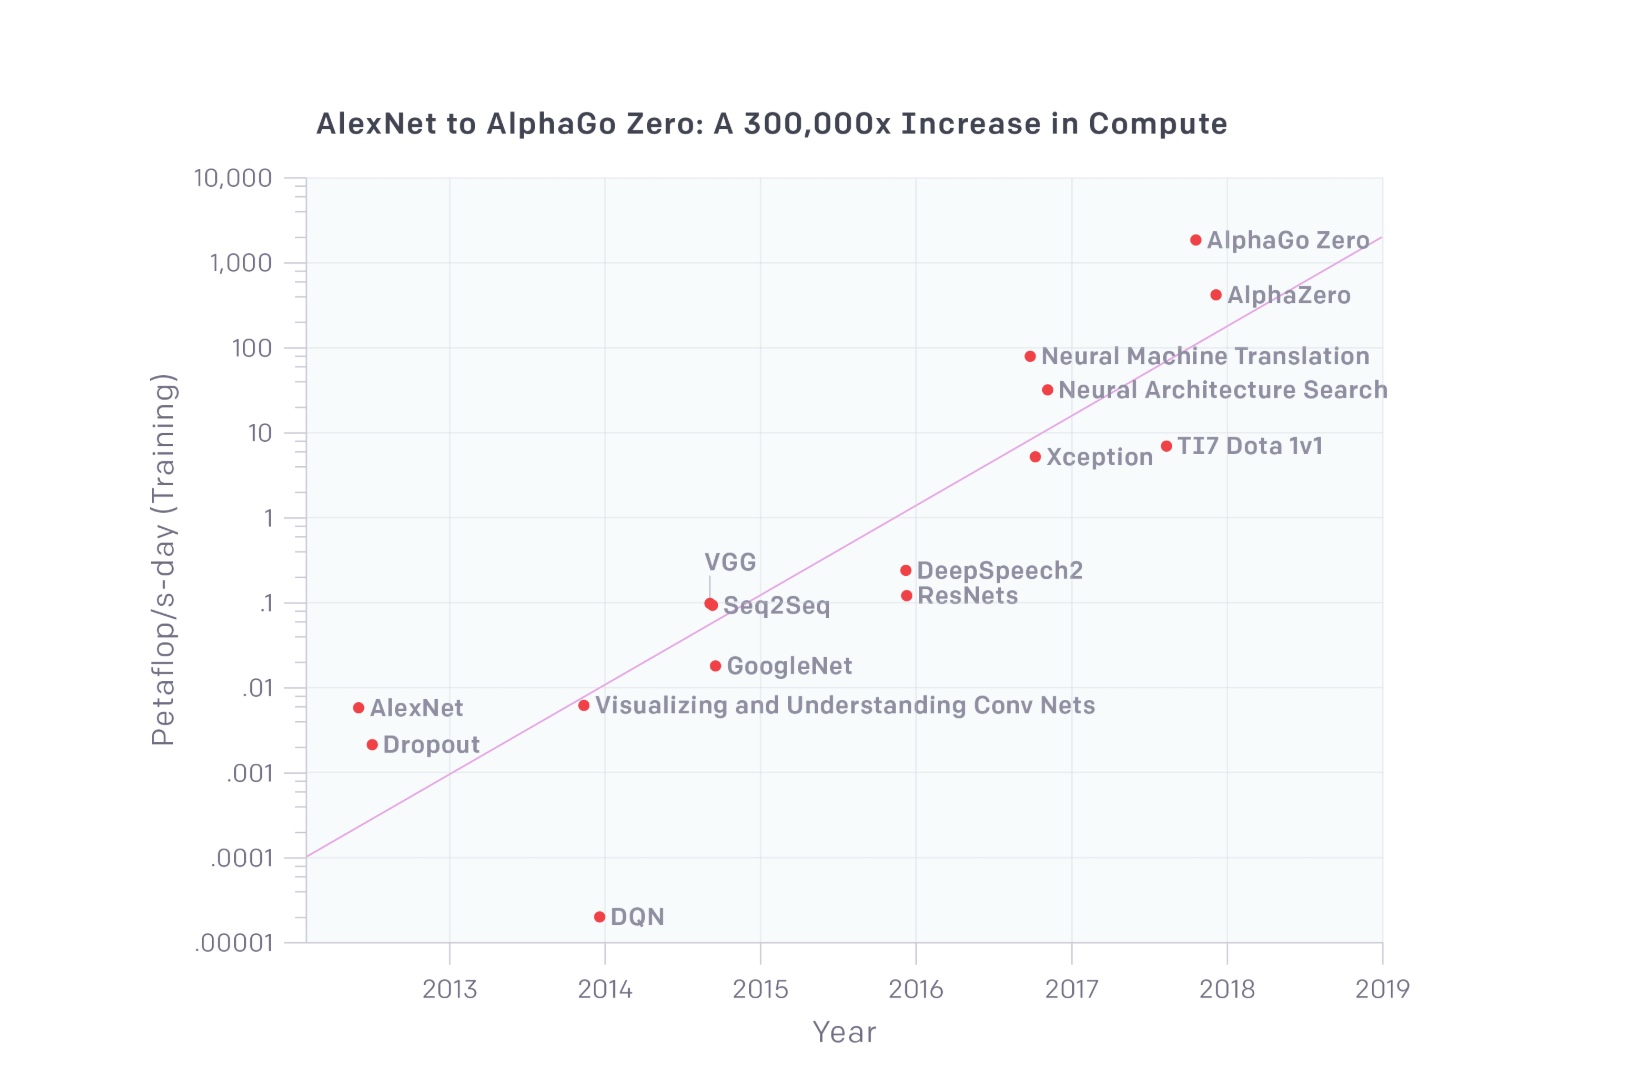](http://aiimpacts.org/wp-content/uploads/2018/05/OpenAI-AI-Compute-Trend.jpeg)**Figure 1:** Originally captioned: The chart shows the total amount of compute, in petaflop/s-days, that was used to train selected results that are relatively well known, used a lot of compute for their time, and gave enough information to estimate the compute used. A petaflop/s-day (pfs-day) consists of performing 1015 neural net operations per second for one day, or a total of about 1020 operations. The compute-time product serves as a mental convenience, similar to kW-hr for energy. We don’t measure peak theoretical FLOPS of the hardware but instead try to estimate the number of actual operations performed. We count adds and multiplies as separate operations, we count any add or multiply as a single operation regardless of numerical precision (making “FLOP” a slight misnomer), and we ignore [ensemble models](http://web.engr.oregonstate.edu/~tgd/publications/mcs-ensembles.pdf). Example calculations that went into this graph are provided in this [appendix](https://blog.openai.com/ai-and-compute/#appendixmethods). Doubling time for line of best fit shown is 3.43 months.\n\n", "url": "https://aiimpacts.org/trend-in-compute-used-in-training-for-headline-ai-results/", "title": "Trend in compute used in training for headline AI results", "source": "aiimpacts.org", "source_type": "wordpress", "date_published": "2018-05-17T21:33:13+00:00", "paged_url": "https://aiimpacts.org/feed?paged=13", "authors": ["Katja Grace"], "id": "d97b9dd079c416bccacf2ba48808e1d0", "summary": []} {"text": "The tyranny of the god scenario\n\n*By Michael Wulfsohn, 6 April 2018*\n\n\nI was convinced. An intelligence explosion would result in the sudden arrival of a superintelligent machine. Its abilities would far exceed those of humans in ways we can’t imagine or counter. It would likely arrive within a few decades, and would wield complete power over humanity. Our species’ most important challenge would be to solve the [value alignment problem](https://www.fhi.ox.ac.uk/edge-article/622578843254063104/). The impending singularity would lead either to our salvation, our extinction, or worse.\n\n\nIntellectually, I knew that it was not certain that this “god scenario” would come to pass. If asked, I would even have assigned it a relatively low probability, certainly much less than 50%. Nevertheless, it dominated my thinking. Other possibilities felt much less real: that humans might achieve direct control over their superintelligent invention, that reaching human-level intelligence might take hundreds of years, that there might be a slow progression from human-level intelligence to superintelligence, and many others. I paid lip service to these alternatives, but I didn’t want them to be valid, and I didn’t think about them much. My mind would always drift back to the god scenario.\n\n\nI don’t know how likely the god scenario really is. With currently available information, nobody can know for sure. But whether or not it’s likely, the idea definitely has powerful intuitive appeal. For example, it led me to change my beliefs about the world more quickly and radically than I ever had before. I doubt that I’m the only one.\n\n\nWhy did I find the god scenario so captivating? I like science fiction, and the idea of an intelligence explosion certainly has science-fictional appeal. I was able to relate to the scenario easily, and perhaps better think through the implications. But the transition from science fiction to reality in my mind wasn’t immediate. I remember repeatedly thinking “nahhh, surely this can’t be right!” My mind was trying to put the scenario in its science-fictional place. But each time the thought occurred, I remember being surprised at the scenario’s plausibility, and at my inability to rule out any of its key components.\n\n\nI also tend to place high value on intelligence itself. I don’t mean that I’ve assessed various qualities against some measure of value and concluded that intelligence ranks highly. I mean it in a personal-values sense. For example, the level of intelligence I have is a big factor in my level of self-esteem. This is probably more emotional than logical.\n\n\nThis emotional effect was an important part of the god scenario’s impact on me. At first, it terrified me. I felt like my whole view of the world had been upset, and almost everything people do day to day seemed to no longer matter. I would see a funny video of a dog barking at its reflection, and instead of enjoying it, I’d notice the grim analogy of the intellectual powerlessness humanity might one day experience. But apart from the fear, I was also tremendously excited by the thought of something so sublimely intelligent. Having not previously thought much about the limits of intelligence itself, the concept was both consuming and eye-opening, and the possibilities were inspiring. The notion of a superintelligent being appealed to me similarly to the way Superman’s abilities have enthralled audiences. \n\n\nOther factors included that I was influenced by highly engaging prose, since I first learned about superintelligence by reading this excellent [waitbutwhy.com blog post](http://waitbutwhy.com/2015/01/artificial-intelligence-revolution-1.html). Another was my professional background; I was accustomed to worrying about improbable but significant threats, and to arguments based on expected value. The concern of prominent people—Bill Gates, Elon Musk, and Stephen Hawking—helped. Also, I get a lot of satisfaction from working on whatever I think is humanity’s most important problem, so I really couldn’t ignore the idea. \n\n\nBut there were also countervailing effects in my mind, leading away from the god scenario. The strongest was the outlandishness of it all. I had always been dismissive of ideas that seem like doomsday theories, so I wasn’t automatically comfortable giving the god scenario credence in my mind. I was hesitant to introduce the idea to people who I thought might draw negative conclusions about my judgement. \n\n\nI still believe the god scenario is a real possibility. We should assiduously prepare for it and proceed with caution. However, I believe I have gradually escaped its intuitive capture. I can now consider other possibilities without my mind constantly drifting back to the god scenario. \n\n\nI believe a major factor behind my shift in mindset was my research interest in analyzing [AI safety as a global public good](https://aiimpacts.org/friendly-ai-as-a-global-public-good/). Such research led me to think concretely about other scenarios, which increased their prominence in my mind. Relatedly, I began to think I might be better equipped to contribute to outcomes in those other scenarios. This led me to want to believe that the other scenarios were more likely, a desire compounded by the danger of the god scenario. My personal desires may or may not have influenced my objective opinion of the probabilities. But they definitely helped counteract the emotional and intuitive appeal of the god scenario. \n\n\nExposure to mainstream views on the subject also moderated my thinking. In one instance, reading an Economist [special report](http://www.economist.com/news/special-report/21700762-techies-do-not-believe-artificial-intelligence-will-run-out-control-there-are) on artificial intelligence helped counteract the effects I’ve described, despite that I actually disagreed with most of their arguments against the importance of existential risk from AI. \n\n\nExposure to work done by the Effective Altruism community on different future possibilities also helped, as did my discussions with Katja Grace, Robin Hanson, and others during my work for AI Impacts. The exposure and discussions increased my knowledge and the sophistication of my views such that I could better imagine the range of AI scenarios. Similarly, listening to Elon Musk’s views of the importance of developing brain-computer interfaces, and seeing OpenAI pursue goals that may not squarely confront the god scenario, also helped. They gave me a choice: decide without further ado that Elon Musk and OpenAI are misguided, or think more carefully about other potential scenarios.\n\n\n**Relevance to the cause of AI safety**\n\n\nI believe the AI safety community probably includes many people who experience the god scenario’s strong intuitive appeal, or have previously experienced it. This tendency may be having some effects on the field.\n\n\nStarting with the obvious, such a systemic effect could cause pervasive errors in decision-making. However, I want to make clear that I have no basis to conclude that it has done so among the Effective Altruism community. For me, the influence of the god scenario was subtle, and driven by its emotional facet. I could override it when asked for a rational assessment of probabilities. But its influence was pervasive, affecting the thoughts to which my mind would gravitate, the topics on which I would tend to generate ideas, and what I would feel like doing with my time. It shaped my thought processes when I wasn’t looking. \n\n\nPreoccupation with the god scenario may also entail a public relations risk. Since the god scenario’s strong appeal is not universal, it may polarize public opinion, as it can seem bizarre or off-putting to many. At worst, a rift may develop between the AI safety community and the rest of society. This matters. For example, policymakers throughout the world have the ability to promote the cause of AI safety through funding and regulation. Their involvement is probably an essential component of efforts to prevent an AI arms race through international coordination. But it is easier for them to support a cause that resonates with the public.\n\n\nConversely, the enthusiasm created by the intuitive appeal of the god scenario can be quite positive, since it attracts attention to related issues in AI safety and existential risk. For example, others’ enthusiasm and work in these areas led me to get involved. \n\n\nI hope readers will share their own experience of the intuitive appeal of the god scenario, or lack thereof, in the comments. A few more data points and insights might help to shed light.\n\n", "url": "https://aiimpacts.org/the-tyranny-of-the-god-scenario/", "title": "The tyranny of the god scenario", "source": "aiimpacts.org", "source_type": "wordpress", "date_published": "2018-04-06T15:00:00+00:00", "paged_url": "https://aiimpacts.org/feed?paged=13", "authors": ["Michael Wulfsohn"], "id": "4c5484f5abfcc49d7909a3d62ccf4b7a", "summary": []} {"text": "Promising research projects\n\nThis is an incomplete list of concrete projects that we think are tractable and important. We may do any of them ourselves, but many also seem feasible to work on independently. Those we consider especially well suited to this are marked Ψ. More potential projects are listed [here](http://aiimpacts.org/possible-investigations/).\n\n\n### Project\n\n\n**Review the literature on forecasting (in progress) Ψ**\n\n\nSummarize what is known about procedures that produce good forecasts, and measures that are relatively easier to forecast. This may involve reading secondary sources, or collecting past forecasts and investigating what made some of them successful.\n\n\nThis would be an input to improving our own forecasting practices, and to knowing which other forecasting efforts to trust.\n\n\nWe have [reviewed](http://aiimpacts.org/evidence-on-good-forecasting-practices-from-the-good-judgment-project/) some literature associated with the Good Judgment Project in particular.\n\n\n**Review considerations regarding the chance of local, fast takeoff Ψ**\n\n\nWe have a list of considerations [here](http://aiimpacts.org/likelihood-of-discontinuous-progress-around-the-development-of-agi/). If you find local, fast take-off likely, check if the considerations that lead you to this view are represented. Alternately, interview someone else with a strong position about the considerations they find important. If there are any arguments or counterarguments that you think are missing, write a short page explaining the case.\n\n\nCollecting arguments on this topic is helpful because opinion among well-informed thinkers on the topic seems to diverge from what would be expected given the arguments that we know about. This suggests that we are missing some important considerations, that we would need to well assess the chance of local, fast takeoff.\n\n\n**Quantitatively model an intelligence explosion Ψ**\n\n\nAn intelligence explosion (or ‘recursive self-improvement’) consists of a feedback loop where researcher efforts produce scientific progress, which produces improved AI performance, which produces more efficient researcher efforts. This forms a loop, because the researchers involved are artificial themselves.\n\n\nThough this loop does not yet exist, relatively close analogues to all of the parts of it already occur: for instance, researcher efforts do lead to scientific progress; scientific progress does lead to better AI; better AI does lead to more capacity at the kinds of tasks that AI can do.\n\n\nCollect empirical measurements of proxies like these, for different parts of the hypothesized loop (each part of this could be a stand-alone project). Model the speed of the resulting loop if they were put together, under different background conditions.\n\n\nThis would give us a very rough estimate of the contribution of intelligence explosion dynamics to the speed of intelligence growth in a transition to an AI-based economy. Also, a more detailed model may inform our understanding of available strategies to improve outcomes.\n\n\n**Interview AI researchers on topics of interest Ψ**\n\n\nFind an AI researcher with views on matters of interest (e.g. AI risk, timelines, the relevance of neuroscience to AI progress) and interview them. Write a summary, or transcript (with their permission). Some examples [here](http://aiimpacts.org/conversation-with-steve-potter/), [here](http://aiimpacts.org/conversation-with-tom-griffiths/), [here](http://aiimpacts.org/joscha-bach-on-the-unfinished-steps-to-human-level-ai/). (If you do not expect to run an interview well enough to make a good impression on the interviewee, consider practicing elsewhere first, so as not to discourage interacting with similar researchers in the future.)\n\n\nTalking to AI researchers about their views can be informative about the nature of AI research (e.g. What problems are people trying to solve? [How much does it seem like hardware matters?](http://aiimpacts.org/2016-expert-survey-on-progress-in-ai/)), and provide an empirically informed take on questions and considerations of interest to us (e.g. [Current techniques seem really far from general](http://aiimpacts.org/what-do-ml-researchers-think-you-are-wrong-about/)). They also tell us about state of opinion within the AI research community, which may be relevant in itself.\n\n\n**Review what is known about the relative intelligence of humans, chimps, and other animals (in progress)**\n\n\nReview efforts to measure animal and human intelligence on a single scale, and efforts to quantify narrower cognitive skills across a range of animals.\n\n\nHumans are radically more successful than other animals, in some sense. This is [taken as reason](http://aiimpacts.org/likelihood-of-discontinuous-progress-around-the-development-of-agi/) to expect that small modifications to brain design (for instance whatever evolution did between the similar brains of chimps and humans) can produce outsized gains in some form of mental performance, and thus that AI researchers may see similar astonishing progress near human-level AI.\n\n\nHowever without defining or quantifying the mental skills of any relevant animals, it is unclear a) whether *individual intelligence* in particular accounts for humans’ success (rather than e.g. ability to accrue culture and technology), b) whether the gap in capabilities between chimps and humans is larger than expected (maybe chimps are also astonishingly smarter than smaller mammals), or c) whether the success stems from something that evolution was ‘intentionally’ progressing on. These things are all relevant to the strength of an argument for AI ‘fast take-off’ based on human success over chimps (see [here](http://aiimpacts.org/likelihood-of-discontinuous-progress-around-the-development-of-agi/)).\n\n\n**Review explanations for humans’ radical success over apes (in progress)**\n\n\nInvestigate what is known about the likely causes of human success, relative to that of other similar animals. In particular, we are interested in how likely improvement in individual cognitive ability is to account for this (as opposed to say communication and group memory abilities).\n\n\nThis would help resolve the same issues described in the last section (‘Review what is known about the relative intelligence of humans, chimps, and other animals’).\n\n\n**Collect data on time to cross the human range on intellectual skills where machines have surpassed us (in progress) Ψ**\n\n\nFor intellectual skills where machines have surpassed humans, find out how long it took to go from the worst performance to average human skill, and from average human skill to superhuman skill.\n\n\nThis would contribute to [this project](http://aiimpacts.org/is-the-range-of-human-intelligence-small/).\n\n\n**Measure the importance of hardware progress in a specific narrow AI trajectory Ψ**\n\n\nTake an area of AI progress, and assess how much of annual improvement can be attributed to hardware improvements vs. software improvements, or what the more detailed relationship between the two is.\n\n\nUnderstanding the overall importance of hardware progress and software progress (and other factors) in overall AI progress lets us know to what extent our future expectations should be a function of expected hardware developments, versus software developments. This both alters what our timelines look like (e.g. see [here](http://aiimpacts.org/human-level-hardware-timeline/)), and tells us what we should be researching to better understand AI timelines.\n\n", "url": "https://aiimpacts.org/promising-research-projects/", "title": "Promising research projects", "source": "aiimpacts.org", "source_type": "wordpress", "date_published": "2018-04-06T06:00:47+00:00", "paged_url": "https://aiimpacts.org/feed?paged=13", "authors": ["Katja Grace"], "id": "a1d597ac0eaef2f62c3def3ced025556", "summary": []} {"text": "Brain wiring: The long and short of it\n\n*By Tegan McCaslin, 30 March 2018*\n\n\nWhen I took on the task of counting up all the brain’s fibers and figuratively laying them end-to-end, I had a sense that it would be relatively easy–do a bit of strategic Googling, check out a few neuroscience references, and you’ve got yourself a relaxing Sunday afternoon project. By that afternoon project’s 40th hour, I had begun to question my faith in Paul Christiano’s project length estimates.\n\n\nIt was actually pretty surprising how thin on the ground numbers and quantities about the metrics I was after seemed to be. Even somewhat simple questions, like “how many of these neuron things does the brain even have”, proved not to have the most straightforward answer. According to [one author](https://www.ncbi.nlm.nih.gov/pmc/articles/PMC2776484/), the widely-cited, rarely-caveated figure in textbooks of 100 billion neurons couldn’t be sourced in any primary literature published before the late 2000s, and this echo chamber-derived estimate was subsequently denounced for being off by tens of billions in either direction (depending on who you ask). But hey, what’s a few tens of billions between friends?\n\n\nThe question of why these numbers are so hard to find is an interesting one. One answer is that it’s genuinely difficult to study populations of cells at the required level of detail. Another is that perhaps neuroscientists are too busy studying silly topics like “how the brain works” or “clinically relevant things” to get down to the real meat of science, which is anal-retentively cataloging every quantity that could plausibly be measured. Perhaps the simplest explanation is just that questions like “how long is the entire dendritic arbor of a Purkinje cell” didn’t have a great argument for why they might be useful, prior to now.\n\n\n[](http://aiimpacts.org/wp-content/uploads/2018/03/Purkinje_cell_by_Cajal.png)*Or maybe its “fuck it”-quotient was too high.*\nWhich brings us rather neatly to the point of why an AI forecasting organization might care about the length of all the wires in the brain, even when the field of neuroscience seems not to. At a broad level, it’s probably the case that neuroscientists care about very different aspects of the brain than AI folks do, because neuroscientists mostly aren’t trying to solve an engineering problem (at least, not the engineering problem of “build a brain out of bits of metal and plastic”). The particular facet of that engineering problem we were interested in here was: how much of a hurdle is hauling information around going to be, once computation is taken care of?\n\n\nOur length estimates don’t provide an exhaustive answer to that question, and to be honest they can’t really tell you anything on their own. But, as is the case with AI Impacts’ 2015 article on [brain performance in TEPS](https://aiimpacts.org/brain-performance-in-teps/), learning these facts about the brain moves us incrementally closer to understanding how promising our current models of hardware architectures are, and where we should expect to encounter trouble. \n\n\nSome interesting takeaways: long-range fibers–that is, myelinated ones–probably account for about 20% of the total length of brain wires. Also, the neocortex is *huge*, but not because it has lots of neurons. \n\n\nScroll to the bottom of [our article](https://aiimpacts.org/transmitting-fibers-in-the-brain-total-length-and-distribution-of-lengths/) if you’re a cheater who just wants to see a table full of summary statistics, but read the whole thing if you want those numbers to have some context. And please contact me if you spot anything wrong, or think I missed something, or if you’re Wen or Chklovskii of [Wen and Chklovskii 2004](http://journals.plos.org/ploscompbiol/article?id=10.1371/journal.pcbi.0010078#pcbi-0010078-g002) and you want to explain your use of tildes in full detail.\n\n", "url": "https://aiimpacts.org/brain-wiring-the-long-and-short-of-it/", "title": "Brain wiring: The long and short of it", "source": "aiimpacts.org", "source_type": "wordpress", "date_published": "2018-03-30T07:02:35+00:00", "paged_url": "https://aiimpacts.org/feed?paged=13", "authors": ["Tegan McCaslin"], "id": "f2f1acef938a11e9d97fc8edd23db552", "summary": []} {"text": "Transmitting fibers in the brain: Total length and distribution of lengths\n\nThe human brain’s approximately 86 billion neurons are probably connected by something like 850,000 km of axons and dendrites. Of this total, roughly 80% is short-range, local connections (averaging 680 microns in length), and approximately 20% is long-range, global connections in the form of myelinated fibers (likely averaging several centimeters in length).\n\n\nBackground\n----------\n\n\nThe brain’s precisely coordinated action relies on a dense network of fibers capable of rapidly transmitting information, both locally (to adjacent neurons whose separation can be measured in microns) and to distant locations removed by many centimeters from one another. And while manipulation of that information–”computation”–is an important component of what the brain does, it would be hard-pressed to make any use of that computational power without the ability to communicate within itself. \n\n\nSo how much of a problem does the need for moving around information pose for brains and, by extension, brain-like computers? It’s clear from a cursory physical examination of the brain that evolution has prioritized information transfer, since the vast majority of brain tissue is taken up by the tendrils of axons and dendrites snaking through a convoluted maze of cables. Some proportion of these form short-range connections with neurons that are both nearby in physical space, and are probably also close in “functional space” as well. The rest are long-range fibers, which move information from these local, functionally similar regions to areas separated by significant physical, and likely also functional, distance. Whether we can expect one type of connection or the other to impose a larger cost on hardware, as well as the transferability of total brain fiber length to communication requirements in hardware, depends largely on the kind of hardware in question. One can imagine both types of brain-mimicking computer architecture that might make long-distance communication the main limiting factor, as well as architectures where long-distance communication was trivial compared to short-distance communication. \n\n\nAI Impacts [previously](https://aiimpacts.org/brain-performance-in-teps/) estimated brain communication costs in terms of the benchmark TEPS, or “traversed edges per second”, where “edges” corresponded roughly to synaptic connections between neurons. However, this benchmark measures performance in a certain family of graphs that may not be very representative of connectivity patterns in the brain. Characterizing the actual topology of connections in the brain, especially the proportions contributed by long and short fibers, may give us a more informative picture of the capacities hardware will need in order to mimic wetware.\n\n\nShort fibers\n------------\n\n\nOur estimates for length and length distribution of short fibers were found by comparing the results of what might be called “top-down” and “bottom-up” approaches. Directly measuring any cell-level metric for the entire brain is challenging, but two substantially different methodologies converging on similar answers is probably a reasonable substitute for direct measurement. The first of these relied on observations of fiber density in the neocortex of rats, which there is reason to believe translates fairly well to the human brain as a whole. The second required gathering morphology data on various types of human neurons, then adjusting for the proportion of each cell type in the brain.\n\n\n#### Some important notes on brain structure and animal models\n\n\nIn this section, our estimates were drawn from only two brain regions: the cerebral cortex alone in the first case, and the cerebral cortex and cerebellar cortex in the second. However, taken together, these regions account for roughly 85% of total brain volume and as many as 99% of all brain neurons in humans, making this a safe approximation for all gray matter (which represents short connections–see [here](https://aiimpacts.org/transmitting-fibers-in-the-brain-total-length-and-distribution-of-lengths/#Myelination_as_indicative_of_fiber_length)) in the brain.\n\n\nSince the first case considers the brains of rats rather than humans, it may seem to have little utility, but in fact the composition of tissue in rats’ neocortex differs from ours in only [a few predictable ways](https://link.springer.com/book/10.1007/978-3-662-03733-1). There are more neurons per cubic millimeter in the cortex of small animals [(3-10x)](http://www.scholarpedia.org/article/Brain), meaning that somewhat more of the brain’s volume is taken up by cell bodies, slightly decreasing the density of fibers compared to larger brains. However, cell bodies are measured in the tens of microns, so this is unlikely to bear on our conclusions.\n\n\n### Total length from neocortical fiber density\n\n\nWhile the cerebral cortex comprises [82%](https://www.ncbi.nlm.nih.gov/pmc/articles/PMC2776484/) of the volume of the human brain, only [19%](https://en.wikipedia.org/wiki/Human_brain#Microanatomy) of the brain’s 86 billion neurons reside here, cushioned in the dense web of axons and dendrites known as [“neuropil”](http://www.scholarpedia.org/article/Neuroanatomy#The_Neuropil). The amount of neuropil packed into any given tissue sample can give us a sense of the lengths of these fibers per unit volume, as long as we also know their diameters.\n\n\nAfter determining rat neocortical fiber density, [Braitenberg and Schüz (1998)](https://link.springer.com/book/10.1007/978-3-662-03733-1) concluded that the total length of the average neuron’s axonal tree was between 10 and 40 mm, and that the average dendritic tree came out to 4 mm. These numbers were derived from examining electron micrographs of tissue samples to find the proportion of area taken up by axons and dendrites, then measuring the average diameter of these fibers to find an axonal density of 4 km per mm^3, and a dendritic density of 456 m per mm^3. It’s not quite clear to us how the authors got from these numbers to average fiber length per neuron, but since their average values agreed with values we obtained by other methods (see below), we were inclined to assume their process was reasonable.\n\n\nAssuming mouse neocortical neurons are comparable to human neurons, their average fiber length suggests that the neocortex alone contains at least **220,000 km** of short range connections between dendrites and axons.[1](https://aiimpacts.org/transmitting-fibers-in-the-brain-total-length-and-distribution-of-lengths/#easy-footnote-bottom-1-1118 \"16 billion neocortical neurons x (minimum total axonal length per neuron (10 mm) + total dendritic length per neuron (4mm))\")\n\n\n### Total length and distribution of lengths from morphological data\n\n\nIn principle, obtaining estimates of average fiber lengths from a representative sample of different varieties of neuron should yield something close to the sum total fiber length for all brain neurons, when combined with information about the neuronal composition of the brain.\n\n\n#### Granule cells\n\n\nThe most numerous neuron type in the brain is the cerebellar granule cell, at around [50 billion](http://www.scholarpedia.org/article/Cerebellum) (58% of the brain’s total neurons). These small cells have three to five unbranched dendrites, each around 15 microns long and appended by a “claw”. They’re primarily distinguished by their unusual axonal morphology, which extends from the lowest of the three cerebellar cortex layers to the outermost layer, then splits perpendicularly into two fibers, forming a “T”. The fibers forming the top of this “T” run an average of 6 mm total, and while it was difficult to find a direct measurement for the other axonal component, the number is bounded by the thickness of the cerebellar cortex at [1176 microns](https://www.researchgate.net/figure/Comparative-analysis-of-cerebellar-cortex-thickness-m_fig1_6417166), and is probably much shorter on average. Overall, the fiber length of the average cerebellar granule cell is probably in the neighborhood of 6.6 mm, giving us around **330,000 km in total**.[2](https://aiimpacts.org/transmitting-fibers-in-the-brain-total-length-and-distribution-of-lengths/#easy-footnote-bottom-2-1118 \"50 billion cerebellar granule cells x (total parallel fiber length per neuron (6 mm) + other axonal component length per neuron (~0.6 mm) + total dendritic length per neuron (0.045 mm))\")\n\n\n#### Pyramidal cells\n\n\nThe next most numerous neuron type, at around [2/3rds](http://www.cell.com/current-biology/pdf/S0960-9822(11)01198-5.pdf) to [85%](https://link.springer.com/book/10.1007/978-3-662-03733-1) of the cerebral cortex (or 10.5-13.6 billion cells in humans), is the well-studied pyramidal cell. Pyramidal cells are in close contact with their neighbors in the vertical direction, forming tiny “[columns](https://en.wikipedia.org/wiki/Cortical_column)” along the cerebral cortex that are thought to have functional relevance, with relatively less connectivity between columns. This is reflected in the structure of the pyramidal cell’s dendritic tree, with a long fiber extending vertically from the cell body (the apical dendrite) and several relatively short fibers branching laterally (the basal dendrites). Some pyramidal cells have long, myelinated axons that connect the two hemispheres or different functional areas of the same hemisphere, and these axons will be considered in the next section on long fibers, but for now we will focus exclusively on more local connections. \n\n\nQuantitative descriptions of pyramidal cell morphology were lacking, so we collected data on 2130 human pyramidal neurons from the [NeuroMorpho.org](http://neuromorpho.org/) database, computing various metrics for each neuron using [L-Measure](http://cng.gmu.edu:8080/Lm/), and then performed our analysis with R ([data here](https://drive.google.com/file/d/1WCmXkUr0cBqV6aRIKryODQ5SLHFzWq9d/view?usp=sharing)). \n\n\nDendritic trees had an average total length of 3.4 mm per cell, with a standard deviation of 1.8 mm. We also analyzed path distance, or the length between the terminal point of one branch and the soma. The average path distance of pyramidal dendrites’ longest branch was 340 microns, which likely corresponds to the apical dendrites, while a typical branch was 180 microns. Axons were vastly less well represented in our dataset–only 243 had nonzero values, and while the mean length for these axons was in the same ballpark as the estimate found by Braitenberg and Schüz, at 11.5 mm, it’s probable that not all axons in the dataset were complete.[3](https://aiimpacts.org/transmitting-fibers-in-the-brain-total-length-and-distribution-of-lengths/#easy-footnote-bottom-3-1118 \"This data set was coded to specify the integrity of cell compartments (dendrites, soma, axon), and a very high proportion of axons were coded as incomplete. However, this coding was not reliable enough to filter the data effectively, so all non-zero axons were included in the first pass analysis.\") In particular, the length distribution was bimodal, with maxima around 100 microns and 20 mm, and this latter number may be the more accurate. This bimodal distribution was also reflected in the path distance of axonal branches, with (what we suspect to be) the more realistic values around 2.2 mm average for each neuron, and 4 mm for the longest branches. In all, pyramidal cells as measured here probably contribute roughly 23 mm each to the brain’s fiber network, or ~**240,000 to ~310,000 km**, in basic agreement with the numbers obtained from neocortical fiber density.[4](https://aiimpacts.org/transmitting-fibers-in-the-brain-total-length-and-distribution-of-lengths/#easy-footnote-bottom-4-1118 \"Number of pyramidal cells (10.5 to 13.6 billion) x (total dendritic length per neuron (~3 mm) + total axonal length per neuron (~20 mm))\")\n\n\n#### Other cell types\n\n\nThe remaining cell types made up a much smaller proportion of total fiber length. Besides pyramidal neurons, stellate cells are the other primary residents of the cerebrum, and are known to be substantially smaller than their cortical comrades, with axonal projections no longer than their dendrites. They could therefore add no more than 9,600-22,000 km to the total.[5](https://aiimpacts.org/transmitting-fibers-in-the-brain-total-length-and-distribution-of-lengths/#easy-footnote-bottom-5-1118 \"Number of stellate cells (2.4 to 5.5 billion) x (estimated total dendritic and axonal length per neuron (4mm))\") After the 50 billion granule cells, the cerebellum still has 13-20 billion neurons to account for, [over half of which are small stellate cells, a quarter basket cells, and the remainder split evenly between Purkinje cells and Golgi cells](http://www.scholarpedia.org/article/Cerebellum). Between them, these cerebral and cerebellar cells probably contribute **65,000 to 110,000 km**.[6](https://aiimpacts.org/transmitting-fibers-in-the-brain-total-length-and-distribution-of-lengths/#easy-footnote-bottom-6-1118 \"Total length of cerebellar stellate cells (8.5 to 13 billion cells x 4 mm) + total length of basket cells (3.25 billion to 5 billion cells x ~4 mm) + total length of Purkinje cells (0.6 to 1 billion cells x ~10 mm) + total length of Golgi cells (0.6 to 1 billion cells x ~4 mm) + total length of cerebral stellate cells (see previous footnote); Note that length estimations preceded by a tilde are a rough guess based on the size of the neuron. Because these cells were so few in number, a high degree of precision was not expected to improve our overall estimate very much.\")\n\n\nLong fibers\n-----------\n\n\n#### Myelination as indicative of fiber length\n\n\nThe most natural point of transition from “short range” to “long range” is the length of fiber for which conduction velocity of action potentials in a bare axon becomes unacceptably slow. Rather conveniently, this demarcation is evident from a glance at a cross section of the brain, where the white of myelinated fibers stands in stark contrast to the gray matter.\n\n\nFatty insulating sheaths of myelin are used by the brain’s longest fibers to increase conduction velocity at the cost of taking up more volume in the brain, as well as rendering myelinated segments of axons unable to synapse onto nearby neurons. Frequently, axons running through white matter tracts bundle with others inside a single myelin sheath, a frugal move for a brain with space and energy constraints. It’s unlikely that in these circumstances a brain would expend resources to myelinate short connections with no great need for it, so it’s reasonable to assume that all myelinated fibers are long. Furthermore, gray and white matter are [highly segregated](https://onlinelibrary.wiley.com/doi/abs/10.1002/cne.10714), and myelin is rarely found in cortical tissue.\n\n\n### Length of myelinated fibers from white matter volume\n\n\nThis protective myelin coating not only insulates axons from lost transmission, but also, unfortunately, from the prying eyes of scientists. This means that long distance connections are difficult to study, and there have been few attempts to characterize white matter fibers at an appropriate level of detail for our purposes.\n\n\nOne frequently cited figure comes from [Marner et al 2003](http://onlinelibrary.wiley.com/doi/10.1002/cne.10714/abstract), where the method called for divvying up preserved brains into slabs and take needle biopsies from random points on the slabs, then slicing these biopsies into fine sections and staining them. These could then be inspected for dark colored rings corresponding to myelin sheaths, and the total length of fibers could be approximated by multiplying “length density”, or total length of fibers per volume of white matter, with white matter volume. This method yielded a total of **149,000 km of myelinated fibers in female brains**, and **176,000 km in males**.\n\n\nAs for the distribution of these fiber lengths in the brain, we’re left somewhat in the dark. A very imprecise estimate for a portion of them can be gotten from a few key facts about the cerebrum. The largest and most famous white matter tract in the human brain is the corpus callosum, which connects the two hemispheres and contains 200-250 million fibers, [about as many](https://en.wikipedia.org/wiki/White_matter#White_matter) as one can find in tracts connecting areas within hemispheres. Given the width of the corpus callosum (~100 mm, or two thirds of the brain’s total width), a reasonable value for average fiber length in this tract is 10 cm, suggesting that perhaps **50,000 km** or less of long-range fiber connects the cerebrum with itself.[7](https://aiimpacts.org/transmitting-fibers-in-the-brain-total-length-and-distribution-of-lengths/#easy-footnote-bottom-7-1118 \"(250 million callosal fibers + 250 million intrahemispheric fibers) x axon length (~10 cm)\") Clearly, this leaves much white matter to be accounted for, which can presumably be attributed to connections within and between the cerebellum and subcortical structures, as well as the occasional cerebral white matter found outside the white matter tracts. \n\n\nThis vague picture can be supplemented by the relationship between long-range connection length and brain volume alluded to in [Wen and Chklovskii 2004](http://journals.plos.org/ploscompbiol/article?id=10.1371/journal.pcbi.0010078#pcbi-0010078-g002). These authors estimate that average global connection length should be roughly similar to the cube root of [brain volume](https://hypertextbook.com/facts/2001/ViktoriyaShchupak.shtml), or 10.6 cm – 11.4 cm, much like the figure we approximated above for intracortical connections.\n\n\nDiscussion\n----------\n\n\n### Summary of conclusions\n\n\nOur estimates are aggregated in the table below:\n\n\n\n\n\n| Connection type | Total length (km) | Average length per neuron (mm) | Contributing neuron types | Sources of evidence |\n| --- | --- | --- | --- | --- |\n| Cerebral, short-range | 220,000 - 320,000[9](https://aiimpacts.org/transmitting-fibers-in-the-brain-total-length-and-distribution-of-lengths/#easy-footnote-bottom-9-1118 \"Lower bound is from neocortical fiber density estimate; Upper bound is from pyramidal cells + cerebral stellate cells\") | 14 - 20 | Pyramidal (2/3rds to 85%), stellate | Fiber density in rats, morphometry |\n| Cerebellar, short-range | 390,000 - 420,000[8](https://aiimpacts.org/transmitting-fibers-in-the-brain-total-length-and-distribution-of-lengths/#easy-footnote-bottom-8-1118 \"Estimate is from cerebellar granule cells + the cerebellar portion of “other cell types”\") | 5.7 - 6.1 | Granule (~70%), stellate, basket, Purkinje, Golgi | Morphometry |\n| Total, short-range | 610,000 - 740,000 | - | - | - |\n| Cerebral, long-range | ~50,000 | 100 | Pyramidal | Width of corpus callosum, relationship between brain volume and global connection length |\n| Total, long-range | 150,000 - 180,000 | ? | ? | Length density per white matter volume |\n| Total, all fibers | 760,000 - 920,000 | - | - | - |\n\n\n\n\n\nOverall, we’re somewhat less confident in our total for long-range fiber length than our other estimates, since this was obtained using a methodology whose reliability we’re not able to judge, and its findings couldn’t be directly corroborated with other methods. However, there is indirect evidence that these numbers will hold up reasonably well: the proportion of total cerebral wiring that cerebral long-distance connections account for (14%) is quite similar to the proportion that long-distance connections purportedly account for overall (20%), despite the former number coming from independent lines of evidence.\n\n\n### Implications and future directions\n\n\nThe brain is the most metabolically expensive organ in the human body by volume, and has pushed the limits of natural birth by increasing the pelvic width of human females, via enlarged infant head sizes, to the edge of feasibility for walking. The massive resource requirements of the brain are clear, but the proportion demanded by communication (versus computation) is less clear.\n\n\nCosts to the brain can be expressed in terms of space, energy (for development, maintenance and operation), and the difficulty or error-proneness of orchestrating complex activities. Space may be the cost most strongly influenced by brain wiring, and can easily be predicted to translate to computers, but the amount brain wiring also contributes to energy costs. In computers, this will take the form of operation energy, or the power needed to send “action potentials” along connections.\n\n\nBy themselves, our estimates of fiber lengths in the brain won’t answer any questions about the difficulty of communication in computers broadly. However, they can be informative when considering a specific hardware architecture, and are likely to be especially so in the case of massively parallel architectures. Combining our estimates with other estimates relating to information transfer in the brain, like information density, may also yield insights relevant to AI hardware.\n\n\nContributions\n-------------\n\n\n*Research, analysis and writing were done by Tegan McCaslin. Katja Grace contributed feedback and editing. Paul Christiano proposed the question and provided guidance on hardware-related matters.*\n\n\nFootnotes\n---------\n\n", "url": "https://aiimpacts.org/transmitting-fibers-in-the-brain-total-length-and-distribution-of-lengths/", "title": "Transmitting fibers in the brain: Total length and distribution of lengths", "source": "aiimpacts.org", "source_type": "wordpress", "date_published": "2018-03-30T06:51:49+00:00", "paged_url": "https://aiimpacts.org/feed?paged=13", "authors": ["Tegan McCaslin"], "id": "3c2b0f035948fd7468d7316837dbe6a9", "summary": []} {"text": "Will AI see sudden progress?\n\n*By Katja Grace, 24 February 2018*\n\n\nWill advanced AI let some small group of people or AI systems take over the world?\n\n\nAI X-risk folks and others have accrued lots of arguments about this over the years, but I think this debate has been disappointing in terms of anyone changing anyone else’s mind, or much being resolved. I still have hopes for sorting this out though, and I thought a written summary of the evidence we have so far (which often seems to live in personal conversations) would be a good start, for me at least.\n\n\nTo that end, I started a [collection of reasons to expect discontinuous progress near the development of AGI](http://aiimpacts.org/likelihood-of-discontinuous-progress-around-the-development-of-agi/).\n\n\nI do think the world could be taken over without a step change in anything, but it seems less likely, and we can talk about the arguments around that another time.\n\n\nPaul Christiano had basically the same idea at the same time, so for a slightly different take, [here](https://sideways-view.com/2018/02/24/takeoff-speeds/) is his account of reasons to expect slow or fast take-off.\n\n\nPlease tell us in the comments or [feedback box](https://aiimpacts.org/feedback/) if your favorite argument for AI Foom is missing, or isn’t represented well. Or if you want to represent it well yourself in the form of a short essay, and send it to me [here](mailto:katja@intelligence.org), and we will gladly consider posting it as a guest blog post.\n\n\nI’m also pretty curious to hear which arguments people actually find compelling, even if they are already listed. I don’t actually find any of the ones I have that compelling yet, and I think a lot of people who have thought about it do expect ‘local takeoff’ with at least substantial probability, so I am probably missing things.\n\n", "url": "https://aiimpacts.org/will-ai-see-sudden-progress/", "title": "Will AI see sudden progress?", "source": "aiimpacts.org", "source_type": "wordpress", "date_published": "2018-02-25T05:07:23+00:00", "paged_url": "https://aiimpacts.org/feed?paged=13", "authors": ["Katja Grace"], "id": "a0649efbab49127c39063b72b70f1a54", "summary": []} {"text": "Likelihood of discontinuous progress around the development of AGI\n\nWe aren’t convinced by any of the arguments we’ve seen to expect large discontinuity in AI progress above the extremely low base rate for all technologies. However this topic is controversial, and many thinkers on the topic disagree with us, so we consider this an open question.\n\n\nDetails\n-------\n\n\n### Definitions\n\n\nWe say a technological discontinuity has occurred when a particular technological advance pushes some progress metric substantially above what would be expected based on extrapolating past progress. We measure the size of a discontinuity in terms of how many years of past progress would have been needed to produce the same improvement. We use judgment to decide how to extrapolate past progress.\n\n\nFor instance, in the following trend of progress in chess AI performance, we would say that there was a discontinuity in 2007, and it represented a bit over five years of progress at previous rates.\n\n\n[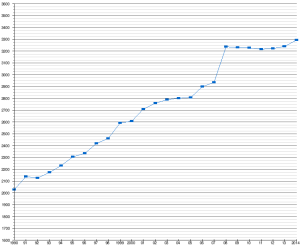](http://aiimpacts.org/wp-content/uploads/2014/12/SSDF-progress.png)Figure 1: Machine chess progress, in particular SSDF records.\n### Relevance\n\n\nDiscontinuity by some measure, on the path to AGI, lends itself to:\n\n\n* A party gaining decisive strategic advantage\n* A single important ‘deployment’ event\n* Other very sudden and surprising events\n\n\nArguably, the first two require some large discontinuity. Thus the importance of planning for those outcomes rests on the likelihood of a discontinuity.\n\n\n### Outline\n\n\nWe investigate this topic in two parts. First, with no particular knowledge of AGI as a technology, how likely should we expect a particular discontinuity to be? We take the answer to be quite low. Second, we review arguments that AGI is different from other technologies, and lends itself to discontinuity. We currently find these arguments uncompelling, but not decisively so.\n\n\n### Default chance of large technological discontinuity\n\n\nDiscontinuities larger than around ten years of past progress in one advance seem to be rare in technological progress on natural and desirable metrics.[1](https://aiimpacts.org/likelihood-of-discontinuous-progress-around-the-development-of-agi/#easy-footnote-bottom-1-1086 \"We expect discontinuities can be found in the following areas, but these do not seem interesting:
\n- \n
- convoluted metrics designed to capture discontinuities, and not likely to be considered a natural measure of success \n
- metrics that with additional details that aren’t necessarily desirable, e.g. we expect ‘Xootr scooter miles/$’ to be more discontinuous than ‘scooter miles/$’, and for that to be more discontinuous than ‘transport miles/$’. Similarly, the day an update to OSX is launched, the number of users of that particular operating system presumably grows rapidly, but the number of users of operating systems does not, and nor does any natural operating system performance metric that we know of. \n
- metrics that nobody is trying to perform well on e.g. number of eight-foot tall unicorns made of marshmallow might undergo a sudden increase if some particular rich person becomes interested. This is uninteresting to us in part because it doesn’t represent a change in the underlying technology, and in part because by its nature if anybody cared how many such unicorns there were the metric wouldn’t have been discontinuous. \n
“Cloud TPUs are available in limited quantities today and usage is billed by the second at the rate of $6.50 USD / Cloud TPU / hour.”
\nGoogle Cloud Platform Blog, https://cloudplatform.googleblog.com/2018/02/Cloud-TPU-machine-learning-accelerators-now-available-in-beta.html [Accessed Feb 13 2018]\") This gives us $171,000 to rent one TPU continually for a roughly three year lifecycle[2](https://aiimpacts.org/2018-price-of-performance-by-tensor-processing-units/#easy-footnote-bottom-2-1092 \"We do not know the lifecycle of TPUs, but usually assume a lifecycle of three years for converting per hour and per computer prices for computing hardware.\") Which is 1.05 GFLOPS/$.\n\n\nThis service apparently began on February 12 2018.[3](https://aiimpacts.org/2018-price-of-performance-by-tensor-processing-units/#easy-footnote-bottom-3-1092 \"“Starting today, Cloud TPUs are available in beta on Google Cloud Platform (GCP) to help machine learning (ML) experts train and run their ML models more quickly.”
\nGoogle Cloud Platform Blog, https://cloudplatform.googleblog.com/2018/02/Cloud-TPU-machine-learning-accelerators-now-available-in-beta.html [Dated Feb 12 2018, Accessed Feb 13 2018]\") So this does not appear to be competitive with the cheapest GPUs, in terms of FLOPS/$, or even the cheapest cloud computing.\n\n", "url": "https://aiimpacts.org/2018-price-of-performance-by-tensor-processing-units/", "title": "2018 price of performance by Tensor Processing Units", "source": "aiimpacts.org", "source_type": "wordpress", "date_published": "2018-02-13T23:55:29+00:00", "paged_url": "https://aiimpacts.org/feed?paged=14", "authors": ["Katja Grace"], "id": "b701af858e9abcb8186f7d771de017dc", "summary": []} {"text": "Examples of AI systems producing unconventional solutions\n\nThis page lists examples of AI systems producing solutions of an unexpected nature, whether due to goal misspecification or successful optimization. This list is highly incomplete.\n\n\nList\n----\n\n\n1. [CoastRunners’ burning boat](https://blog.openai.com/faulty-reward-functions/)\n2. [Incomprehensible evolved logic gates](https://www.damninteresting.com/on-the-origin-of-circuits/)\n3. [AlphaGo’s inhuman moves](https://en.wikipedia.org/wiki/AlphaGo_versus_Lee_Sedol)\n4. [Waze direction into fires](https://www.usatoday.com/story/tech/news/2017/12/07/california-fires-navigation-apps-like-waze-sent-commuters-into-flames-drivers/930904001/)\n", "url": "https://aiimpacts.org/examples-of-ai-systems-producing-unconventional-solutions/", "title": "Examples of AI systems producing unconventional solutions", "source": "aiimpacts.org", "source_type": "wordpress", "date_published": "2018-02-12T03:58:01+00:00", "paged_url": "https://aiimpacts.org/feed?paged=14", "authors": ["Katja Grace"], "id": "fb0487d11b9c66ac7ab0340b7c478e2b", "summary": []} {"text": "Historic trends in altitude\n\n*Published 7 Feb 2020*\n\n\nAltitude of objects attained by man-made means has seen six discontinuities of more than ten years of progress at previous rates since 1783, shown below.\n\n\n\n\n| | | | |\n| --- | --- | --- | --- |\n| **Year** | **Height (m)** | **Discontinuity (years)** | **Entity** |\n| 1784 | 4000 | 1032 | Balloon |\n| 1803 | 7280 | 1693 | Balloon |\n| 1918 | 42,300 | 227 | [Paris gun](https://en.wikipedia.org/wiki/Paris_Gun) |\n| 1942 | 85,000 | 120 | [V-2 Rocket](https://en.wikipedia.org/wiki/List_of_V-2_test_launches) |\n| 1944 | 174,600 | 11 | [V-2 Rocket](https://en.wikipedia.org/wiki/List_of_V-2_test_launches) |\n| 1957 | 864,000,000 | 35 | Pellets (after one day) |\n\n\n\nDetails\n-------\n\n\nThis case study is part of AI Impacts’ [discontinuous progress investigation](https://aiimpacts.org/discontinuous-progress-investigation/).\n\n\n### Trends\n\n\n#### Altitude of objects attained by manmade means\n\n\nWe looked for records in height from the ground reached by any object via man-made technology. \n\n\n‘Man-made technology’ is ambiguous, but we exclude for instance objects tied to birds and debris carried up by hurricanes. We include debris launched unintentionally via gunpowder explosion, and rocks launched via human arms. \n\n\nWe measure ‘altitude’ from the ground at the launch site. This excludes mountain climbing, but also early flight attempts that involve jumping from towers and traveling downward slowly.[1](https://aiimpacts.org/discontinuity-in-altitude-records/#easy-footnote-bottom-1-1087 \"For instance Hezârfen Ahmed Çelebi was reported to travel over 3km while losing 77m of altitude between a tower and a square in 1632.
\n\n\n\nSee ‘site details’, “Hezârfen Ahmed Çelebi.” In Wikipedia, September 25, 2019. https://en.wikipedia.org/w/index.php?title=Hez%C3%A2rfen_Ahmed_%C3%87elebi&oldid=917757610.\") It also excludes early parachutes, which were mentioned in fiction thousands of years ago.[2](https://aiimpacts.org/discontinuity-in-altitude-records/#easy-footnote-bottom-2-1087 \"“The earliest fictional account of a parachute type of device was made some 4,000 years ago when the Chinese noticed that air resistance would slow a person’s fall from a height.”
“Parachute.” In Wikipedia, November 21, 2019. https://en.wikipedia.org/w/index.php?title=Parachute&oldid=927299715.\") \n\n\nMeasured finely enough, there are never discontinuities in altitude, since objects travel continuously.[3](https://aiimpacts.org/discontinuity-in-altitude-records/#easy-footnote-bottom-3-1087 \"As an object passes a previous record, first it is equal to it, then it moves continually past and onwards.\") This prohibits finding discontinuities in continuously measured altitude, but doesn’t interfere with the dataset being relevant evidence to us. We are interested in discontinuities because they tell us about how much surprising progress can happen in a short time, and how much progress can come from a single innovation. So to make use of this data, we need to find alternate ways of measuring it that fulfill these purposes. \n\n\nFor the purpose of knowing about progress in short periods, we can choose a short period of interest, and measure jumps in progress made at that scale. For the purpose of knowing about progress made by single innovations, we can assign the maximum altitude reached to the time that the relevant innovation was made, for instance.[4](https://aiimpacts.org/discontinuity-in-altitude-records/#easy-footnote-bottom-4-1087 \"In many trends, if the full benefits of an innovation are not manifest until later, it is hard to connect it to that innovation, since further innovations are made, and contribute to ongoing progress. However with altitude, once an object is flying away from the Earth, further innovation in rocket design on Earth will not affect it, so we can measure this.\") \n\n\nWe could measure both of these trends, but currently only measure a version of the former. For short periods of travel, we assign the maximum altitude reached to the date given (our understanding is that most of the entries took place over less than one day). For travel that appears to have taken more than a day, we record any altitudes we have particular information about, and otherwise estimate records on roughly an annual basis, including a record for the peak altitude (and possibly more than a year apart to allow for the final record to have the maximum altitude). This is ad hoc, but for the current purpose, converting what we have to a more consistent standard does not seem worth it. Instead, we consider these the effects of these choices when measuring discontinuities. They do not appear to matter, except to make modest differences to the size of the pellet discontinuity, discussed below (section, ‘Discontinuity measurement’). \n\n\n##### Data\n\n\nWe collected data from various sources, and added them to [this spreadsheet](https://docs.google.com/spreadsheets/d/1YDhaYQNNEGyBqpQGTd1D8vG1W8WCc6DXZtb8jYn2Gho/edit?usp=sharing), tab ‘Manned and unmanned’. This data is shown in Figures 1-3 below. We have not thoroughly verified this data. \n\n\nRecord altitudes might plausibly be reached by a diversity of objects for a diversity of purposes, so collecting such data is especially dependent on imagination for the landscape of these.[5](https://aiimpacts.org/discontinuity-in-altitude-records/#easy-footnote-bottom-5-1087 \"For instance, the earliest objects we found that probably traveled as far away as the sun were small pellets fired into the sky for this purpose, which we did not immediately think to search for, and might easily have missed if we had only considered space probes\") For this reason, this data is especially likely to be incomplete. \n\n\nWe also intentionally left the data less complete than usual in places where completeness seemed costly and unlikely to affect conclusions about discontinuities. The following section discusses our collection of data for different periods in history and details of our reasoning about it.\n\n\n###### Detailed overview of data\n\n\nHere we describe the history of progress in altitude reached and the nature of the data we collected during different times. See [the spreadsheet](https://docs.google.com/spreadsheets/d/1YDhaYQNNEGyBqpQGTd1D8vG1W8WCc6DXZtb8jYn2Gho/edit#gid=0) for all uncited sources.\n\n\nChimps throw rocks, so we infer that humans have probably also done this from the beginning.[6](https://aiimpacts.org/discontinuity-in-altitude-records/#easy-footnote-bottom-6-1087 \"“Recent research demonstrates that the bonds of kinship will not keep a chimp from piling up stones and hurling them at zoo visitors if they get too close. A new study of wild chimps at four sites in West Africa now shows that they also like to throw stones at trees.”
BalterFeb. 29, Michael, 2016, and 5:00 Am. “Why Do Some Chimps Throw Rocks at Trees?” Science | AAAS, February 26, 2016. https://www.sciencemag.org/news/2016/02/why-do-some-chimps-throw-rocks-trees.\") A good rock throw can apparently reach around 25m. Between then and the late 1700s, humanity developed archery, sky lanterns, kites, gunpowder, other projectile weapons, rockets, and primitive wings[7](https://aiimpacts.org/discontinuity-in-altitude-records/#easy-footnote-bottom-7-1087 \"See examples of early flying attempts here and here\"), among probably other things. However records before the late 1700s are hard or impossible to find, so we do not begin the search for discontinuities until a slew of hot air balloon records beginning in 1783s. We collected some earlier records in order to have a rough trend to compare later advances to, but we are likely missing many entries, and the entries we have are quite uncertain. (It is more important to have relatively complete data for measuring discontinuities than it is for estimating a trend.) \n\n\nThe highest altitude probably attained before the late 1700s that we know of was reached by debris in a large gunpowder building explosion in 1280, which we estimate traveled around 2.5km into the air. Whether to treat this as a ‘man-made technology’ is ambiguous, given that it was not intentional, but we choose to ignore intention.[8](https://aiimpacts.org/discontinuity-in-altitude-records/#easy-footnote-bottom-8-1087 \"If we did not want to include unintentional object launches, this explosion does still suggest that intentionally launching debris that far using gunpowder was possible at the time, though it is unclear to us whether it was possible to do in a more controlled fashion, such that it might have been useful to anyone, and therefore for this possibility to imply much about what happened.\")\nKites may also have traveled quite high, quite early. It appears that they have been around for at least two thousand years.[9](https://aiimpacts.org/discontinuity-in-altitude-records/#easy-footnote-bottom-9-1087 \"Stephanie Hall discusses some evidence that they were around by 1200 BC, here.\") and were used [in ancient warfare](https://en.wikipedia.org/wiki/Kite#Military_applications) and even occasionally for [lifting people](https://en.wikipedia.org/wiki/Man-lifting_kite). We find it hard to rule out the possibility that early kites could travel one or two thousand meters into the air: modern kites frequently fly at 2km altitudes, silk has been available for thousands of years, and modern silk at least appears to be about as strong as nylon.[10](https://aiimpacts.org/discontinuity-in-altitude-records/#easy-footnote-bottom-10-1087 \"See spreadsheet for more detailed reasoning as well as citations.\") Thus if we are wrong about the gunpowder factory explosion, it is still plausible that two thousand meter altitudes were achieved by kites. \n\n\nOver a period of three and a half months from August 1783, manned hot air balloons were invented,[11](https://aiimpacts.org/discontinuity-in-altitude-records/#easy-footnote-bottom-11-1087 \"Though unmanned hot air propelled vessels are older: sky lanterns appear to have existed for thousands of years, and we saw one claim that hot-air aerostats existed in the 9th Century (which may just mean more sky lanterns, except that that wouldn’t make sense in context because sky lanterns are older.) ‘…the Middle Ages from the ninth century at least were familiar with hot-air aerostats used as military signals’
\n\n\n\nWhite, Lynn. “Eilmer of Malmesbury, an Eleventh Century Aviator: A Case Study of Technological Innovation, Its Context and Tradition.” Technology and Culture 2, no. 2 (1961): 97–111. https://doi.org/10.2307/3101411. p98\") and taken from an initial maximum altitude of 24m up to a maximum altitude of 2700m. While this was important progress in manned travel[12](https://aiimpacts.org/discontinuity-in-altitude-records/#easy-footnote-bottom-12-1087 \"Though perhaps in the convenience, reliability and safety of it before the height of it—Marco Polo describes observing a man-carrying kite that ‘might go up until it may no longer be seen’ by 1295.
\n\n\n\nTranslation from Latin, found in only two manuscripts of Marco Polo’s work, but considered likely to be genuine: “The men of the ship will have wicker framework, that is a grate of switches, and to each corner and side of that framework will be tied a cord, so that there are eight cords and all of these are tied at the other end to a long rope. Next they will find some fool or drunkard and lash him to the frame, since no one in his right mind or with his wits about him would expose himself to that peril. This is done when the wind is high, then they raise the framework into the teeth of the wind and the wind lifts up the framework and carries it aloft, and the men hold it by the long rope. If the kite tips the men on the ground haul on the rope to straighten it, then pay the rope out again so by this means it might go up until it could no longer be seen, if only the rope were long enough.”
\n\n\n\nTaken from the first of these, but a very similar translation available at the second:
\n\n\n\nBeachcombing’s Bizarre History Blog. “Manned Kite Flight in Medieval China,” May 12, 2011. http://www.strangehistory.net/2011/05/13/manned-kite-flight-in-medieval-china/.
\n\n\n\nWhite, Lynn. “Eilmer of Malmesbury, an Eleventh Century Aviator: A Case Study of Technological Innovation, Its Context and Tradition.” Technology and Culture 2, no. 2 (1961): 97–111. https://doi.org/10.2307/3101411.\"), most of these hot air balloons were still lower than the gunpowder explosion and perhaps kites. Nonetheless, there are enough records from around this time, that we begin our search for discontinuities here.\n\n\nThe first time that humanity sent any object clearly higher than ancient kites or explosion debris was December 1783, when the first hydrogen balloon flight ascended to 2,700m. This was not much more than we (very roughly) estimate that those earlier objects traveled. However the hot air balloon trend continued its steep incline, and in 1784 a balloon reached 4000m, which is over a thousand years of discontinuity given our estimates (if we estimated the rate of progress as an order of magnitude higher or lower, the discontinuity would remain large, so the uncertainties involved are not critical.) \n\n\nThe next hot air balloon that we have records for ascended nearly twice as high—7280m—in 1803, representing another over a thousand years of discontinuity. We did not thoroughly search for records between these times. However if that progress actually accrued incrementally over the twenty years between these records, then still every year would have seen an extra 85 years of progress at the previous rate, so there must have been at least one year that saw at least that much progress, and it seems likely that in fact at least one year saw over a hundred years of progress. Thus there was very likely a large discontinuity at that time, regardless of the trend between 1784 and 1803.\n\n\nWe collected all entries from Wikipedia’s [Flight altitude record](https://en.wikipedia.org/wiki/Flight_altitude_record) page, which claims to cover ‘highest aeronautical flights conducted in the atmosphere, set since the age of ballooning’.[13](https://aiimpacts.org/discontinuity-in-altitude-records/#easy-footnote-bottom-13-1087 \"Such records were previously found to contain numerous discrepancies with different sources, so it seems likely that there are still some errors, however the known past errors were within ten percent, so this seems unlikely to be an important issue. See examples of discrepancies at “Talk:Flight Altitude Record.” In Wikipedia, February 28, 2018. https://en.wikipedia.org/w/index.php?title=Talk:Flight_altitude_record&oldid=828133827.\") It is not entirely clear to us what ‘aeronautical flights’ covers, but seemingly at least hot air balloons and planes. The list includes some unmanned balloons, but it isn’t clear whether they are claiming to cover all of them. They also include two cannon projectiles, but not [38 cm SK L/45 “Max”](https://en.wikipedia.org/wiki/38_cm_SK_L/45_%22Max%22), which appears to be a record relative to anything they have, and cannon projectiles are probably not ‘flights’, so we think they are not claiming to have exhaustively covered those. Thus between the late 1700s, and the first flights beyond the atmosphere, the main things this data seems likely to be missing is military projectiles, and any other non-flight atmospheric-level objects. \n\n\nWe searched separately for military projectiles during this period. Wikipedia claims, without citation, that the 1918 Paris gun represented the greatest height reached by a human-made projectile until the first successful V-2 flight test in October 1942[14](https://aiimpacts.org/discontinuity-in-altitude-records/#easy-footnote-bottom-14-1087 \"“The gun was capable of firing a 106-kilogram (234 lb)[1]:120 shell to a range of 130 kilometers (81 mi) and a maximum altitude of 42.3 kilometers (26.3 mi)[1]:120—the greatest height reached by a human-made projectile until the first successful V-2 flight test in October 1942.”“Paris Gun.” In Wikipedia, August 19, 2019. https://en.wikipedia.org/w/index.php?title=Paris_Gun&oldid=911481367. \"), which matches what we could find. We searched for military records prior to the Paris gun, and found only one other, “Max” mentioned above, a 38cm German naval gun from 1914. \n\n\nWe expect there are no much higher military records we are missing during this time but that we could easily have missed some similar ones. As shown in Figure 1, the trend of military records we are aware of is fairly linear, and that line is substantially below the balloon record trend until around 1900. So it would be surprising if there were earlier military records that beat balloon records, and less surprising if we were missing something between 1900 and 1918. It seems unlikely however that we could have missed enough data that the Paris Gun did not represent at least a moderate discontinuity.[15](https://aiimpacts.org/discontinuity-in-altitude-records/#easy-footnote-bottom-15-1087 \"The Paris Gun was a 227 year discontinuity according to our calculations below, so had there been incremental progress over the four years since the previous record (assuming that was the same), each year would still have seen over fifty years of surprising progress (at least ignoring readjustment of expectations after seeing this twice in a row). Nonetheless, it is possible that there was enough incremental progress between 1893 and 1918 that we did not find that the Paris Gun is not a substantial discontinuity. It seems fairly unlikely to us that we would not have found any of it.\")\nWe could not think of other types of objects that might have gone higher than aeronautical flights and military projectiles between the record 1803 balloon and V-2 rockets reaching ‘the edge of space’ from 1942. Thus the data in this period seems likely to be relatively complete, or primarily missing less important military projectiles.\n\n\nThe German V-2 rockets are considered the first man-made objects to travel to space (though the modern definition of space is higher)[16](https://aiimpacts.org/discontinuity-in-altitude-records/#easy-footnote-bottom-16-1087 \"“The V-2 rocket also became the first man-made object to travel into space by crossing the Kármán line with the vertical launch of MW 18014 on 20 June 1944.[5]“
\n\n\n\n“V-2 Rocket.” In Wikipedia, November 15, 2019. https://en.wikipedia.org/w/index.php?title=V-2_rocket&oldid=926267063. \") so they are presumably the highest thing at that time (1942). They are also considered the first projectile record since the Paris gun, supporting this. Wikipedia has an extensive [list of V-2 test launches](https://en.wikipedia.org/wiki/List_of_V-2_test_launches) and their outcomes, from which we infer than three of them represent altitude records.[17](https://aiimpacts.org/discontinuity-in-altitude-records/#easy-footnote-bottom-17-1087 \"A fairly early one was fired undesirably steeply, and so became the first rocket to reach space, as defined at the time. Thus it is less surprising that so few were records.\")\nThe two gun records we know of were both German WWI guns, and the V2 rockets that followed were German WWII weapons, apparently developed in an attempt to replace the Paris Gun when it was banned under the Versailles Treaty.[18](https://aiimpacts.org/discontinuity-in-altitude-records/#easy-footnote-bottom-18-1087 \"“In the 1930s, the German Army became interested in rockets for long-range artillery as a replacement for the Paris Gun—which was specifically banned under the Versailles Treaty. This work would eventually led to the V-2 rocket that was used in World War II.” – “Paris Gun.” In Wikipedia, August 19, 2019. https://en.wikipedia.org/w/index.php?title=Paris_Gun&oldid=911481367. \") So all altitude records between the balloons of the 1800s and the space rockets of the 50s appear to be German military efforts.\n\n\nBetween the last record V-2 rocket in 1946 and 1957, we found a series of rockets that traveled to increasing altitudes. We are not confident that there were no other record rocket altitudes in this time. However the rockets we know of appear to have been important ones, so it seems unlikely that other rockets at the time were radically more powerful, and there does not appear to have been surprising progress over that entire period considered together, so there could not have been much surprising progress in any particular year of it, unless the final record should be substantially higher than we think. We are quite unsure about the final record (the R-7 Semyorka), however it doesn’t seem as though it could have gone higher than 3000km, which would only add a further four years of surprising progress to be distributed in the period. \n\n\nIn October 1957, at least one centimeter-sized pellet was apparently launched into solar orbit, using shaped charges and a rocket. As far as we know, this was the first time an object escaped Earth’s gravity to orbit the sun.[19](https://aiimpacts.org/discontinuity-in-altitude-records/#easy-footnote-bottom-19-1087 \"For instance, Fritz Zwicky, the scientist responsible, writes in an article called, “The first shots into interplanetary space”, that “Small man-made projectiles were launched away from the earth for the first time, never to return.” We think he means that this was the first time anything was launched away from the Earth, never to return, rather than just the record for ‘shots’ or ‘small man-made projectiles’.
\n\n\n\nZwicky, Fritz. “The First Shots Into Interplanetary Space.” Engineering and Science 21 (January 1, 1958): 20–23. \") This episode does not appear to be mentioned often, but we haven’t found anyone disputing its being the first time a man-made object entered solar orbit, or offering an alternate object. \n\n\nBecause the pellets launched were just pellets, with no sophisticated monitoring equipment, it is harder to know what orbit they ended up in, and therefore exactly how long it took to reach their furthest distance from Earth, or what it was. Based on their speed and direction, we estimate they should still have been moving at around 10km/s as they escaped Earth’s gravity. Within a day we estimate that they should have traveled more than six hundred times further away than anything earlier that we know of. Then conservatively they should have reached the other side of the sun, at a distance from it comparable to that of Earth, in around 1.5 years. However this is all quite uncertain.\n\n\nAt around this time, reaching maximum altitudes goes from taking on the order of days to on the order of years. As discussed at the start of section ‘Altitude of objects attained by manmade means’ above, from here on we record new altitudes every year or so for objects traveling at increasing altitudes over more than a year. \n\n\nIn the years between 1959 and 1973, various objects entered heliocentric orbit.[20](https://aiimpacts.org/discontinuity-in-altitude-records/#easy-footnote-bottom-20-1087 \"Wikipedia lists them.
\n\n\n\n\n “List of Artificial Objects in Heliocentric Orbit.” In Wikipedia, November 21, 2019. https://en.wikipedia.org/w/index.php?title=List_of_artificial_objects_in_heliocentric_orbit&oldid=927304642.\n \n
\n\n\n\n\") It is possible that some of them reached greater altitudes than the pellets, via being in different orbits around the sun. Calculating records here is difficult, because reaching maximal distance from Earth takes years,[21](https://aiimpacts.org/discontinuity-in-altitude-records/#easy-footnote-bottom-21-1087 \"For instance, we roughly estimate that Luna 1 took five years to reach its maximum distance from Earth.\") and how far an object is from Earth at any time depends on how their (eccentric) orbits relate to Earth’s, in 3D space. Often, the relevant information isn’t available. \n\n\nAmong artificial objects in heliocentric orbit listed by Wikipedia[22](https://aiimpacts.org/discontinuity-in-altitude-records/#easy-footnote-bottom-22-1087 \"Though known to not be complete: “This list does not include objects that are escaping from the Solar System, upper stages from robotic missions (only the S-IVB upper stages from Apollo missions with astronauts are listed), or objects in the Sun–Earth Lagrange points.”“List of Artificial Objects in Heliocentric Orbit.” In Wikipedia, November 21, 2019. https://en.wikipedia.org/w/index.php?title=List_of_artificial_objects_in_heliocentric_orbit&oldid=927304642. \") none are listed as having orbits where they travel more than 1.6 times further from the Sun than Earth does[23](https://aiimpacts.org/discontinuity-in-altitude-records/#easy-footnote-bottom-23-1087 \"Zond 3 was the furthest we found.\"), though many are missing such data. This is probably less far than the pellets, though further away than our conservative estimate for the pellets. For an object to reach this maximal distance from the Earth, it would need to be at this furthest part of its orbit, while being on the opposite side of the Sun from Earth, on the same plane as Earth. \n\n\nGiven all of this, it seems implausible that anything went ten times as far from the Sun as Earth by 1960, but even this would not have represented a discontinuity of even ten years. Given this and the difficulty of calculating records, we haven’t investigated this period of solar orbiters thoroughly. \n\n\nIn 1973 Pioneer 10 became the first of five space probes to begin a journey outside the solar system. In 1998 it was overtaken by Voyager 1. We know that no other probes were the furthest object during that time, however have not checked whether various other objects exiting the solar system (largely [stages of multi-stage rockets that launched the aforementioned probes](https://en.wikipedia.org/wiki/List_of_artificial_objects_leaving_the_Solar_System#Propulsion_stages)) might have gone further. \n\n\nFigure 1 shows all of the altitude data we collected, including entries that turned out not to be records. Figures 2 and 3 show the best current altitude record over time. \n\n\n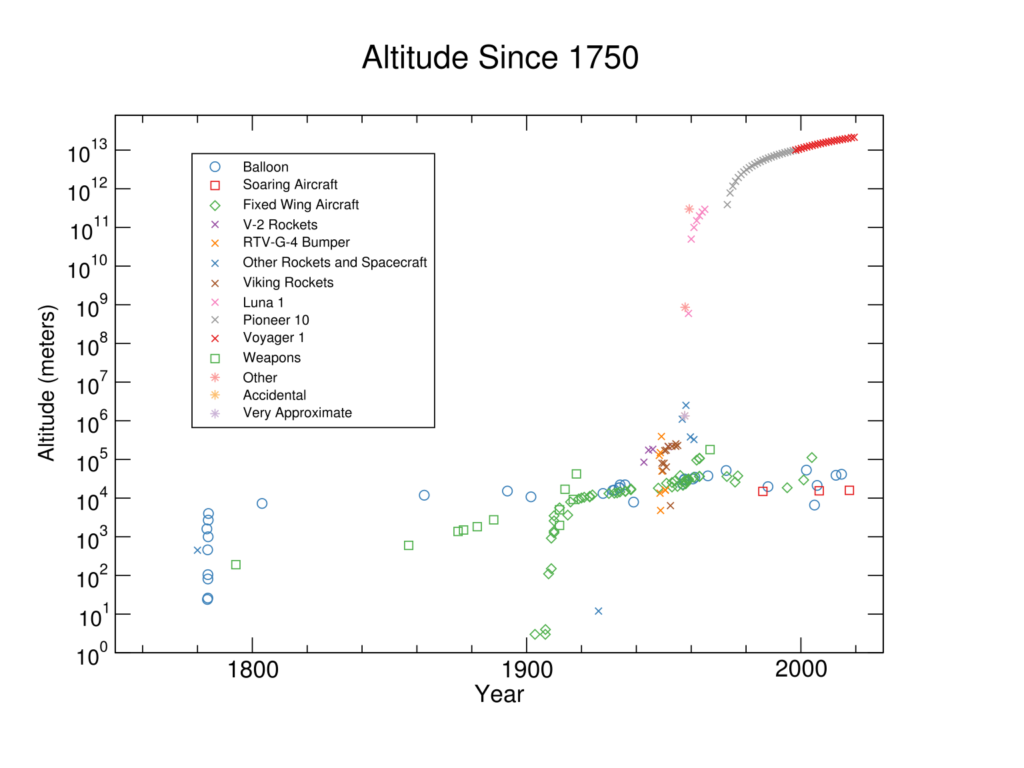 Figure 1: Post-1750 altitudes of various objects, including many non-records. Whether we collected data for non-records is inconsistent, so this is not a complete picture of progress within object types. It should however contain most aircraft and balloon records since 1783. See image in detail [here](http://aiimpacts.org/wp-content/uploads/2018/02/Altitudes-since-1750-3.png). \n[To see detail:](http://aiimpacts.org/wp-content/uploads/2018/02/Altitudes-since-1750-3.png)[Download](http://aiimpacts.org/wp-content/uploads/2018/02/Altitudes-since-1750-3.png)\n\nFigure 2: record altitudes known to us since 1750\n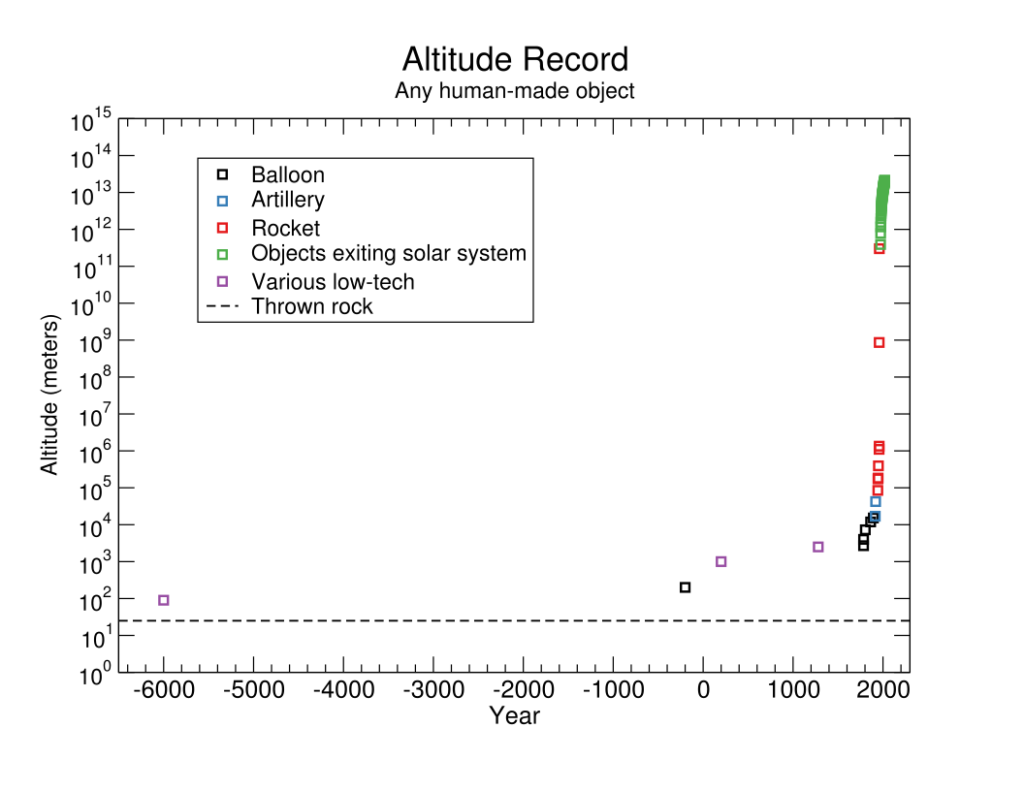Figure 3: Record altitudes known to us since 6000 BC (early ones estimated imprecisely)\n##### **Discontinuity measurement**\n\n\nFor measuring discontinuities, we treat the past trend at a given point as linear or exponential and as starting from earlier or later dates depending on what fits well at that time.[24](https://aiimpacts.org/discontinuity-in-altitude-records/#easy-footnote-bottom-24-1087 \"See our methodology page for more details. The trends are colored differently in column D of ‘calculations’ tab in the spreadsheet.\") Relative to these previous rates, this altitude trend contains six discontinuities of greater than ten years, with four of them being greater than 100 years:[25](https://aiimpacts.org/discontinuity-in-altitude-records/#easy-footnote-bottom-25-1087 \"See our methodology page for more details, and our spreadsheet, tab ‘Calculations’ for the calculation.\")\n\n\n| | | | |\n| --- | --- | --- | --- |\n| **Year** | **Height (m)** | **Discontinuity (years)** | **Entity** |\n| 1784 | 4000 | 1032 | Balloon |\n| 1803 | 7280 | 1693 | Balloon |\n| 1918 | 42,300 | 227 | [Paris gun](https://en.wikipedia.org/wiki/Paris_Gun) |\n| 1942 | 85,000 | 120 | [V-2 Rocket](https://en.wikipedia.org/wiki/List_of_V-2_test_launches) |\n| 1944 | 174,600 | 11 | [V-2 Rocket](https://en.wikipedia.org/wiki/List_of_V-2_test_launches) |\n| 1957 | 864,000,000 | 35 | Pellets (after one day) |\n\n\nThe 1957 pellets would be a 66 year discontinuity if we counted all of their ultimate estimated altitude as one jump on the day after their launch, so exactly how one decides to treat altitudes that grow over years is unlikely to prevent these pellets representing a discontinuity of between ten and a hundred years.\n\n\nIn addition to the size of these discontinuities in years, we have tabulated a number of other potentially relevant metrics **[here](https://docs.google.com/spreadsheets/d/1iMIZ57Ka9-ZYednnGeonC-NqwGC7dKiHN9S-TAxfVdQ/edit?usp=sharing)**.[26](https://aiimpacts.org/discontinuity-in-altitude-records/#easy-footnote-bottom-26-1087 \"See our methodology page for more details.\")\n\n*Primary authors: Katja Grace, Rick Korzekwa*\n\n\n*Thanks to Stephen Jordan and others for suggesting a potential discontinuity in altitude records.*\n\n\nNotes\n-----\n\n\n\n\n\n\n\n\n\n\n\n", "url": "https://aiimpacts.org/discontinuity-in-altitude-records/", "title": "Historic trends in altitude", "source": "aiimpacts.org", "source_type": "wordpress", "date_published": "2018-02-10T03:47:39+00:00", "paged_url": "https://aiimpacts.org/feed?paged=14", "authors": ["Katja Grace"], "id": "0f3c985b9d84905320cb2b2e4a98b900", "summary": []} {"text": "2015 FLOPS prices\n\nIn April 2015, the lowest GFLOPS prices we could find were approximately $3/GFLOPS. However recent records of hardware performance from 2015 and earlier imply substantially lower prices, suggesting that something confusing has happened with these sources of data. We have not resolved this.\n\n\nRecent data\n-----------\n\n\nWe have not finished exploring the apparent discrepancies between 2015 prices for performance and current records of 2015 prices for performance. However in the data described in our [2017 assessment](http://aiimpacts.org/recent-trend-in-the-cost-of-computing/) of recent price trends (key figure [here](http://aiimpacts.org/wp-content/uploads/2017/10/chart-43.png)), prices appear to have been below $1 since 2008.[1](https://aiimpacts.org/2015-flops-prices/#easy-footnote-bottom-1-1035 \"Other examples of apparently very cheap hardware from 2015 or earlier can be seen at the bottom of the sheet called ‘Oct 2017 Update – misc – incomplete, misleading’ in this spreadsheet.\") The measurements are not entirely comparable, but we would not expect the differences to produce such a large price difference.\n\n\n2015 research\n-------------\n\n\n*The rest of this page is largely taken from our page written in 2015.*\n\n\nIn April 2015, the lowest recorded GFLOPS prices we knew of were approximately $3/GFLOPS, for various CPU and GPU combinations. Amortized over three years, this was $1.1E-13/FLOPShour. Prices in the $3-5/GFLOPS range seemed to be common, for GPU and CPU combinations and sometimes for supercomputers. Using CPUs, prices were at least $11/GFLOPS, and computing as a service cost more like $160/GFLOPS.\n\n\n### Background\n\n\nWe have written about [long term trends](http://aiimpacts.org/trends-in-the-cost-of-computing/ \"Trends in the cost of computing\") in the costs of computing hardware. We were interested in evaluating the current prices more thoroughly, both to validate the long term trend data, and because current hardware prices are particularly important to know about.\n\n\n### Details\n\n\nWe separately investigated CPUs, GPUs, computing as a service, and supercomputers. In all categories, we collected some contemporary instances which we judged heuristically as especially likely to be cost-effective. We did not find any definitive source on the most cost-effective in any category, or in general, so our examples are probably not the very cheapest. Nevertheless, these figures give a crude sense for the cost of computation in the contemporary market. Our full dataset of CPUs, GPUs and supercomputers is [here](https://docs.google.com/spreadsheets/d/1yqX2cENwkOxC26wV_sBOvV0NxHzzfmL6tU7StzrFXRc/edit?usp=sharing), and contains data on twenty two machines. Our data on computing as a service is all included in this page.\n\n\n#### Included costs\n\n\nFor CPUs and GPUs, we list the price of the CPU and/or GPU (GPUs were always used with a CPU, so we include the cost for both), but not other computer components. We compared prices between [one complete rack server](https://drive.google.com/file/d/1xTA4LoooCuHhCWLhkJZ2ZbOWDxso3a0UILO2JxLn5CweadJVJUziux7CMiumtITXTOjXfttY5zNHzCee/view?usp=sharing) and the set of four [processors](http://www.ebay.com/itm/like/351337480917?lpid=82&chn=ps) inside it, and found the complete server was around 36% more expensive ($30,000 vs. $22,000). We expect this is representative at this scale, but diminishes with scale.\n\n\nFor computing services, we list the cheapest price for renting the instance for a long period, with no additional features. We do not include spot prices.\n\n\nFor supercomputers, we list costs cited, which don’t tend to come with elaboration. We expect that they only include upfront costs, and that most of the costs are for hardware.\n\n\nWe have not included the costs of energy or other ongoing expenses in any prices. Non-energy costs are hard to find, and we suspect a relatively small and consistent fraction of costs. Energy costs appear to be around 10% of hardware costs. For instance, the Intel Xeon E5-2699 uses 527.8 watts and costs $5,190.[2](https://aiimpacts.org/2015-flops-prices/#easy-footnote-bottom-2-1035 \"The processor can be bought here for $5,190 as of April 1 2015. Its energy consumption is 527.8 watts under load, or 90.9 watts idle.\") Over three years, with $0.05/kWh this is $694, or 13% of the hardware cost. Titan also uses 13% of its hardware costs in energy over three years.[3](https://aiimpacts.org/2015-flops-prices/#easy-footnote-bottom-3-1035 \"Titan cost about $4000 dollars per hour amortized over 3 years, and consumes about 10M watts, at a cost of $500 per hour (assuming $0.05 per kWh), which is also 13% of its hardware cost.\") We might add these costs later for a more precise estimate.\n\n\n#### FLOPS measurements\n\n\nTo our knowledge we report only empirical performance figures from benchmark tests, rather than theoretical maximums. We sometimes use figures for [LINPACK](http://en.wikipedia.org/wiki/LINPACK_benchmarks) and sometimes for [DGEMM](http://matthewrocklin.com/blog/work/2012/10/29/Matrix-Computations/) benchmarks, depending on which are available. [Geekbench](http://browser.primatelabs.com/) in particular does not use the common LINPACK, but [LINPACK relies heavily on DGEMM](http://en.wikipedia.org/wiki/Basic_Linear_Algebra_Subprograms), suggesting DGEMM is fairly comparable. We guess they differ by around 10%.[4](https://aiimpacts.org/2015-flops-prices/#easy-footnote-bottom-4-1035 \"This presentation (page ‘Results on a single node’) reports Linpack performance of 95% and 89% of DGEMM performance for their hardware in two tests.\")\n\n\n### Prices\n\n\n#### Central processing units (CPUs)\n\n\nWe found prices and performance data for five contemporary CPUs, including three different instances of one of them. They ranged from $11-354/GFLOPS with most prices below $100/GFLOPS.[5](https://aiimpacts.org/2015-flops-prices/#easy-footnote-bottom-5-1035 \"Muehlhauser and Rieber extended Koh and Magee’s data on MIPS available per dollar to 2014 (data available here). Their 2014 datapoint is for Intel Core i5-4430 and is 607 MIPS/$, and is roughly in line with their figures for recent years. According to Geekbench, it achieves 15.7 GFLOPS on the DGEMM benchmark. According to PCworld, it initially cost $175, and we have not found cheaper prices than this. This implies $11.14/GFLOPS. However Muehlhauser and Rieber seem to report a price of $48, which would make it $3.06/GFLOPS, highly competitive with GPUs and supercomputers. They also cite CPUworld, so we suspect this is an error. Either way, this CPU would not be substantially cheaper than the best GPUs, so does not alter our results.\") The cheapest of these CPUs still looks several times more expensive than some GPUs and supercomputers, so we did not investigate these numbers in great depth, or search far for cheaper CPUs.\n\n\n#### Graphics processing units (GPUs)\n\n\nWe found performance data for six recent combinations of CPUs and GPUs (with much overlap between CPUs and GPUs between combinations. They ranged from $3.22/GFLOPS to $4.17/GFLOPS.\n\n\nNote that graphics cards are typically significantly restricted in the kinds of applications they can run efficiently; this performance is achieved for highly regular computations that can be carried out in parallel throughout a GPU (of the sort that are required for rendering scenes, but which have also proved useful in scientific computing).\n\n\n#### Computing as service\n\n\nAnother way to purchase FLOPS is via virtual computers.\n\n\nAmazon [Elastic Cloud Compute](http://en.wikipedia.org/wiki/Amazon_Elastic_Compute_Cloud) (EC2) is a major seller of virtual computing. Based on their [current pricing](https://aws.amazon.com/ec2/pricing/), renting a [c4.8xlarge](https://aws.amazon.com/ec2/instance-types/) instance costs about $1.17 / hour.[6](https://aiimpacts.org/2015-flops-prices/#easy-footnote-bottom-6-1035 \"The effective hourly rate, if you purchase 3 years of computing, and pay upfront, is $1.1653 per hour.\") This is their largest instance optimized for computing performance (rather than e.g. memory). A c4.8xlarge instance [delivers](http://browser.primatelabs.com/geekbench3/1694602) around 97.5 GFLOPS.[7](https://aiimpacts.org/2015-flops-prices/#easy-footnote-bottom-7-1035 \" Geekbench Browser allows users to measure performance in FLOPS using a variety of tasks. 97.5 is the multi-core DGEMM score a user reported for c4.8xlarge. We use a multi-core score because the cost cited is for purchasing all of the cores. On other tasks, Geekbench reports scores from 46 to 199 GFLOPS. We do not know how reliable Geekbench reports are.\") This implies that a GFLOPShour costs $0.012. If we suppose this is an alternative to buying computer hardware, then the relevant time horizon is about three years. Over three years, renting this hardware will cost $316/GFLOPS, i.e. around two orders of magnitude more than buying GFLOPS in the form of GPUs.\n\n\nOther sources of virtual computing seem to be similarly priced. An [informal comparison](http://www.infoworld.com/d/cloud-computing/ultimate-cloud-speed-tests-amazon-vs-google-vs-windows-azure-237169?page=0,2) of computing providers suggests that on a set of “real-world java benchmarks” three providers are quite closely comparable, with all between just above Amazon’s price and just under half Amazon’s price for completing the benchmarks, across different instance sizes. This analysis also suggests Amazon is a relatively costly provider, and suggests a cheap price for virtual computing is closer to $0.006/GFLOPShour or $160/GFLOPS over three years.\n\n\nEven with this optimistic estimate, virtual computing appears to cost something like fifty times more than GPUs. This high price is presumably partly because there are non-hardware costs which we have not accounted for in the prices of buying hardware, but are naturally included in the cost of renting it. However it is unlikely that these additional costs make up a factor of fifty.\n\n\n#### Supercomputing\n\n\nThe Titan supercomputer [purportedly](http://en.wikipedia.org/wiki/Titan_(supercomputer)) cost about $97M to produce, or about $4,000 dollars per hour amortized over 3 years. It performs 17,590,000 GFLOPS which comes to $5.51/GFLOPS. This makes it around the same price as the cheapest GPUs. It is made of a combination of GPUs and CPUs, so this similarity is unsurprising.\n\n\nThe other six built supercomputers we looked at were more expensive, ranging up to $95/GFLOPS. Another cost-effective supercomputer, the L-CSC, was being built at the time it was most recently reported on, and while it should be completed now we could not find more data on it. Extrapolating from the figures before it was finished, when completed it should cost $2.39/GFLOPS, and thus be the cheapest source of FLOPS we are aware of.\n\n\n### Summary\n\n\nThe lowest recorded GFLOPS prices we know of are approximately $3/GFLOPS, for various CPU and GPU combinations. Amortized over three years, this is $1.1E-13/FLOPShour. Prices in the $3-5/GFLOPS range seem to be common, for GPU and CPU combinations and sometimes for supercomputers. Using CPUs, prices are at least $11/GFLOPS, and computing as a service costs more like $160/GFLOPS.\n\n", "url": "https://aiimpacts.org/2015-flops-prices/", "title": "2015 FLOPS prices", "source": "aiimpacts.org", "source_type": "wordpress", "date_published": "2018-01-19T03:43:14+00:00", "paged_url": "https://aiimpacts.org/feed?paged=14", "authors": ["Katja Grace"], "id": "c764be11c16e6f370d266a8a7d48a535", "summary": []} {"text": "Effect of marginal hardware on artificial general intelligence\n\nWe do not know how AGI will scale with marginal hardware. Several sources of evidence may shed light on this question.\n\n\nDetails\n-------\n\n\n### Background\n\n\nSuppose that at some point in the future, general artificial intelligence can be run on some quantity of hardware, *h*, producing some measurable performance *p*. We would like to know how running approximately the same algorithms using additional hardware (increasing *h*) affects *p*.\n\n\nThis is important, because if performance scales superlinearly, then at the time we can run a human-level intelligence on hardware that costs as much as a human, we can run an intelligence that performs more than twice as well as a human on twice as much hardware, and so already have superhuman efficiency at converting hardware into performance. And perhaps go on, for instance producing an entity which is 64 times as costly as a human yet almost incomparably better at thinking.\n\n\nThis might mean that the first ‘human-level’ effectiveness at converting dollars of hardware into performance would be earlier, when perhaps a mass of hardware costing one thousand times as much as a human can be used to produce something which performs a thousand times as well as a human. However it might be that the first time we have software to produce something roughly human-like, it does so at human-level with much smaller amounts of hardware. In which case, immediately scaling up the hardware might produce a substantially superhuman intelligence. This is one reason some people expect fast progress from sub-human to superhuman intelligence.\n\n\nWhether gains are superexponential or sublinear depends on the metrics of performance. For instance, imagine hypothetically that doubling hardware generally produces a twenty point IQ increase (logarithmic gains in IQ), but twenty IQ points above the smartest human is enough to conquer areas of science that thousands of scientists have puzzled over ineffectually forever (much better than exponential gains in some metric of discovery or economic value). So the question must be how marginal hardware affects metrics that matter to us.\n\n\n### Considerations\n\n\nWe have not investigated this question, but the following sources of evidence seem promising.\n\n\n#### Evidence from existing algorithms\n\n\nWe do not yet have any kind of artificial general intelligence. However we can look at how performance scales with hardware in other kinds of software applications, especially narrow AI.\n\n\n#### Evidence from human brain scaling\n\n\nAmong humans, brain size and intelligence are related. The exact relationship has been studied, but we have not reviewed the literature.\n\n\n#### Evidence from between-animal brain scaling\n\n\nBetween animals, brain size relative to body size is related to intelligence. The exact relationship has probably been studied, but we have not reviewed the literature.\n\n\n#### Evidence from new types of computation being possible with additional hardware\n\n\nSome gains with hardware could come not from better performance on a particular task, but from being able to perform new tasks that were previously infeasible with so little hardware. We do not know how big an issue this is, but examining past experience with increasing hardware availability (e.g. by talking to researchers) seems promising.\n\n", "url": "https://aiimpacts.org/effect-of-marginal-hardware-on-artificial-general-intelligence/", "title": "Effect of marginal hardware on artificial general intelligence", "source": "aiimpacts.org", "source_type": "wordpress", "date_published": "2017-12-29T03:35:17+00:00", "paged_url": "https://aiimpacts.org/feed?paged=14", "authors": ["Katja Grace"], "id": "ad7d4c23396f23d01b450cc8b367f36b", "summary": []} {"text": "Human-level hardware timeline\n\nWe estimate that ‘human-level hardware’— hardware able to perform as many computations per second as a human brain, at a similar cost to a human brain—has a 30% chance of having already occurred, a 45% third chance of occurring by 2040, and a 25% chance of occurring later. We are not confident about these estimates.\n\n\nSupport\n-------\n\n\n### Background\n\n\nSay that computing hardware has reached ‘human-level’ performance when machines can perform as many computations as a human brain performs (under some natural interpretation of the brain as performing computations), at no greater cost than that of running a human brain.\n\n\nWe are interested in when hardware reaches this level of performance, because then if we have software that is also at least ‘human-level’,[1](https://aiimpacts.org/human-level-hardware-timeline/#easy-footnote-bottom-1-1070 \"Here we say software is ‘human-level’ if it uses hardware as efficiently as the human brain to produce any behavior that a human can produce.\") we will have ‘human-level’ AI overall: AI that can perform the tasks that a human brain performs, as efficiently as a human brain.\n\n\nWe may have human-level AI before having hardware and software that are both at least as good as the human brain—intuitively, if one of them is better than that, then the other may be worse. So the implications of human-level hardware alone are not straightforward. (We may also have disruptive change before we have human-level AI—the event of human-level AI is an upper bound for when some large changes in society can be expected to occur.)\n\n\nIt is unclear to us how important the contributions from hardware and software progress are, respectively, to overall AI progress. If hardware progress is much more important than software progress, then human-level hardware should approximately co-occur with human-level AI.\n\n\n### Calculation\n\n\nTo roughly forecast when computing hardware will reach ‘human-level’, we can combine estimates of how much computing the human brain performs per dollar, current hardware performance per dollar, and the rate of improvement in hardware performance.\n\n\nLet:\n\n\n***T*** = time until human-level hardware performance per dollar.\n\n\n***H*** = human-level hardware performance per dollar = 0.4-13\\*1010 FLOPS/$.[2](https://aiimpacts.org/human-level-hardware-timeline/#easy-footnote-bottom-2-1070 \"We estimate that the human brain performs around 1—34 x 1016 FLOPS, based on using a communication benchmark (TEPS) as a proxy for computing. This range does not represent our uncertainty about this method’s reliability.\n
Humans earn very roughly $100/hour. This means that purchasing computing hardware that costs as much as a human per hour, and lasted for around three years (as computing hardware often does), would cost $2.6M upfront.
\nSo we should consider hardware to be competitive with human brains when it performs somewhere between 0.4-13*1010 FLOPS/$.\")\n\n\n***C*** = current hardware performance per dollar = 0.3-30 \\*109FLOPS/$[3](https://aiimpacts.org/human-level-hardware-timeline/#easy-footnote-bottom-3-1070 \"In 2017, cheap hardware appears to perform around 0.3-30 *109 FLOPS/$.\")\n\n\n***R*** = 1 + growth rate of hardware performance per dollar = 1.16-1.78[4](https://aiimpacts.org/human-level-hardware-timeline/#easy-footnote-bottom-4-1070 \"The price of hardware appears to be declining at around an order of magnitude every 10-16 years. However in the longer term, the rate has been an order of magnitude every four years.\") \n\nThen we have:\n\n\nT = logR(H/C)\n\n\n=log1.16(0.4 x 1010/(30 x 109)) to log1.16(13 x 1010/(.3 x 109))\n\n\n= -14 to 41 years\n\n\n \n\n\nThese are rough calculations, and the breadth of the intervals don’t necessarily mean a lot—the intervals were non-specific to begin with, and then we combined several of them.\n\n\nIf we do something similar (shown [here](https://www.getguesstimate.com/models/10042)), using more realistic distributions for each variable and calculating using the entire distributions rather than end points, we get -14 to 22 years using the narrower estimates for human-level hardware that we used above, or -31 to 99 years for a very wide set of estimates for [human-level hardware](http://aiimpacts.org/brain-performance-in-flops/). The chance that human-level hardware has already occurred is around 20-40%, according to these calculations.\n\n\nBased on these calculations, we estimate a 30% chance we are already past human-level hardware (at human cost), a 45% chance it occurs by 2040, and a 25% chance it occurs later.[5](https://aiimpacts.org/human-level-hardware-timeline/#easy-footnote-bottom-5-1070 \"This is based on weighting the narrower estimates for what constitutes human-level hardware at 60% and the broader ones at 40%.\")\n\n\nImplications\n------------\n\n\nThese figures suggest that the period when we most expect human-level hardware has already begun, and we are a substantial part of the way through it. In the case that hardware progress matters a lot more than software progress, this means that we should expect to see human-level AI in the next several decades, or possibly in the past. This is some evidence against hardware progress being so important, but still overall makes human-level AI likely to be sooner than one might have thought without the evidence considered here.\n\n", "url": "https://aiimpacts.org/human-level-hardware-timeline/", "title": "Human-level hardware timeline", "source": "aiimpacts.org", "source_type": "wordpress", "date_published": "2017-12-23T07:59:19+00:00", "paged_url": "https://aiimpacts.org/feed?paged=14", "authors": ["Katja Grace"], "id": "aafbce624bbd968d9b0e385c8b9332dd", "summary": []} {"text": "Chance date bias\n\nThere is modest evidence that people consistently forecast events later when asked the probability that the event occurs by a certain year, rather than the year in which a certain probability of the event will have accrued.\n\n\nDetails\n-------\n\n\nIn the [2016 ESPAI](http://aiimpacts.org/2016-expert-survey-on-progress-in-ai/) and its preparation, AI experts and Mechanical Turk workers both consistently gave later probability distributions for events relating to AI when asked to give the probability that the event would occur by a given year, rather than the year by which there was a certain probability. See more on [the ESPAI page](http://aiimpacts.org/2016-expert-survey-on-progress-in-ai/).\n\n\nWe do not know which framing produces more reliable answers. We have not seen this bias elsewhere.\n\n\nThe following figure shows an example for some key figures: the distributions with stars are consistently a little flatter than those with circles.\n\n\n[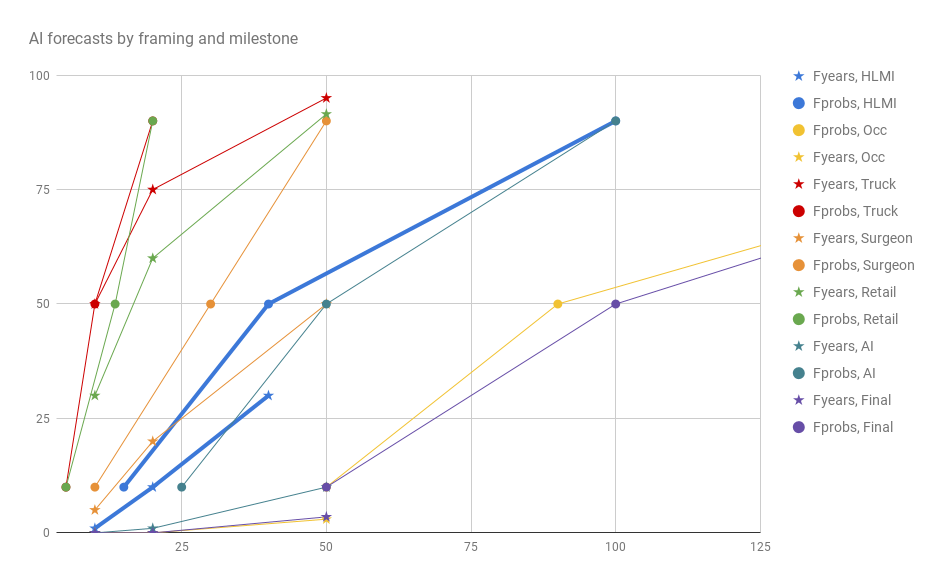](http://aiimpacts.org/wp-content/uploads/2017/04/AI-forecasts-by-framing-and-milestone.png)**Figure 1.** Median answers to questions about probabilities by dates (‘fixed year’) and dates for probabilities (‘fixed probability’), for different occupations, all current occupations, and all tasks (HLMI).\n\n", "url": "https://aiimpacts.org/chance-date-bias/", "title": "Chance date bias", "source": "aiimpacts.org", "source_type": "wordpress", "date_published": "2017-12-12T07:59:02+00:00", "paged_url": "https://aiimpacts.org/feed?paged=14", "authors": ["Katja Grace"], "id": "28af3e1d78c657eaa88df83c1a068ee3", "summary": []} {"text": "GoCAS talk on AI Impacts findings\n\n*By Katja Grace, 27 November 2017*\n\n\nHere is a video summary of some highlights from AI Impacts research over the past years, from the [GoCAS Existential Risk](https://www.chalmers.se/en/centres/GoCAS/Events/Existential-risk-to-humanity/Pages/default.aspx) workshop in Göteborg in September. Thanks to the folks there for recording it.\n\n\n", "url": "https://aiimpacts.org/gocas-talk-on-ai-impacts-findings/", "title": "GoCAS talk on AI Impacts findings", "source": "aiimpacts.org", "source_type": "wordpress", "date_published": "2017-11-28T06:04:19+00:00", "paged_url": "https://aiimpacts.org/feed?paged=15", "authors": ["Katja Grace"], "id": "41cee490c514524ce035cc1c2992c6db", "summary": []} {"text": "Price performance Moore’s Law seems slow\n\n*By Katja Grace, 26 November 2017*\n\n\nWhen people make predictions about AI, they often assume that computing hardware will carry on getting cheaper for the foreseeable future, at about the same rate that it usually does. Since this is such a common premise, and whether reality has yet proved it false is checkable, it seems good to check sometimes. So we [did](http://aiimpacts.org/recent-trend-in-the-cost-of-computing/).\n\n\nLooking up the price and performance of some hardware turned out to be a real mess, with conflicting numbers everywhere and the resolution of each error or confusion mostly just leading to several more errors and confusions.\n\n\nI suppose the way people usually make meaningful figures depicting computer performance changing over time is that they are doing it over long enough periods of time that even if each point is only accurate to within three orders of magnitude, it is fine because the whole trend is traversing ten or fifteen orders of magnitude. But since I wanted to know what was happening in the last few years, this wouldn’t do—half an order of magnitude of progress could be entirely lost in that much noise.\n\n\nIn the end, the two best looking sources of data we could find are the theoretical performance of GPUs (via Wikipedia), and [Passmark](https://www.passmark.com/)‘s collection of performance records for their own benchmark. Neither is perfect, but both make it look like prices for computing are falling substantially slower than they were. Over the last couple of decades it [had been](http://aiimpacts.org/trends-in-the-cost-of-computing/) taking about four years for computing to get ten times cheaper, and now (on these measures) it’s taking more like twelve years. Which could in principle be to do with these measures being different from usual, but I think probably not.\n\n\nThere are quite a few confusions still to resolve here. For instance, in spite of showing slower progress, these numbers look a lot cheaper than what would have been predicted by extrapolating [past trends](http://aiimpacts.org/trends-in-the-cost-of-computing/) (or sometimes more expensive). Which might be because we are comparing performance using different metrics, and converting between them badly. Different records of past trends seem to disagree with one another too, which is perhaps a hint. Or it could be that there was faster growth somewhere in between that we didn’t see. Or we might not have caught all of the miscellaneous errors in this cursed investigation.\n\n\nBut before we get too bogged down trying to work these things out, I just wanted to say that price performance Moore’s Law tentatively looks slower than usual.\n\n\n*See full investigation at: [Recent Trend in the Cost of Computing](http://aiimpacts.org/recent-trend-in-the-cost-of-computing/)*\n\n", "url": "https://aiimpacts.org/price-performance-moores-law-seems-slow/", "title": "Price performance Moore’s Law seems slow", "source": "aiimpacts.org", "source_type": "wordpress", "date_published": "2017-11-27T07:58:03+00:00", "paged_url": "https://aiimpacts.org/feed?paged=15", "authors": ["Katja Grace"], "id": "4af5ec6a1677e8f68d0a1294a1a9c14c", "summary": []} {"text": "2017 trend in the cost of computing\n\nThe cheapest hardware prices (for single precision FLOPS/$) appear to be falling by around an order of magnitude every 10-16 years. This rate is slower than the trend of FLOPS/$ observed over the past quarter century, which was an order of magnitude every 4 years. There is no particular sign of slowing between 2011 and 2017.\n\n\nSupport\n-------\n\n\n### Background\n\n\nComputing power available per dollar [has increased](http://aiimpacts.org/trends-in-the-cost-of-computing/) fairly evenly by a factor of ten roughly every four years in the last quarter of a century (a phenomenon sometimes called ‘[price-performance Moore’s Law](http://aiimpacts.org/ai-risk-terminology/)‘). Because this trend is important and regular, it is useful in predictions. For instance, it is often used to [determine when the hardware for an AI mind might become cheap](http://aiimpacts.org/brain-performance-in-flops/). This means that a primary way such predictions might err is if this trend in computing prices were to leave its long run trajectory. This must presumably happen eventually, and has purportedly happened with other exponential trends in information technology recently.[1](https://aiimpacts.org/recent-trend-in-the-cost-of-computing/#easy-footnote-bottom-1-756 \"For instance processor clock speed and traditional Moore’s law\")\n\n\nThis page outlines our assessment of whether the long run trend is on track very recently, as of late 2017. This differs from assessing the long run trend (as we do [here](http://aiimpacts.org/trends-in-the-cost-of-computing/)) in that it requires recent and relatively precise data. Data that may be off by one order of magnitude is still useful when assessing a long run trend that grows by many orders of magnitude. But if we are judging whether the last five years of that trend are on track, it is important to have more accurate figures.\n\n\n### Sources of evidence\n\n\nWe sought public data on computing performance, initial price, and date of release for different pieces of computing hardware. We tried to cover different types of computing hardware, and to prioritize finding large, consistent datasets using comparable metrics, rather than one-off measurements. We searched for computing performance measured using the [Linpack benchmark](https://en.wikipedia.org/wiki/LINPACK_benchmarks), or something similar.\n\n\nWe ran into many difficulties finding consistently measured performance in FLOPS for different machines, as well as prices for those same machines. What data we could find used a variety of different benchmarks. Sometimes performance was reported as ‘FLOPS’ without explanation. Twice the ‘same’ benchmarks turned out to give substantially different answers at different times, at least for some machines, apparently due to the benchmarks being updated. Performance figures cited often refer to ‘theoretical peak performance’, which is calculated from the computer’s specifications, rather than measured, and is higher than actual performance.\n\n\nPrices are also complicated, because each machine can have many sellers, and each price fluctuates over time. We tried to use the release price, the manufacturer’s ‘recommended customer price’, or similar where possible. However, many machines don’t seem to have readily available release prices.\n\n\nThese difficulties led to many errors and confusions, such that progress required running calculations, getting unbelievable results, and searching for an error that could have made them unbelievable. This process is likely to leave remaining errors at the end, and those errors are likely to be biased toward giving results that we find believable. We do not know of a good remedy for this, aside from welcoming further error-checking, and giving this warning.\n\n\n### Evidence\n\n\n[GPUs](https://en.wikipedia.org/wiki/Graphics_processing_unit) appear to be substantially cheaper than [CPUs](https://en.wikipedia.org/wiki/Central_processing_unit), cloud computing (including TPUs), or supercomputers.[2](https://aiimpacts.org/recent-trend-in-the-cost-of-computing/#easy-footnote-bottom-2-756 \"See ‘Other sources…’ below.\") Since GPUs alone are at the frontier of price performance, we focus on them. We have two useful datasets: one of theoretical peak performance, gathered from Wikipedia, and one of empirical performance, from [Passmark](https://www.passmark.com/).\n\n\n#### GPU theoretical peak performance\n\n\nWe collected data from several Wikipedia pages, supplemented with other sources for some dates and prices.[3](https://aiimpacts.org/recent-trend-in-the-cost-of-computing/#easy-footnote-bottom-3-756 \"Wikipedia pages: Xeon Phi, List of Nvidia Graphics Processing Units, List of AMD Graphics Processing Units
\nOther sources are visible in the last column of our dataset (see ‘Wikipedia GeForce, Radeon, Phi simplified’ sheet)\") We think all of the performance numbers are theoretical peak performance, generally calculated from specifications given by the developer, but we have not checked Wikipedia’s sources or calculations thoroughly. Our impression is that the prices given are recommended prices at launch, by the developers of the hardware, though again we have only checked a few of them.\n\n\nWe look at Nvidia and AMD GPUs and Xeon Phi processors here because they are the machines for which we could find data on Wikipedia easily. However, Nvidia and AMD are the leading producers of GPUs, so this should cover the popular machines. We excluded many machines because they did not have prices listed.\n\n\nFigure 1 shows performance (single precision) over time for processors for which we could find all of the requisite data.\n\n\nThe recent rate of progress in this figure looks like somewhere between half an order of magnitude in the past eight years and an order of magnitude in the past ten, for an order of magnitude about every 10-16 years. We don’t think the figure shows particular slowing down—the most cost-effective hardware has not improved in almost a year, but that is usual in the rest of the figure.\n\n\n[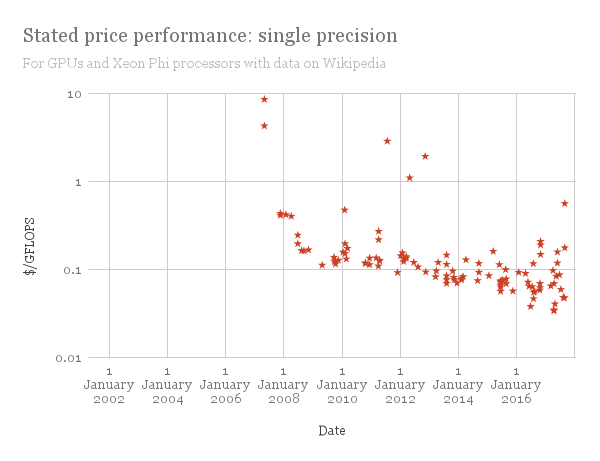](http://aiimpacts.org/wp-content/uploads/2017/10/chart-42.png)**Figure 1**\n\n\nWe also collected double precision performance figures for these machines, but the machines do not appear to be optimized for double precision performance,[4](https://aiimpacts.org/recent-trend-in-the-cost-of-computing/#easy-footnote-bottom-4-756 \"Performance is usually measured either as ‘single precision’ or ‘double precision’. Roughly, the latter involves computations with numbers that are twice as large, in the sense of requiring twice as many bits of information to store them (see here and here). The trend of double precision performance from this dataset saw no progress in five years, and in fact became markedly worse (see figure below).
\nOur understanding is that GPUs are generally not optimized for double precision performance, because it is less relevant to the applications that they are used for. Many processors we looked at either purportedly did not do double precision operations at all, or were up to thirty-two times slower at them. So our guess is that we are seeing movement toward sacrificing double precision performance for single precision performance, rather than a slowdown in double precision performance where it is intended. So we disregard this data in understanding the overall trend.
\n
\") so we focus on single precision.\n\n\nPeak theoretical performance is generally higher than actual performance, but our impression is that this should be by a roughly constant factor across time, so not make a difference to the trend.\n\n\n#### GPU Passmark value\n\n\n[Passmark](https://www.cpubenchmark.net/) maintains a collection of benchmark results online, for both CPUs and GPUs. They also collect prices, and calculate price for performance (though it was not clear to us on brief inspection where their prices come from). Their performance measure is from their own benchmark, which we do not know a lot about. This makes their absolute prices hard to compare to others using more common measures, but the trend in progress should be more comparable.\n\n\nWe used [archive.org](http://archive.org) to collect old versions of Passmark’s page of the [most cost-effective](https://www.videocardbenchmark.net/gpu_value.html) GPUs available, to get a history of price for passmark performance. The prices are from the time of the archive, not necessarily from when the hardware was new. That is, if we collected all of the results on the page on January 1, 2013, it might contain hardware that was built in 2010 and has maybe come down in price due to being old. You might wonder whether this means we are just getting a lot of really cheap old hardware with hardly any performance, which might be bad in other ways and so not represent a realistic price of hardware. This is possible, however given that people show interest in this (for instance, Passmark keep these records) it would be surprising to us if this metric mostly caught useless hardware.\n\n\n[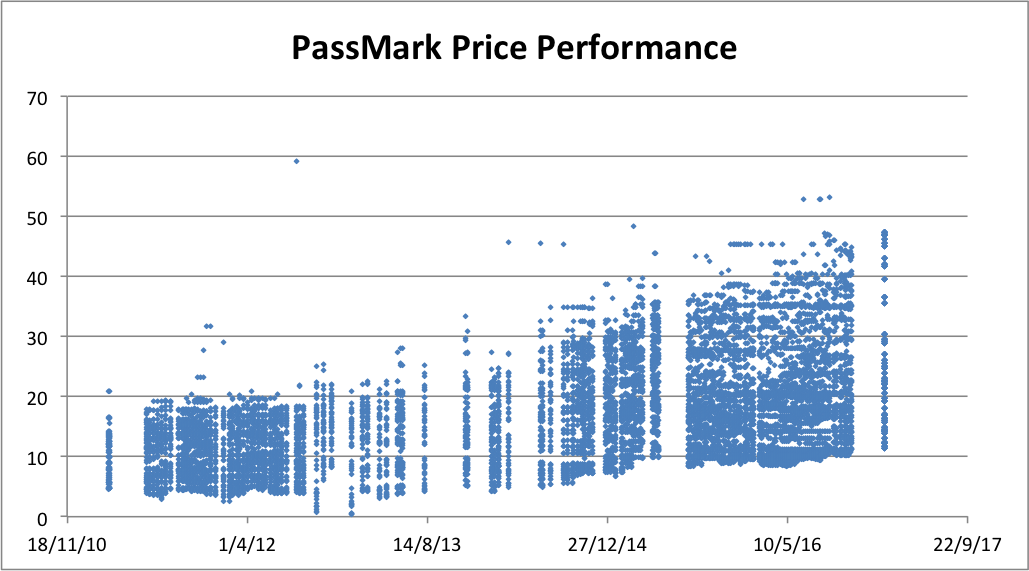](http://aiimpacts.org/wp-content/uploads/2017/11/Scrape-archiveorg-gpu-figure-2.png)**Figure 2:** Top GPU passmark performance per dollar scores over time.\n\n\n \n\n\n[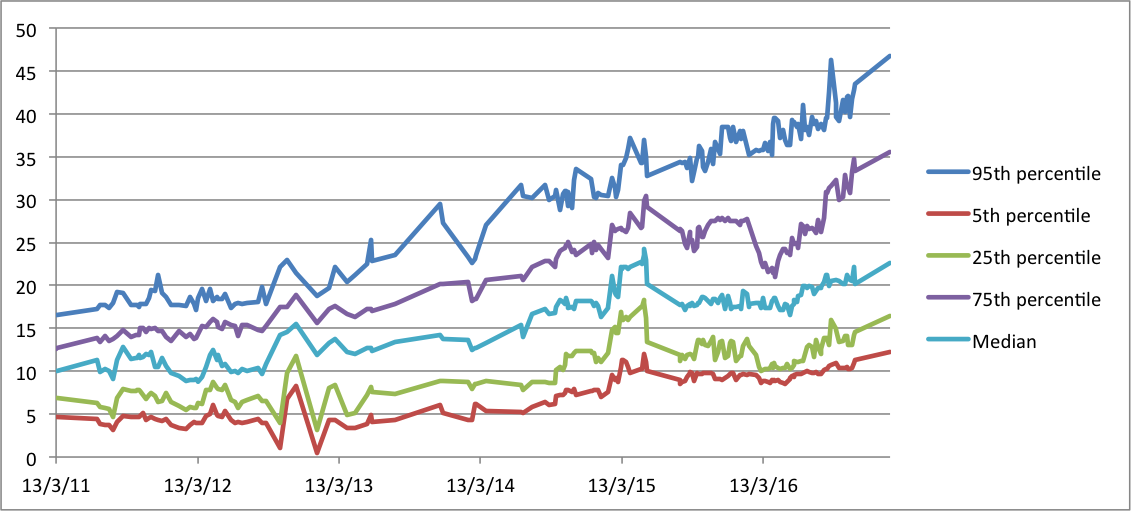](http://aiimpacts.org/wp-content/uploads/2017/11/Scrape-archiveorg-gpu-figure-1.png)**Figure 3:** The same data in Figure 1, showing progress for different percentiles.\n\n\n \n\n\n[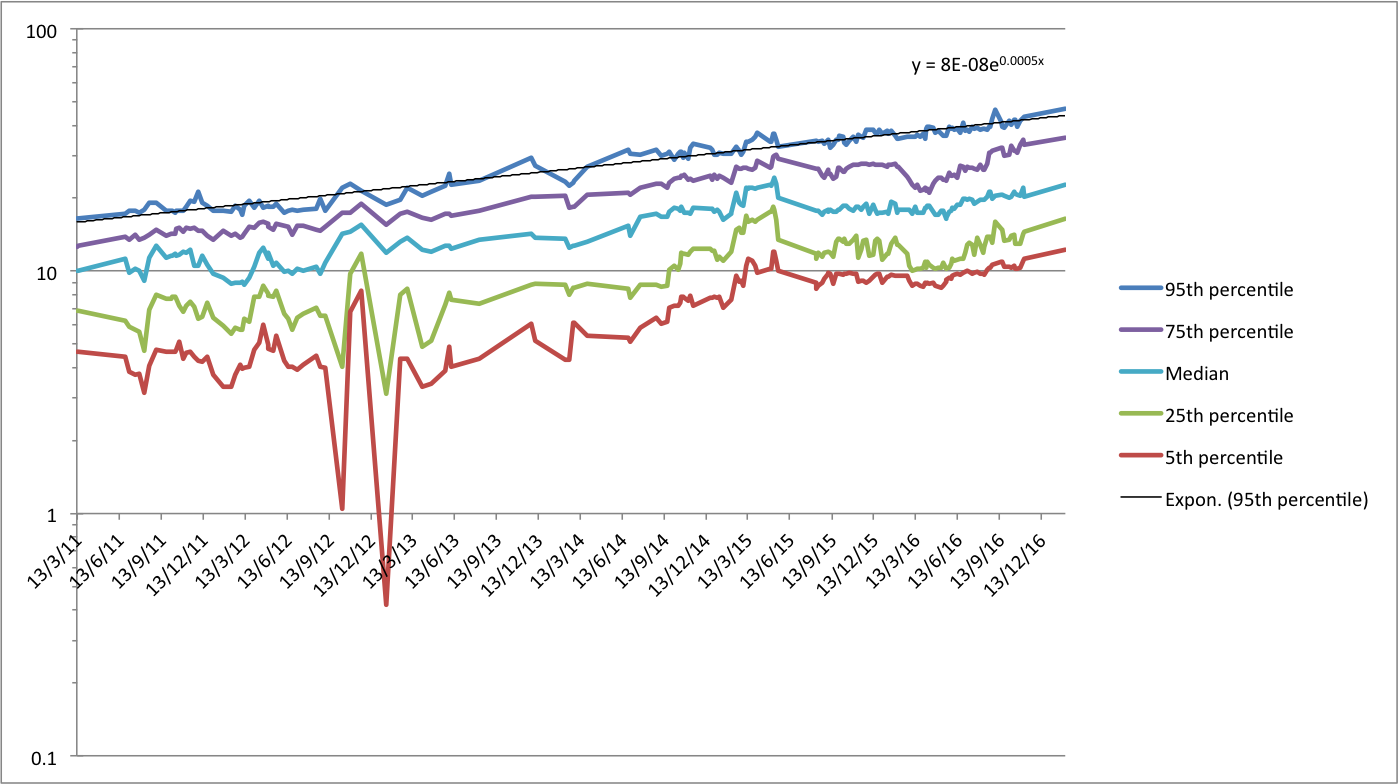](http://aiimpacts.org/wp-content/uploads/2017/11/Scrape-archiveorg-gpu-figure-3.png)**Figure 4:** Figure 3, with a log y axis.\n\n\nWe are broadly interested in the cheapest hardware available, but we probably don’t want to look at the very cheapest in data like this, because it seems likely to be due to error or other meaningless exploitation of the particular metric.[5](https://aiimpacts.org/recent-trend-in-the-cost-of-computing/#easy-footnote-bottom-5-756 \"One reason it seems unlikely to us that the very cheapest numbers are ‘real’ is because they are quite noisy (see figure 2)—high numbers appear and disappear, whereas if we had made real progress in hardware technology, we might expect cheap hardware available in 2012 to also be available in 2013. Another reason is that in similar CPU data that we scraped from Passmark, there is a clear dropoff in high numbers at one point, which we think corresponds to slightly changing the benchmark to better measure those machines.\") The 95th percentile machines (out of the top 50) appear to be relatively stable, so are probably close to the cheapest hardware without catching too many outliers. For this reason, we take them as a proxy for the cheapest hardware.\n\n\nFigure 4 shows the 95th percentile fits an exponential trendline quite well, with a doubling time of 3.7 years, for an order of magnitude every 12 years. This has been fairly consistent, and shows no sign of slowing by early 2017. This supports the 10-16 year time we estimated from the Wikipedia theoretical performance above.\n\n\n \n\n\n#### Other sources we investigated, but did not find relevant\n\n\n* The **[Wikipedia page on FLOPS](https://web.archive.org/web/20171025210410/https://en.wikipedia.org/wiki/FLOPS)** contains a history of GFLOPS over time. The recent datapoints appear to overlap with the theoretical performance figures we have already.\n* Google has developed **[Tensor Processing Units](https://en.wikipedia.org/wiki/Tensor_processing_unit)** (TPUs) that specialize in computation for machine learning. Based on information from Google, [we estimate](http://aiimpacts.org/2018-price-of-performance-by-tensor-processing-units/) that they perform around 1.05 GFLOPS/$.\n* In 2015, **cloud computing** appeared to be around a hundred times more expensive than other forms of computing.[6](https://aiimpacts.org/recent-trend-in-the-cost-of-computing/#easy-footnote-bottom-6-756 \"See Current FLOPS Prices, or 2015 FLOPS prices.\") Since then the price appears to have roughly halved.[7](https://aiimpacts.org/recent-trend-in-the-cost-of-computing/#easy-footnote-bottom-7-756 \"As of October 5th, 2017, renting a c4.8xlarge instance costs $0.621 per hour (if you purchase it for three years, and pay upfront) When we last checked this in around April 2015, the price for the same arrangement was $1.17 / hour.\") So cloud computing is not a competitive way to buy FLOPS all else equal, and the price of FLOPS may be a small influence on the cloud-computing price trend, making the trend less relevant to this investigation.\n* Top **supercomputers** perform at around $3/GFLOPS, so they do not appear to be on the forefront of cheap performance. See [Price performance trend in top supercomputers](http://aiimpacts.org/price-performance-trend-in-top-supercomputers/) for more details.\n* **Geekbench** has empirical performance numbers for many systems, but their latest version does not seem to have anything for GPUs. We looked at a small number of popular CPUs on Geekbench from the past five years, and found the cheapest to be around $0.71/GFLOPS. However there appear to be 5x disparities between different versions of Geekbench, which makes it less useful for fine-grained estimates.\n\n\nConclusions\n-----------\n\n\nWe have seen that the theoretical peak single-precision performance of GPUs is improving at about an order of magnitude every 10-16 years. And that the Passmark performance/$ trend is improving by an order of magnitude every 12 years. These are slower than [the long run price-performance trends](http://aiimpacts.org/trends-in-the-cost-of-computing/) of an order of magnitude every eight years (75 year trend) or four years (25 year trend).\n\n\nThe longer run trends are based on a slightly different set of measures, which might explain a difference in rates of progress.\n\n\nWithin these datasets the pace of progress does not appear to be slower in recent years relative to earlier ones.\n\n", "url": "https://aiimpacts.org/recent-trend-in-the-cost-of-computing/", "title": "2017 trend in the cost of computing", "source": "aiimpacts.org", "source_type": "wordpress", "date_published": "2017-11-12T07:59:31+00:00", "paged_url": "https://aiimpacts.org/feed?paged=15", "authors": ["Katja Grace"], "id": "5b189b8c2cc58b4bd75be9f270602972", "summary": []}
{"text": "Price-performance trend in top supercomputers\n\nA top supercomputer can perform a GFLOP for around $3, in 2017.\n\n\nThe price of performance in top supercomputers continues to fall, as of 2016.\n\n\nDetails\n-------\n\n\n[TOP500.org](https://www.top500.org/lists/2017/06/) maintains a list of top supercomputers and their performance on the Linpack benchmark. The figure below is based on empirical performance figures (‘Rmax’) from [Top500](https://www.top500.org/lists/2017/06/) and price figures collected from a variety of less credible sources, for nine of the ten highest performing supercomputers (we couldn’t find a price for the tenth). Our data and sources are [here](https://docs.google.com/spreadsheets/d/1nV6djZI7csDv_ewElbNKiQZVl36ViGyUEy_MSqk2krI/edit?usp=sharing).\n\n\nSunway Teihu Light performs the cheapest GFLOPS, at $2.94/GFLOPS. This is around one hundred times more expensive than peak theoretical performance of certain GPUs, but we do not know why there is such a difference (peak performance is generally higher than actual performance, but by closer to a factor of two).\n\n\nThere appears to be a downward trend in price, but it is not consistent, and with so few data points its slope is ambiguous. The best price for performance roughly halved in the last 4-5 years, for a 10x drop in 13-17 years. The K computer in 2011 was much more expensive, but appears to have been substantially more expensive than earlier computers.\n\n\n#### \n\n\n[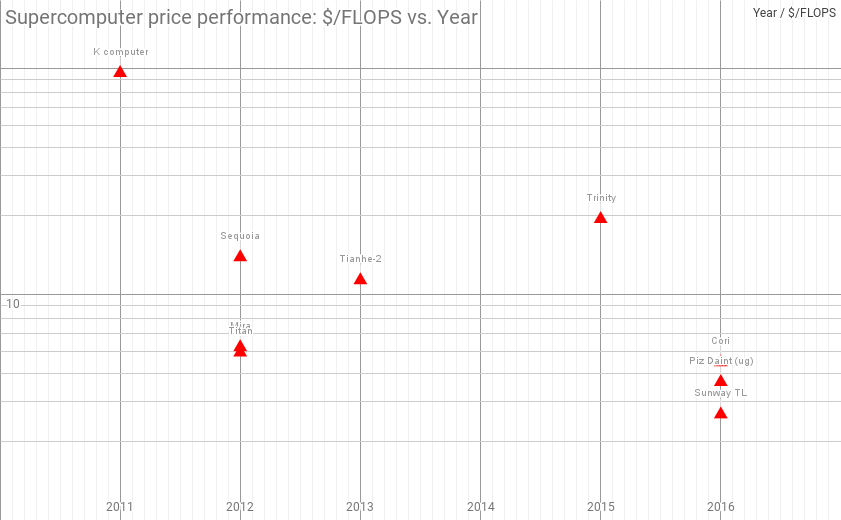](http://aiimpacts.org/wp-content/uploads/2017/11/chart-54.png)\n\n\n \n\n", "url": "https://aiimpacts.org/price-performance-trend-in-top-supercomputers/", "title": "Price-performance trend in top supercomputers", "source": "aiimpacts.org", "source_type": "wordpress", "date_published": "2017-11-09T07:31:27+00:00", "paged_url": "https://aiimpacts.org/feed?paged=15", "authors": ["Katja Grace"], "id": "6fd89b00a942478d7a19adb8dd36c3a8", "summary": []}
{"text": "Computing hardware performance data collections\n\nThis is a list of public datasets that we know of containing either measured or theoretical performance numbers for computer processors.\n\n\nList\n----\n\n\n1. **[Top 500](https://www.top500.org/lists/2017/06/)** maintains a list of the top 500 supercomputers, updated every six months. It includes measured performance.\n2. [**List of Nvidia Graphics Processing Units**](https://en.wikipedia.org/wiki/List_of_Nvidia_graphics_processing_units) contains GFLOPS figures for a large number of GPUs. Probably they are all theoretical peak performance numbers. It also contains release dates and release prices.\n3. **[List of AMD Graphics Processing Units](https://en.wikipedia.org/wiki/List_of_AMD_graphics_processing_units)** is much like the list of Nvidia GPUs, but for the other leading GPU brand.\n4. [**Wikipedia’s FLOPS page**](https://en.wikipedia.org/wiki/FLOPS#Hardware_costs) contains a small amount of data, seemingly empirical, from a variety of sources.\n5. **Wikipedia** has other small collections of theoretical performance data. For instance on the [Intel Xeon Phi](https://en.wikipedia.org/wiki/Xeon_Phi) page.\n6. [**Moravec**](ftp://netuno.io.usp.br/los/IOF257/moravec.pdf) has perhaps the oldest and best known dataset. We link to an article discussing it, but its actual page was down last we checked.\n7. [**Nordhaus**](http://www.econ.yale.edu/~nordhaus/homepage/prog_083001a.pdf) expands on Moravec’s data.\n8. [**Koh and Magee**](http://web.mit.edu/cmagee/www/documents/15-koh_magee-tfsc_functional_approach_studying_technological_progress_vol73p1061-1083_2006.pdf) expand on Moravec’s data.\n9. **Rieber and Muehlhauser** did have a dataset (discussed [here](https://intelligence.org/2014/05/12/exponential-and-non-exponential/#footnote_7_11027)) but links to it appear to be broken.\n10. [**John McCallum’s**](http://www.jcmit.com/cpu-performance.htm) dataset (doesn’t load at time of writing, but is discussed in [Sandberg and Bostrom 2008](http://www.fhi.ox.ac.uk/brain-emulation-roadmap-report.pdf) and on our page on [trends in the cost of computing](http://aiimpacts.org/trends-in-the-cost-of-computing/))\n11. [**Passmark**](https://www.cpubenchmark.net/) has a huge quantity of empirical performance data, for CPUs and GPUs. However it is all in terms of their own benchmark, so hard to compare to other things. They also list current prices. Looking at it over time (via [archive.org](http://web.archive.org/web/20120409044931/https://www.cpubenchmark.net)) can let you also see past prices. Doing so suggests that they change their benchmarks on occasion, which makes it even harder to interpret what they mean.\n12. [**Geekbench Browser**](https://browser.geekbench.com/v4/cpu/singlecore) collects empirical performance data from people testing their computers with Geekbench’s service. They list many benchmark numbers for many computers. However identically named benchmark figures from ‘Geekbench v4’ vs. ‘Geekbench v3’ for the same hardware differ a lot (one of us recollects about a factor of five), apparently because they changed what the benchmark actually was then. This suggests care should be taken to use numbers from the same version of Geekbench, and also that any version is not necessarily comparable to other apparently identical measures from elsewhere. We are also not sure whether differences in benchmark meaning only occur between saliently labeled versions.\n13. [**Export compliance metrics for Intel Processors**](https://www.intel.com/content/www/us/en/support/articles/000005755/processors.html) is a collection of PDFs listing processors alongside a number for ‘FLOP’, which we suppose is related to FLOPS. It does not contain much explanation, and has some worrying characteristics.[1](https://aiimpacts.org/computing-hardware-performance-data-collections/#easy-footnote-bottom-1-1016 \"Multiple different processors from different times have identical ‘FLOP’ numbers, and the overall trend of these numbers over time does not appear to be very downward. They are also quite different from some other numbers for the same processors, but we haven’t checked this very thoroughly.\")\n14. [**Karl Rupp**](https://github.com/karlrupp/cpu-gpu-mic-comparison) has collected some data and made it available. He has also blogged about it [here](https://www.karlrupp.net/2013/06/cpu-gpu-and-mic-hardware-characteristics-over-time/) and [here](https://www.karlrupp.net/2016/08/flops-per-cycle-for-cpus-gpus-and-xeon-phis/). However he says he got it from a combination of the Intel compliance metrics (listed above), and the list of Intel Xeon Microprocessors (below), and a) the export compliance metrics data seems strange, and b) we couldn’t actually track down his data in those sources. Possibly we are misunderstanding the export compliance metrics, and he is interpreting them correctly, resolving both problems.\n15. [**Asteroids@home**](https://asteroidsathome.net/boinc/cpu_list.php) lists Whetstone benchmark GFLOPS per core by CPU model for computers participating in their project.\n16. **The [Microway knowledge center](https://www.microway.com/knowledge-center-articles/categories/performance/)** has a lot of pages containing at least some theoretical peak performance numbers (see any called ‘[detailed specifications of —](https://www.microway.com/knowledge-center-articles/detailed-specifications-of-the-intel-xeon-e5-2600v4-broadwell-ep-processors/)‘, but most of the numbers on each page are inside figures, and so hard to export or read in detail.\n\n\n### Other useful hardware data\n\n\n* [**List of Intel Xeon Microprocessors**](https://en.wikipedia.org/wiki/List_of_Intel_Xeon_microprocessors) does not include figures for FLOPS, but has price and release date data.\n", "url": "https://aiimpacts.org/computing-hardware-performance-data-collections/", "title": "Computing hardware performance data collections", "source": "aiimpacts.org", "source_type": "wordpress", "date_published": "2017-10-26T22:34:47+00:00", "paged_url": "https://aiimpacts.org/feed?paged=15", "authors": ["Katja Grace"], "id": "42bf55ef0229d590b439949690221160", "summary": []}
{"text": "2016 ESPAI Narrow AI task forecast timeline\n\nThis is an interactive timeline we made, illustrating the median dates when respondents said they expected a 10%, 50% and 90% chance of different tasks being automatable, in the [2016 Expert Survey on progress in AI](http://aiimpacts.org/2016-expert-survey-on-progress-in-ai/) (further details on that page).\n\n\nTimeline\n--------\n\n\n", "url": "https://aiimpacts.org/2016-espai-narrow-ai-task-forecast-timeline/", "title": "2016 ESPAI Narrow AI task forecast timeline", "source": "aiimpacts.org", "source_type": "wordpress", "date_published": "2017-10-04T18:23:07+00:00", "paged_url": "https://aiimpacts.org/feed?paged=15", "authors": ["Katja Grace"], "id": "6429b3014ba9aba26e71a9996a1c2b23", "summary": []}
{"text": "When do ML Researchers Think Specific Tasks will be Automated?\n\n*By Katja Grace, 26 September 2017*\n\n\nWe asked the ML researchers in our [survey](http://aiimpacts.org/2016-expert-survey-on-progress-in-ai/) when they thought 32 narrow, relatively well defined tasks would be feasible for AI. Eighteen of them were included in [our paper](https://arxiv.org/abs/1705.08807) earlier, but the other fourteen results are among some new stuff we just put up on the [survey page](http://aiimpacts.org/2016-expert-survey-on-progress-in-ai/).\n\n\nWhile the researchers we talked to don’t expect anything like human-level AI for a long time, they do expect a lot of specific tasks will be open to automation soon. Of the 32 tasks we asked about, either 16 or 28 of them were considered more likely than not within ten years by the median respondent (depending on how the question was framed).\n\n\nAnd some of these would be pretty revolutionary, at an ordinary ‘turn an industry on its head’ level, rather than a ‘world gets taken over by renegade robots’ level. You have probably heard that the transport industry is in for some disruption. And phone banking, translation and answering simple questions have already been on their way out. But also forecast soon: [the near-obsoletion of musicians](http://aiimpacts.org/automation-of-music-production/).\n\n\nThe task rated easiest was human-level Angry Birds playing, with a 90% chance of happening within six or ten years, depending on the question framing. The annual [Angry Birds Man vs. Machine Challenge](https://aibirds.org/man-vs-machine-challenge.html) did just happen, but the results are yet to be announced.\n\n\nThe four tasks that were not expected within ten years regardless of question framing were translating a new language using something like a Rosetta Stone, selecting and proving publishable mathematical theorems, doing well in the Putnam math contest, and writing a New York Times bestselling story.\n\n\nThe fact that the respondents gave radically different answers to other questions [depending on framing](http://aiimpacts.org/2016-expert-survey-on-progress-in-ai/) suggests to us that their guesses are not super reliable. Nonetheless, we expect they are better than nothing, and that they are a good place to start if we want to debate what will happen.\n\n\nTo that end, below is a timeline (full screen version [here](https://cdn.knightlab.com/libs/timeline3/latest/embed/index.html?source=1NbsZ5kiaRxTW8Jo6jkJgOkHatVQHtMqKu22WwdMrwZc&font=Default&lang=en&initial_zoom=2&height=650)) showing the researchers’ estimates for all 32 questions. These estimates are using the question framing that yielded slightly earlier results – forecasts were somewhat later given a different framing of the question.\n\n\n", "url": "https://aiimpacts.org/when-do-ml-researchers-think-specific-tasks-will-be-automated/", "title": "When do ML Researchers Think Specific Tasks will be Automated?", "source": "aiimpacts.org", "source_type": "wordpress", "date_published": "2017-09-26T22:33:51+00:00", "paged_url": "https://aiimpacts.org/feed?paged=15", "authors": ["Katja Grace"], "id": "596ecdd32d6eb6c08adbf5c3bdbf5672", "summary": []}
{"text": "What do ML researchers think you are wrong about?\n\n*By Katja Grace, 25 September 2017*\n\n\nSo, maybe you are concerned about AI risk. And maybe you are concerned that many people making AI are not concerned enough about it. Or not concerned about the right things. But if so, do you know why they disagree with you?\n\n\nWe didn’t, exactly. So we asked the machine learning (ML) researchers in our survey. Our questions were:\n\n\n1. To what extent do you think people’s concerns about future risks from AI are due to misunderstandings of AI research?\n2. What do you think are the most important misunderstandings, if there are any?\n\n\nThe first question was multiple choice on a five point scale, while the second was more of a free-form, compose-your-own-succinct-summary-critique-of-a-diverse-constellation-of-views type thing. Nonetheless, more than half of the people who did the first also kindly took a stab at the second. Some of their explanations were pretty long. Some not. Here is my attempt to cluster and paraphrase them:\n\n\n \n\n\n[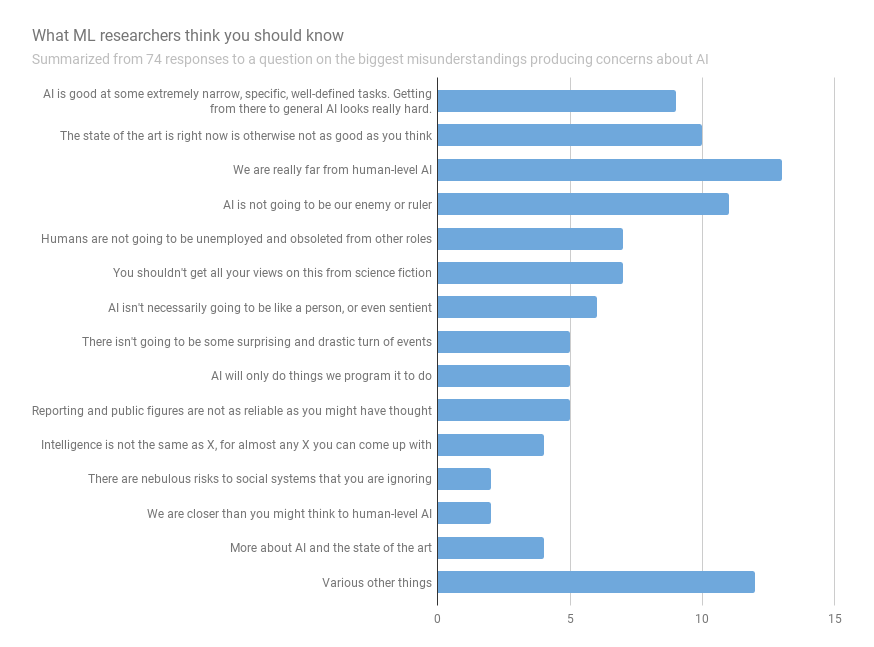](http://aiimpacts.org/wp-content/uploads/2017/09/chart-40.png)Number of respondents giving each response, out of 74.\n \n\n\nOur question might have been a bit broad. ‘People’s concerns about AI risk’ includes both Stuart Russell’s [concerns](http://aiimpacts.org/stuart-russells-description-of-ai-risk/) about systems optimizing n-variable functions based on fewer than n variables, and reporters’ [concerns](https://www.digitaltrends.com/business/killer-sex-robots/) about killer sex robots. Which at a minimum should probably be suspected of resting on different errors. [Edited for clarity Oct 15 ’17]\nSo are we being accused of any misunderstandings, or are they all meant for the ‘put pictures of Terminator on everything’ crowd?\n\n\nThe comments about unemployment and surprising events, and some of the ones about AI ruling over or fighting us seem likely to be directed at people like me. On the other hand, they are also all about social consequences, and none of these issues seem to be considered resolved by the relevant social scientists. So I am not too worried if I find myself in disagreement with some AI researchers there.\n\n\nI am more interested if AI researchers complain that I am mistaken about AI. And I think they probably are here, at least a bit.\n\n\nMy sense from reading over all these responses is that the first three categories listed in the figure represent basically the same view, and that people talk about it at different levels of generality. I’d put them together like this:\n\n\n\n> The state of the art right now looks great in the few examples you see, but those are actually a large fraction of the things that it can do, and it often can’t even do very slight variations on those things. The problems AI can currently deal with all have to be very well specified. Getting from here to AI that can just wander out into the world and even live a successful life as a rat seems wildly ambitious. We don’t know how to make *general* AI at all. So we are really unimaginably far from human-level AI, because it would have to be general.\n> \n> \n\n\nBut this is a guess on my part, and I am curious to hear whether any AI researchers reading have a better sense of what views are like.\n\n\nWhether these first three categories are all the same view or not, they do sound plausibly directed at people like me. And if ML researchers want to disagree with me about the state of the art in AI or how easy it is to extend it or improve upon it, it would be truly shocking if I were in the right. So I tentatively conclude that we are probably further away from general AI than I might have thought.\n\n\nOn the other hand, I wouldn’t be surprised if the respondents were misdiagnosing the disagreement here. My impression is that AI researchers (among others) often take for granted that you shouldn’t worry about things decades before they are likely to happen. So when they see people worried about AI risk, they naturally suppose that those people anticipate dangerous AI much sooner than they really do. My weak impression is that this kind of misunderstanding happens often.\n\n\nBy the way, the respondents did mostly think concerns are based largely on misunderstandings (which is [not to imply](http://aiimpacts.org/ai-hopes-and-fears-in-numbers/) that they aren’t concerned):\n\n\n[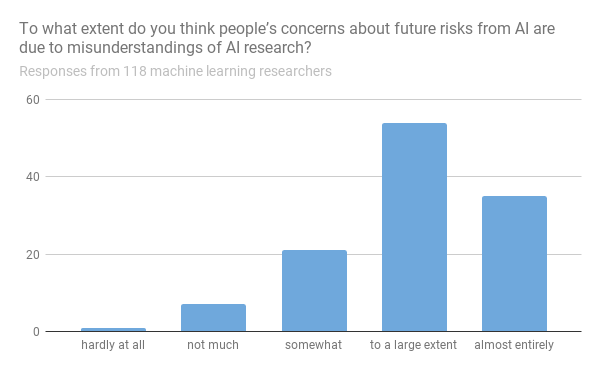](http://aiimpacts.org/wp-content/uploads/2016/12/chart-35.png)Number of respondents giving each response, out of 118.\n*(Results taken from [our survey page](http://aiimpacts.org/2016-expert-survey-on-progress-in-ai/). More new results are also up there.)*\n\n\n\n", "url": "https://aiimpacts.org/what-do-ml-researchers-think-you-are-wrong-about/", "title": "What do ML researchers think you are wrong about?", "source": "aiimpacts.org", "source_type": "wordpress", "date_published": "2017-09-26T05:04:13+00:00", "paged_url": "https://aiimpacts.org/feed?paged=15", "authors": ["Katja Grace"], "id": "d64578a5c9c01e43e4b4ef74be7aae13", "summary": []}
{"text": "Automation of music production\n\nMost machine learning researchers expect machines will be able to create top quality music by 2036.\n\n\nDetails\n-------\n\n\n### Evidence from survey data\n\n\nIn the [2016 ESPAI](http://aiimpacts.org/2016-expert-survey-on-progress-in-ai/), participants were asked two relevant questions:\n\n\n[**Top forty**] Compose a song that is good enough to reach the US Top 40. The system should output the complete song as an audio file.\n\n\n[**Taylor**] Produce a song that is indistinguishable from a new song by a particular artist, e.g. a song that experienced listeners can’t distinguish from a new song by Taylor Swift.\n\n\n#### Summary results\n\n\nAnswers were as follows, suggesting these milestones are likely to be reached in ten years, and quite likely to be reached in twenty years.\n\n\n\n\n\n\n\n\n| | **10 years** | **20 years** | **50 years** |\n| **Top forty** | **27.5%** | **50%** | **90%** |\n| **Taylor** | **60%** | **75%** | **99%** |\n\n\n\n\n\n\n\n\n| | **10%** | **50%** | **90%** |\n| **Top forty** | **5 years** | **10 years** | **20 years** |\n| **Taylor** | **5 years** | **10 years** | **20 years** |\n\n\n#### Distributions of answers to Taylor question\n\n\nThe three figures below show how respondents were spread between different answers over time, for the respondents who answered the ‘fixed years’ framing.\n\n\n[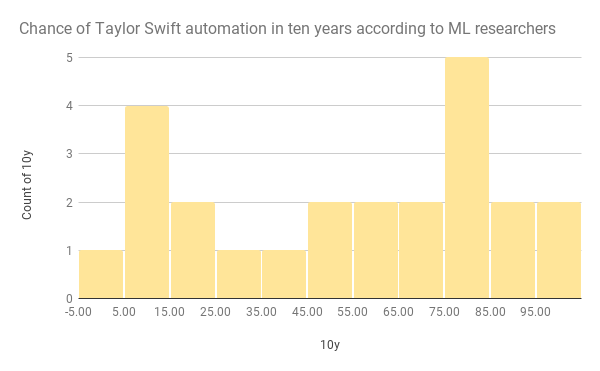](http://aiimpacts.org/wp-content/uploads/2017/09/chart-22.png)10\n\n\n[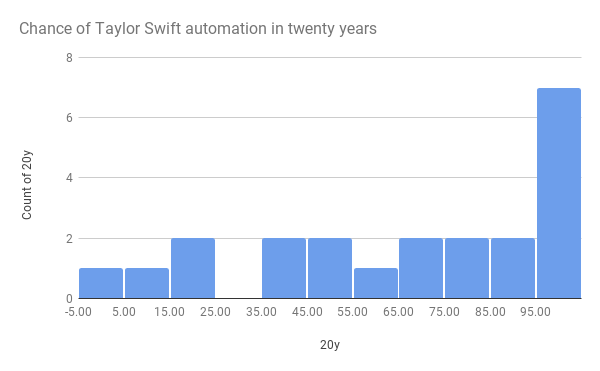](http://aiimpacts.org/wp-content/uploads/2017/09/chart-23.png)20\n\n\n[](http://aiimpacts.org/wp-content/uploads/2017/09/chart-24.png)50\n\n", "url": "https://aiimpacts.org/automation-of-music-production/", "title": "Automation of music production", "source": "aiimpacts.org", "source_type": "wordpress", "date_published": "2017-09-13T00:03:34+00:00", "paged_url": "https://aiimpacts.org/feed?paged=15", "authors": ["Katja Grace"], "id": "b536935a85e86467e5500b3fd48c8ef0", "summary": []}
{"text": "Stuart Russell’s description of AI risk\n\nStuart Russell has argued that advanced AI poses a risk, because it will have the ability to make high quality decisions, yet may not share human values perfectly.\n\n\nDetails\n-------\n\n\nStuart Russell describes a risk from highly advanced AI [here](https://www.edge.org/conversation/the-myth-of-ai#26015). In short:\n\n\nThe primary concern [with highly advanced AI] is not spooky emergent consciousness but simply the ability to make high-quality decisions. Here, quality refers to the expected outcome utility of actions taken […]. Now we have a problem:\n\n\n1. The utility function may not be perfectly aligned with the values of the human race, which are (at best) very difficult to pin down.\n\n\n2. Any sufficiently capable intelligent system will prefer to ensure its own continued existence and to acquire physical and computational resources – not for their own sake, but to succeed in its assigned task.\n\n\nA system that is optimizing a function of n variables, where the objective depends on a subset of size k
\n‘This is a new general purpose factoring record, beating the old 116-digit
\nrecord that was set in January 1991, more than two years ago.’ – Factorization of RSA-120, Lenstra, 1993 \") We will ignore it, since the dates are too close to matter substantially, and the other two sources agree.\n* A 1988 paper [discussing](http://citeseerx.ist.psu.edu/viewdoc/download?doi=10.1.1.81.1434&rep=rep1&type=pdf) recent work and constraints on possibility at that time. It lists four ‘state of the art’ efforts at factorization, among which the largest number factored using a general purpose algorithm ([MPQS](https://en.wikipedia.org/wiki/Quadratic_sieve#Multiple_polynomials)) has 95 digits.[9](https://aiimpacts.org/progress-in-general-purpose-factoring/#easy-footnote-bottom-9-758 \"Before making our question more precise, let us illustrate its vagueness with four examples which, in the summer of 1988, represented the state of the art in factoring.
\n(i) In [7, 24] Bob Silverman et al. describe their implementation of the multiple polynomial quadratic sieve algorithm (mpqs) on a network of 24 SUN-3 workstations. Using the idle cycles on these workstations, 90 digit integers have been factored in about six weeks (elapsed time).
\n(ii) In [21] Herman te Riele et al. describe their implementation of the same algorithm on two different supercomputers. They factored a 92 digit integer using 95 hours of CPU time on a NEC SX-2.
\n(iii) ‘Red’ Alford and Carl Pomerance implemented mpqs on 100 IBM PC’s; it took them about four months to factor a 95 digit integer.
\n(iv) In [20] Carl Pomerance et al. propose to build a special purpose mpqs machine ‘which should cost about $20,000 in parts to build and which should be able to factor 100 digit integers in a month.’
\n– Lenstra et al 1988\") It claims that 106 digits had been factored by 1988, which implies that the early RSA challenge numbers were not state of the art. [10](https://aiimpacts.org/progress-in-general-purpose-factoring/#easy-footnote-bottom-10-758 \"“At the time Of writing this paper we have factored two 93, one 96, one 100, one 102, and 358 one 106 digit number using mpqs, and we m working on a 103 digit number, for all these numbers extensive ecm attempts had failed. “- Lenstra et al 1988 \") Together these suggest that the work in the paper is responsible for moving the record from 95 to 106 digits, and this matches our impressions from elsewhere though we do not know of a specific claim to this effect.\n* This ‘[RSA honor roll](http://www.ontko.com/pub/rayo/primes/hr_rsa.txt)‘ contains meta-data for the RSA solutions.\n* [Cryptography and Computational Number Theory](https://books.google.com/books?id=yyfS7MKQhJUC&lpg=PA45&ots=ZuITD7DllA&dq=alford%20pomerance%2095%20digit&pg=PA44#v=onepage&q=107-digit&f=false) (1989), Carl Pomerance and Shafi Goldwasser.[11](https://aiimpacts.org/progress-in-general-purpose-factoring/#easy-footnote-bottom-11-758 \"e.g. p44 mentions the 107-digit record and some details.\")\n\n\n*Excel spreadsheet containing our data for download: [Factoring data 2017](http://aiimpacts.org/wp-content/uploads/2017/03/Factoring-data-2017-1.xlsx)*\n\n\n### Trends\n\n\n#### Digits by year\n\n\nFigure 1 shows how the scale of numbers that could be factored (using general purpose methods) grew over the last half-century (as of 2017). In red are the numbers that broke the record for the largest number of digits, as far as we know.\n\n\nFrom it we see that since 1970, the numbers that can be factored have increased from around twenty digits to 232 digits, for an average of about 4.5 digits per year.\n\n\nAfter the first record we have in 1988, we know of thirteen more records being set, for an average of one every 1.6 years between 1988 and 2009. Half of these were set the same or the following year as the last record, and the largest gap between records was four years. As of 2017, seven years have passed without further records being set.\n\n\nThe largest amount of progress seen in a single step is the last one—32 additional digits at once, or over five years of progress at the average rate seen since 1988 just prior to that point. The 200 digit record was also around five years of progress.\n\n\n[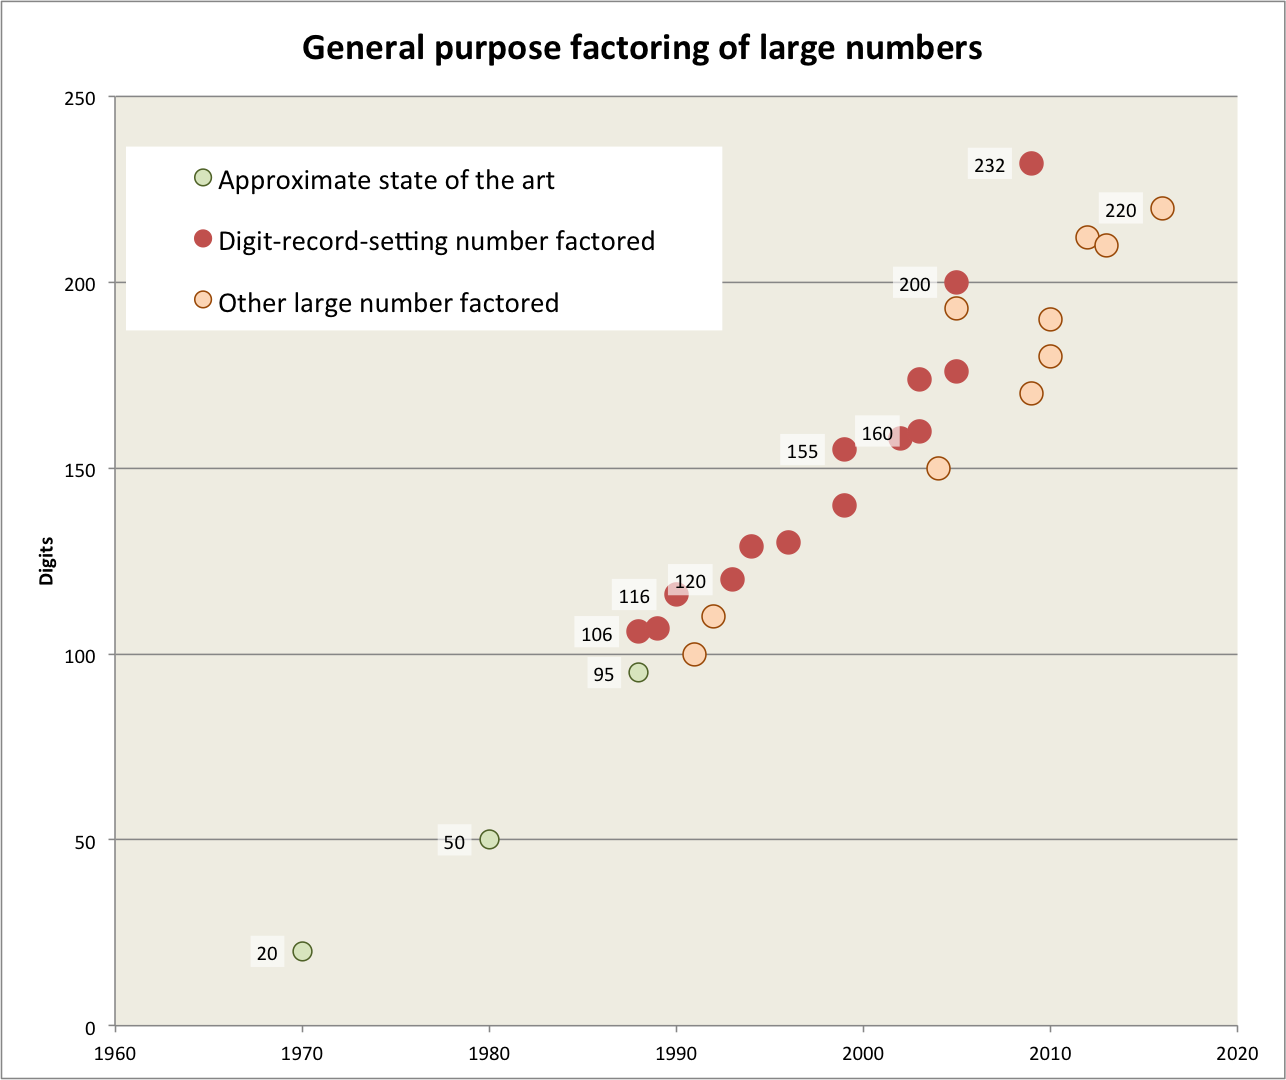](http://aiimpacts.org/wp-content/uploads/2017/03/Factoring-records-March-2017-with-labels-and-axes.png)Figure 1: Size of numbers (in decimal digits) that could be factored over recent history. Green ‘approximate state of the art’ points do not necessarily represent specific numbers or the very largest that could be at that time—they are qualitative estimates. The other points represent specific large numbers being factored, either as the first number of that size ever to be factored (red) or not (orange). Dates are accurate to the year. Some points are annotated with decimal digit size, for ease of reading.\n\n\n#### Hardware inputs\n\n\nNew digit records tend to use more computation, which makes progress in software alone hard to measure. At any point in the past it was in principle possible to factor larger numbers with more hardware. So the records we see are effectively records for what can be done with however much hardware anyone is willing to purchase for the purpose. Which grows from a combination of software improvements, hardware improvements, and increasing wealth among other things. Figure 2 shows how computing used for solutions increased with time.\n\n\n[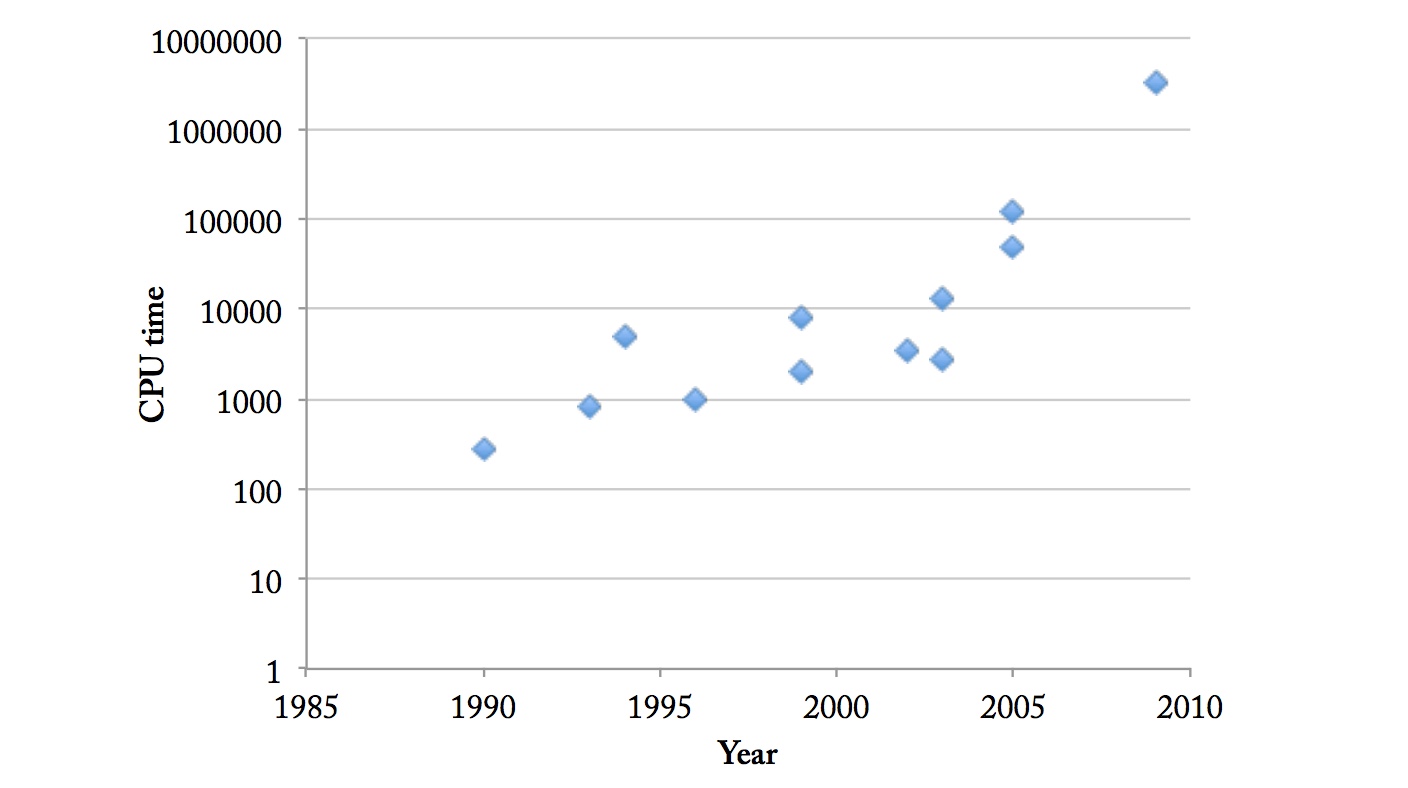](http://aiimpacts.org/wp-content/uploads/2017/03/time-to-factor.jpeg)Figure 2: CPU time to factor digit-record breaking numbers. Measured in 1,000 MIPS-years before 2000, and in GHz-years after 2000. These are similar, but not directly comparable, so the conversion here is approximate. Data from [Contini (2010)](http://www.crypto-world.com/FactorRecords.html). Figure from [Grace (2013)](https://intelligence.org/files/AlgorithmicProgress.pdf). (Original caption: “Figure 31 shows CPU times for the FactorWorld records. These times have increased by a factor of around ten thousand since 1990. At 2000 the data changes from being in MIPS-years to 1 GHz CPU-years. These aren’t directly comparable. The figure uses 1 GHz CPU-year = 1,000 MIPS-years, because it is in the right ballpark and simple, and no estimates were forthcoming. The figure suggests that a GHz CPU-year is in fact worth a little more, given that the data seems to dip around 2000 with this conversion.”)\n\n\nIn the two decades between 1990 and 2010, figure 2 suggests that computing used has increased by about four orders of magnitude. During that time computing available per dollar has probably increased by a factor of [ten every four years or so](http://aiimpacts.org/trends-in-the-cost-of-computing/), for about five orders of magnitude. So we are seeing something like digits that can be factored at a fixed expense.\n\n\nFurther research\n----------------\n\n\n* Discover how computation used is expected to scale with the number of digits factored, and use that to factor out increased hardware use from this trendline, and so measure non-hardware progress alone.\n* This area appears to have seen a small number of new algorithms, among smaller changes in how they are implemented. Check how much the new algorithms affected progress, and similarly for anything else with apparent potential for large impacts (e.g. a move to borrowing other people’s spare computing hardware via the internet, rather than paying for hardware).\n* Find records from earlier times.\n* Some numbers had large prizes associated with their factoring, and others of similar sizes had none. Examine the relationship between progress and financial incentives in this case.\n* [The Cunningham Project](https://homes.cerias.purdue.edu/~ssw/cun/index.html) maintains a vast collection of recorded factorings of numbers, across many scales, along with dates, algorithms used, and people or projects responsible. Gather that data, and use to make similar inferences to the data we have here (see *Relevance* section below for more on that).\n\n\n \n\n\nRelevance\n---------\n\n\nWe are interested in factoring, because it is an example of an algorithmic problem on which there has been well-documented progress. Such examples should inform our expectations for algorithmic problems in general (including problems in AI), regarding:\n\n\n* How smooth or jumpy progress tends to be, and related characteristics of its shape.\n* How much warning there is of rapid progress.\n* How events that are qualitatively considered ‘conceptual insights’ or ‘important progress’ relate to measured performance progress.\n* How software progress interacts with hardware (for instance, does a larger step of software progress cause a disproportionate increase in overall software output, because of redistribution of hardware?).\n* If performance is improving, how much of that is because of better hardware, and how much is because of better algorithms or other aspects of software.\n\n\n \n\n\nAssorted sources\n----------------\n\n\n* [Integer factoring](https://www.fdi.ucm.es/profesor/m_alonso/Documentos/factorizacion/arjlensfac.pdf)\n* [RSA Factoring Challenge FAQ](https://www.emc.com/emc-plus/rsa-labs/historical/the-rsa-factoring-challenge-faq.htm)\n* Other pages around e.g. [this one](https://members.loria.fr/PZimmermann/records/factor-previous.html#general), seem to have data for run times etc of other things\n* [Graph of history of factorization with GNFS](https://members.loria.fr/PZimmermann/records/gnfsrecord.jpg)\n* More [data on records](https://members.loria.fr/PZimmermann/records/factor.html), probably largely overlapping, including different methods (that I have probably seen elsewhere)\n* Announcements such as [this one](http://www.crypto-world.com/announcements/siqs116.text) contain much info, many on Scott Contini’s page.\n\n\n\n\n---\n\n\n \n\n", "url": "https://aiimpacts.org/progress-in-general-purpose-factoring/", "title": "Progress in general purpose factoring", "source": "aiimpacts.org", "source_type": "wordpress", "date_published": "2017-03-16T11:03:21+00:00", "paged_url": "https://aiimpacts.org/feed?paged=16", "authors": ["Katja Grace"], "id": "346ca474f049040300ff57dbeeb66cdc", "summary": []}
{"text": "Trends in algorithmic progress\n\nAlgorithmic progress has been estimated to contribute fifty to one hundred percent as much as hardware progress to overall performance progress, with low confidence.\n\n\nAlgorithmic improvements appear to be relatively incremental.\n\n\nDetails\n-------\n\n\n*We have not recently examined this topic carefully ourselves. This page currently contains relevant excerpts and sources.*\n\n\n[Algorithmic Progress in Six Domains](https://intelligence.org/files/AlgorithmicProgress.pdf)[1](https://aiimpacts.org/trends-in-algorithmic-progress/#easy-footnote-bottom-1-784 \"Grace, K. (2013), Algorithmic Progress in Six Domains, Machine Intelligence Research Institute, https://intelligence.org/files/AlgorithmicProgress.pdf\") measured progress in the following areas, as of 2013:\n\n\n* Boolean satisfiability\n* Chess\n* Go\n* Largest number factored ([our updated page](http://aiimpacts.org/progress-in-general-purpose-factoring/))\n* MIP algorithms\n* Machine learning\n\n\nSome key summary paragraphs from the paper:\n\n\nMany of these areas appear to experience fast improvement, though the data are often noisy. For tasks in these areas, gains from algorithmic progress have been roughly fifty to one hundred percent as large as those from hardware progress. Improvements tend to be incremental, forming a relatively smooth curve on the scale of years\n\n\n…\n\n\nIn recent *Boolean satisfiability* (SAT) competitions, SAT solver performance has increased 5–15% per year, depending on the type of problem. However, these gains have been driven by widely varying improvements on particular problems. Retrospective surveys of SAT performance (on problems chosen after the fact) display significantly faster progress.\n\n\n*Chess programs* have improved by around fifty Elo points per year over the last four decades. Estimates for the significance of hardware improvements are very noisy but are consistent with hardware improvements being responsible for approximately half of all progress. Progress has been smooth on the scale of years since the 1960s, except for the past five.\n\n\n*Go programs* have improved about one stone per year for the last three decades. Hardware doublings produce diminishing Elo gains on a scale consistent with accounting for around half of all progress.\n\n\nImprovements in a variety of *physics simulations* (selected after the fact to exhibit performance increases due to software) appear to be roughly half due to hardware progress.\n\n\nThe *largest number factored* to date has grown by about 5.5 digits per year for the last two decades; computing power increased ten-thousand-fold over this period, and it is unclear how much of the increase is due to hardware progress.\n\n\nSome *mixed integer programming* (MIP) algorithms, run on modern MIP instances with modern hardware, have roughly doubled in speed each year. MIP is an important optimization problem, but one which has been called to attention after the fact due to performance improvements. Other optimization problems have had more inconsistent (and harder to determine) improvements.\n\n\nVarious forms of *machine learning* have had steeply diminishing progress in percentage accuracy over recent decades. Some vision tasks have recently seen faster progress.\n\n\nNote that these points have not been updated for developments since 2013, and machine learning in particular is generally observed to have seen more progress very recently (as of 2017).\n\n\n### Figures\n\n\nBelow are assorted figures mass-extracted from [Algorithmic Progress in Six Domains](https://intelligence.org/files/AlgorithmicProgress.pdf), some more self-explanatory than others. See the paper for their descriptions.\n\n\n[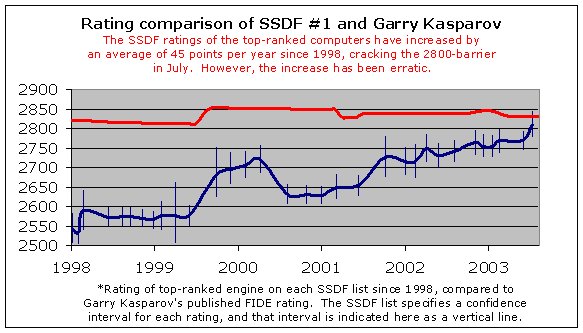](http://aiimpacts.org/wp-content/uploads/2017/03/Page-27-Image-1311.png) [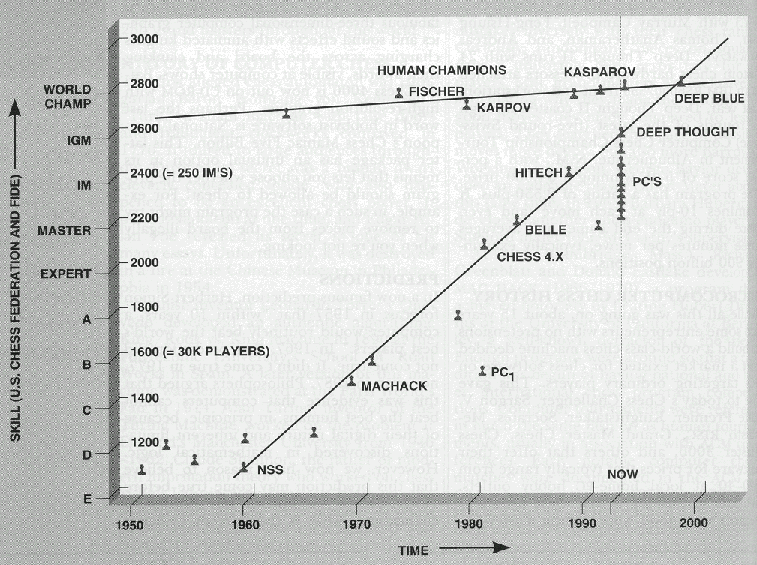](http://aiimpacts.org/wp-content/uploads/2017/03/Page-28-Image-1394.png) [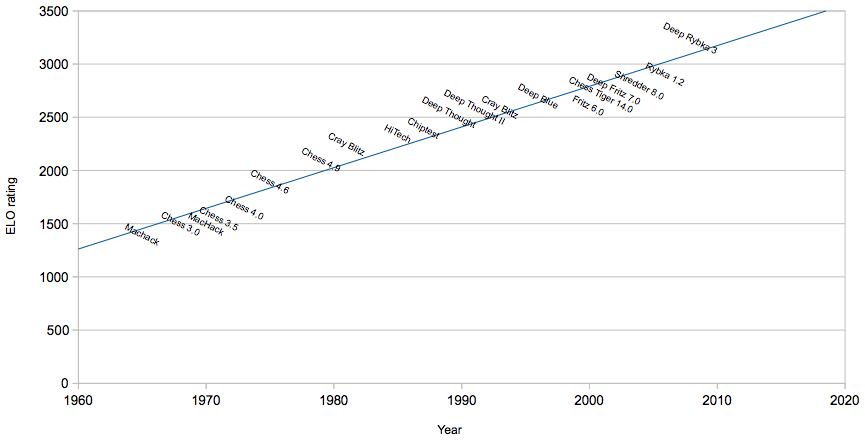](http://aiimpacts.org/wp-content/uploads/2017/03/Page-29-Image-1395.png) [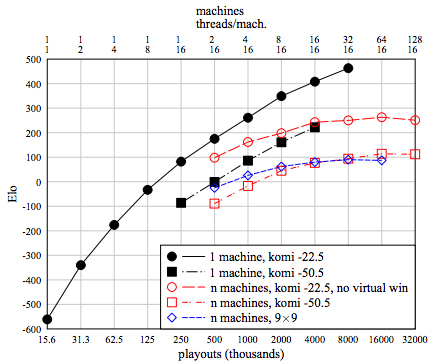](http://aiimpacts.org/wp-content/uploads/2017/03/Page-31-Image-1396.png) [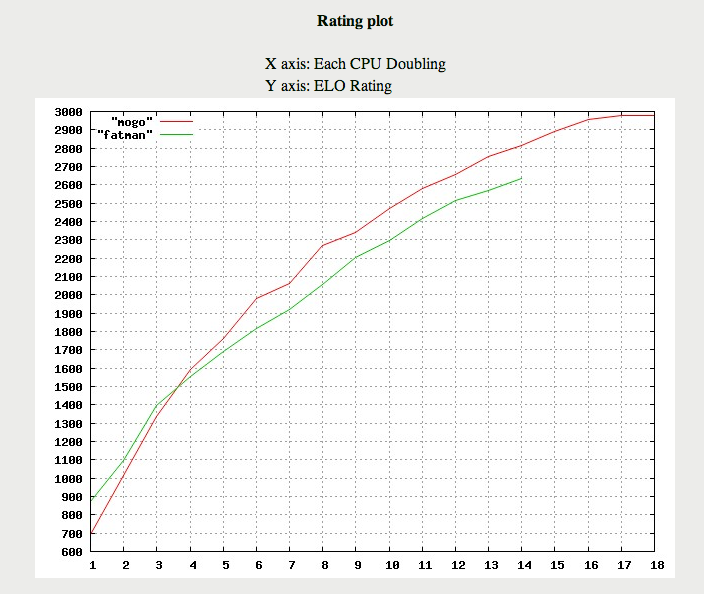](http://aiimpacts.org/wp-content/uploads/2017/03/Page-32-Image-1397.png) [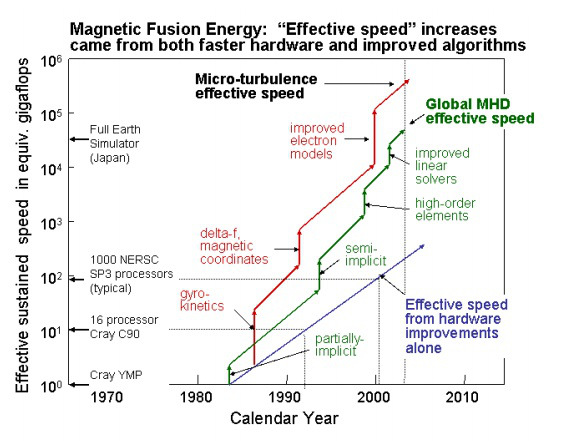](http://aiimpacts.org/wp-content/uploads/2017/03/Page-40-Image-1827.png) [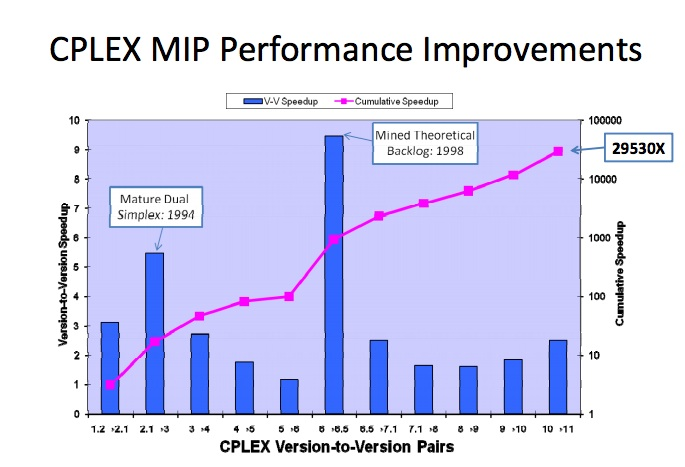](http://aiimpacts.org/wp-content/uploads/2017/03/Page-41-Image-1828.png) [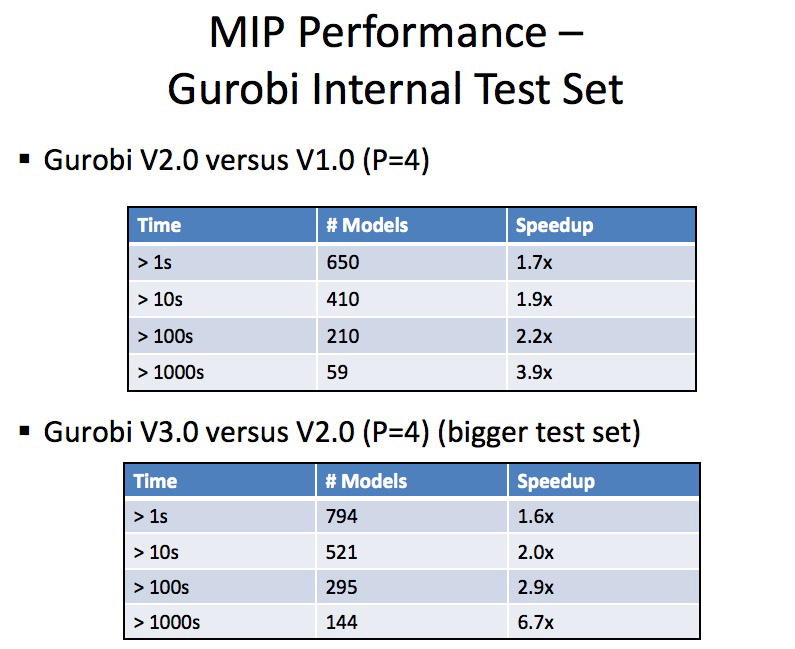](http://aiimpacts.org/wp-content/uploads/2017/03/Page-42-Image-1829.png) [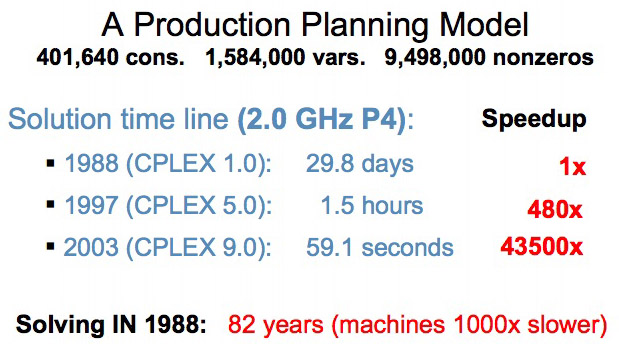](http://aiimpacts.org/wp-content/uploads/2017/03/Page-43-Image-1830.png) [](http://aiimpacts.org/wp-content/uploads/2017/03/Page-43-Image-1831.png) [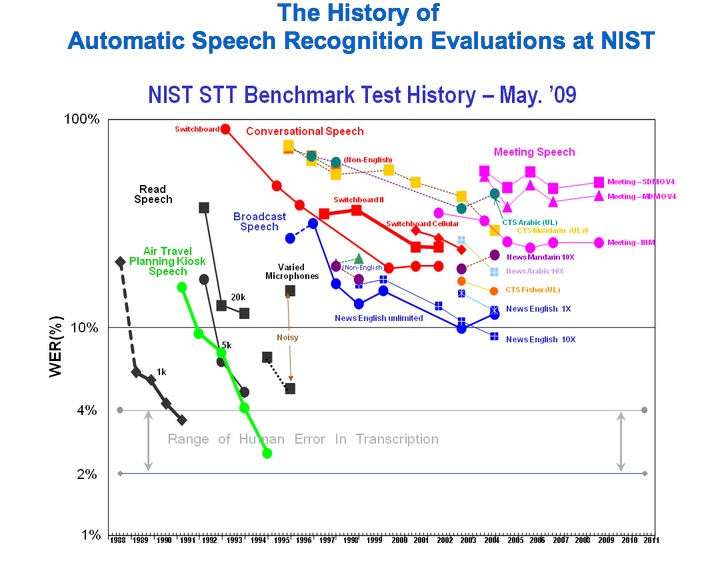](http://aiimpacts.org/wp-content/uploads/2017/03/Page-47-Image-1832.png) [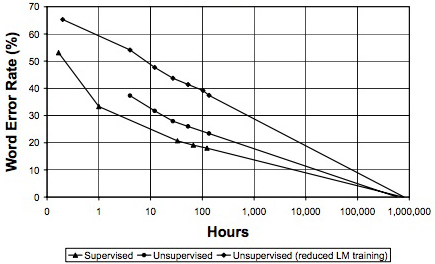](http://aiimpacts.org/wp-content/uploads/2017/03/Page-48-Image-1833.png) [](http://aiimpacts.org/wp-content/uploads/2017/03/Page-48-Image-1834.png) [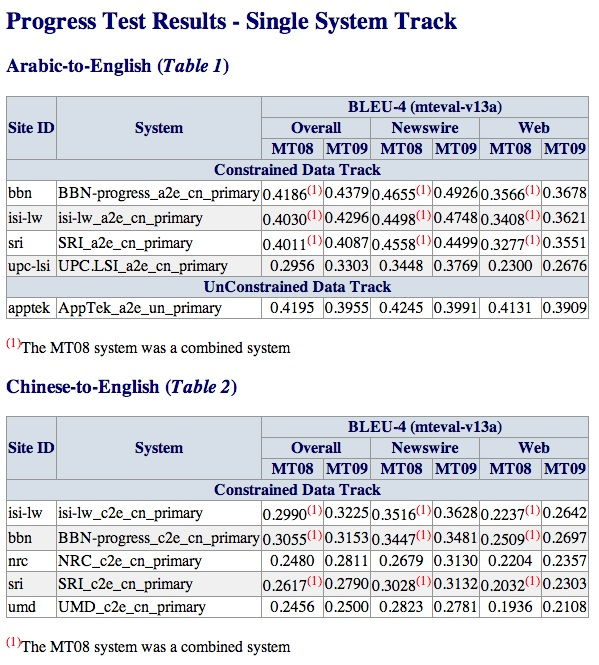](http://aiimpacts.org/wp-content/uploads/2017/03/Page-49-Image-1835.png) [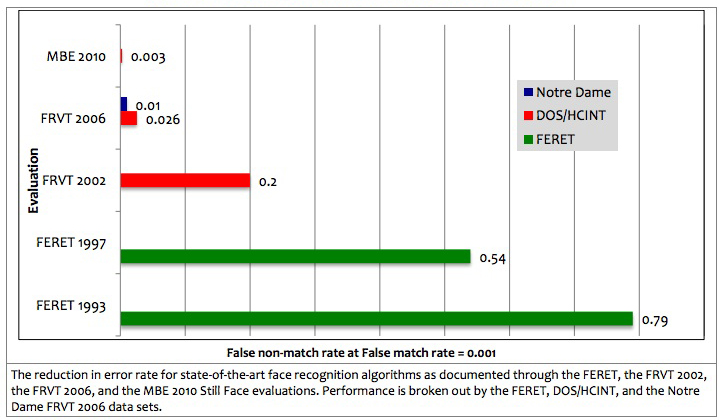](http://aiimpacts.org/wp-content/uploads/2017/03/Page-50-Image-1836.png) [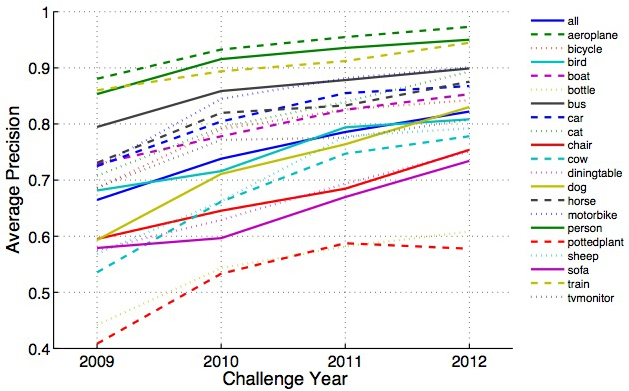](http://aiimpacts.org/wp-content/uploads/2017/03/Page-51-Image-1837.png) [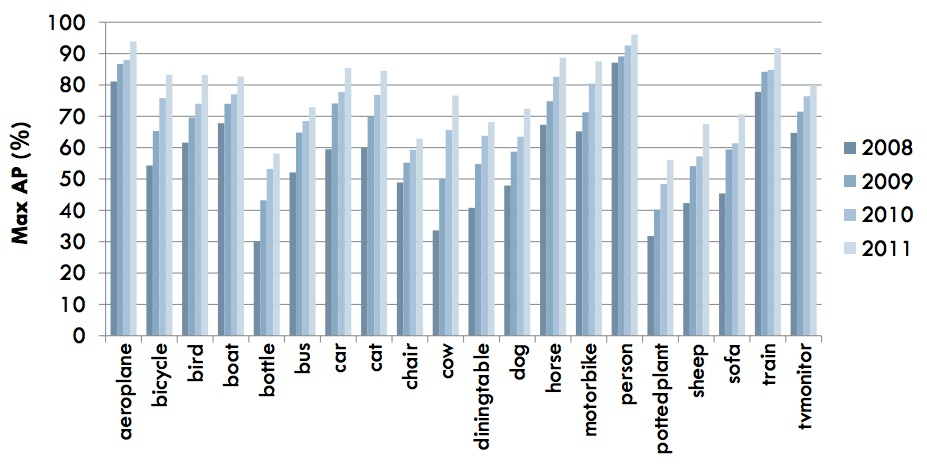](http://aiimpacts.org/wp-content/uploads/2017/03/Page-51-Image-1838.png) [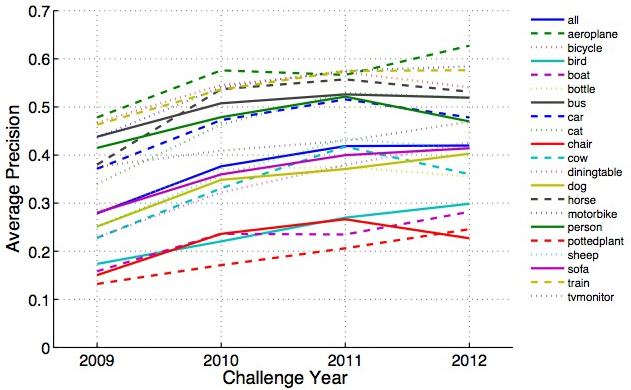](http://aiimpacts.org/wp-content/uploads/2017/03/Page-52-Image-1839.png) [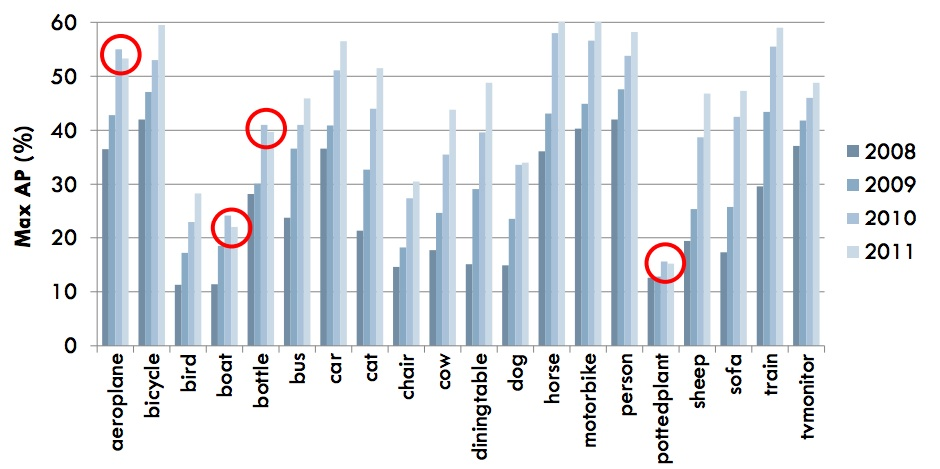](http://aiimpacts.org/wp-content/uploads/2017/03/Page-52-Image-1840.png) [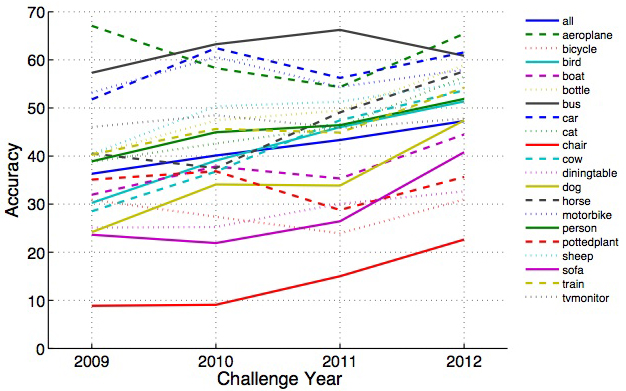](http://aiimpacts.org/wp-content/uploads/2017/03/Page-53-Image-1841.png) [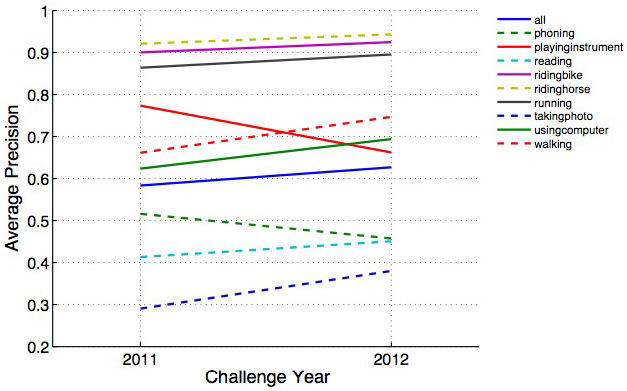](http://aiimpacts.org/wp-content/uploads/2017/03/Page-53-Image-1842.png) [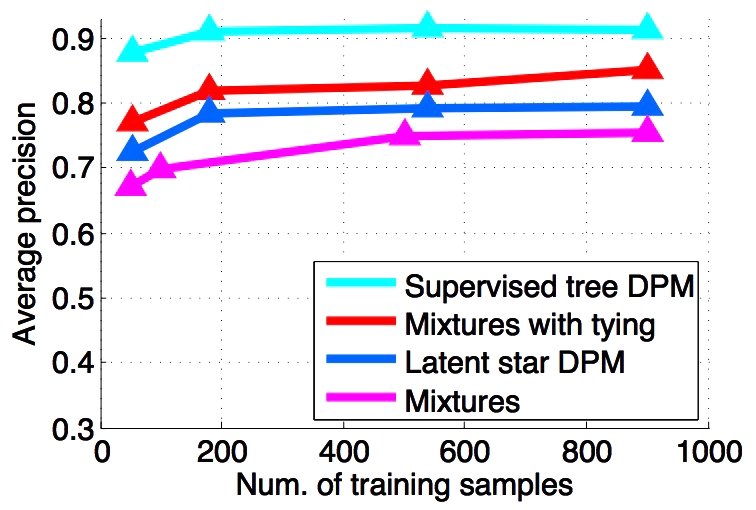](http://aiimpacts.org/wp-content/uploads/2017/03/Page-54-Image-1843.png) [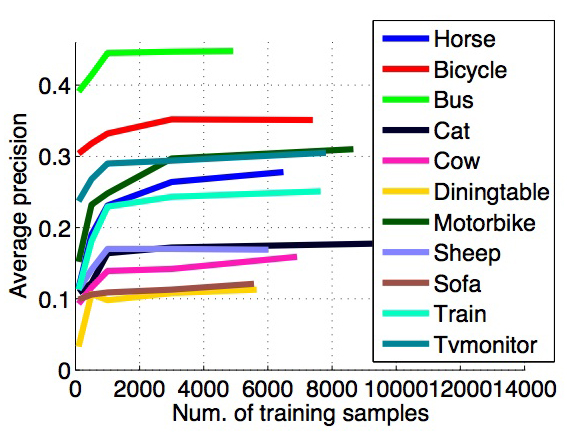](http://aiimpacts.org/wp-content/uploads/2017/03/Page-54-Image-1844.png)\n\n", "url": "https://aiimpacts.org/trends-in-algorithmic-progress/", "title": "Trends in algorithmic progress", "source": "aiimpacts.org", "source_type": "wordpress", "date_published": "2017-03-02T07:03:26+00:00", "paged_url": "https://aiimpacts.org/feed?paged=16", "authors": ["Katja Grace"], "id": "484f27c4775b78a72e4a7fa0f7c4adcf", "summary": []}
{"text": "Changes in funding in the AI safety field\n\n*Guest post by Seb Farquhar, originally posted to the [Center for Effective Altruism blog](https://www.centreforeffectivealtruism.org/blog/changes-in-funding-in-the-ai-safety-field). 20 February 2017*\n\n\nThe field of AI Safety has been growing quickly over the last three years, since the publication of “Superintelligence”. One of the things that shapes what the community invests in is an impression of what the composition of the field currently is, and how it has changed. Here, I give an overview of the composition of the field as measured by its funding.\n\n\nMeasures other than funding also matter, and may matter more, like types of outputs, distribution of employed/active people, or impact-adjusted distributions of either. Funding, however, is a little more objective and easier to assess. It gives us some sense of how the AI Safety community is prioritising, and where it might have blind spots. For a fuller discussion of the shortcomings of this type of analysis, and of this data, see section four.\n\n\nThroughout, I am including the budgets of organisations who are explicitly working to reduce existential risk from machine superintelligence. It does not include work outside the AI Safety community, on areas like verification and control, that might prove relevant. This kind of work, which happens in mainstream computer science research, is much harder to assess for relevance and to get budget data for. I am trying as much as possible to count money spent at the time of the work, rather than the time at which a grant is announced or money is set aside.\n\n\nThanks to Niel Bowerman, Ryan Carey, Andrew Critch, Daniel Dewey, Viktoriya Krakovna, Peter McIntyre, Michael Page for their comments or help on content or gathering data in preparing this document (though nothing here should be taken as a statement of their views and any errors are mine).\n\n\nThe post is organised as follows:\n\n\n1. Narrative of growth in AI Safety funding\n2. Distribution of spending\n3. Soft conclusions from overview\n4. Caveats and assumptions\n\n\nNarrative of growth in AI Safety funding\n----------------------------------------\n\n\nThe AI Safety community grew significantly in the last three years. In 2014, AI Safety work was almost entirely done at the Future of Humanity Institute (FHI) and the Machine Intelligence Research Institute (MIRI) who were between them spending $1.75m. In 2016, more than 50 organisations have explicit AI Safety related programs, spending perhaps $6.6m. Note the caveats to all numbers in this document described in section 4.\n\n\n[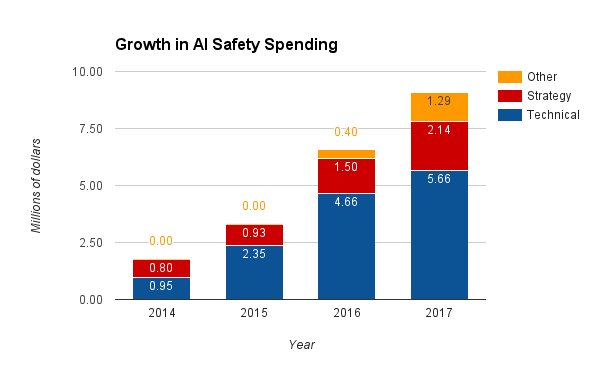](http://aiimpacts.org/wp-content/uploads/2017/02/chart.png)\n\n\nIn 2015, AI Safety spending roughly doubled to $3.3m. Most of this came from growth at MIRI and the beginnings of involvement by industry researchers.\n\n\nIn 2016, grants from the Future of Life Institute (FLI) triggered growth in smaller-scale technical AI safety work.[1](https://aiimpacts.org/changes-in-funding-in-the-ai-safety-field/#easy-footnote-bottom-1-773 \"Although grants were awarded in 2015, there is a lag between grants being awarded and work taking place. This is a significant assumption discussed in the caveats.\") Industry invested more over 2016, specially at Google DeepMind and potentially at OpenAI.[2](https://aiimpacts.org/changes-in-funding-in-the-ai-safety-field/#easy-footnote-bottom-2-773 \"Although note that most of the new hires at DeepMind arrived right at the end of the year.\") Because of their high salary costs, the monetary growth in spending at these firms may overstate actual growth of the field. For example, several key researchers moved from non-profits/academic orgs (MIRI, FLI, FHI) to Google DeepMind and OpenAI. This increased spending significantly, but may have had a smaller effect on output.[3](https://aiimpacts.org/changes-in-funding-in-the-ai-safety-field/#easy-footnote-bottom-3-773 \"Although it is also conceivable that a researcher at DeepMind may be ten times more valuable than that same researcher elsewhere.\") AI Strategy budgets grew more slowly, at about 20%.\n\n\nIn 2017, multiple center grants are emerging (such as the Center for Human-Compatible AI (CHCAI) and Center for the Future of Intelligence (CFI)), but if their hiring is slow it will restrain overall spending. FLI grantee projects will be coming to a close over the year, which may mean that technical hires trained through those projects become available to join larger centers. The next round of FLI grants may be out in time to bridge existing grant holders onto new projects. Industry teams may keep growing, but there are no existing public commitments to do so. If technical research consolidates into a handful of major teams, it might make it easier to keep open dialogue between research groups, but might decrease individual incentives to because researchers have enough collaboration opportunities locally.\n\n\nAlthough little can be said about 2018 at this point, the current round of academic grants which support FLI grantees as well as FHI end in 2018, potentially creating a funding cliff. (Though FLI has just announced a second funding round, and MIT Media Lab has just announced a $27m center (whose exact plans remain unspecified).[4](https://aiimpacts.org/changes-in-funding-in-the-ai-safety-field/#easy-footnote-bottom-4-773 \"This will depend on personal circumstance as well as giving opportunities. It would probably be a mistake to forgo time-bounded giving opportunities to cover this cliff, since other sources of funding might be found between now and then.\")\n\n\n**Estimated spending in AI Safety broken down by field of work**\n\n\n[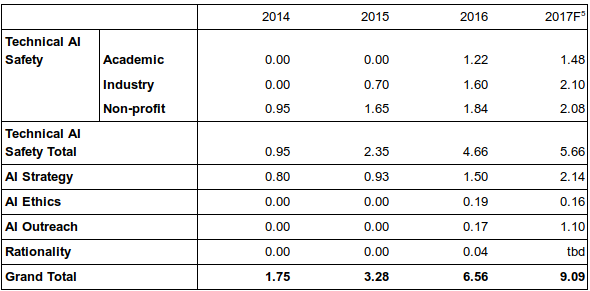](http://aiimpacts.org/wp-content/uploads/2017/02/S__lection_007.png)\n\n\nDistribution of spending\n------------------------\n\n\nIn 2014, the field of research was not very diverse. It was roughly evenly split into work at FHI on macrostrategy, with limited technical work, and at MIRI following a relatively focused technical research agenda which placed little emphasis on deep learning.\n\n\nSince then, the field has diversified significantly.\n\n\nThe academic technical research field is very diverse, though most of the funding comes via FLI. MIRI remains the only non-profit doing technical research and continues to be the largest research group with 7 research fellows at the end of 2016 and a budget of $1.75m. Google DeepMind probably has the second largest technical safety research group with between 3 and 4 full-time-equivalent (FTE) researchers at the end of 2016 (most of whom joined at the end of the year), though OpenAI and GoogleBrain probably have 0.5-1.5 FTEs.[5](https://aiimpacts.org/changes-in-funding-in-the-ai-safety-field/#easy-footnote-bottom-5-773 \"This is based on anecdotal hiring information, and not a confirmed number from Google DeepMind.\")\n\n\nFHI and SAIRC remains the only large-scale AI strategy center. The Global Catastrophic Risk Institute is the main long-standing strategy center working on AI, but is much smaller. Some much smaller groups (FLI Grantees and the Global Politics of AI team at Yale) are starting to form, but are mostly low-/no- salary for the time being.\n\n\nA range of functions are now being filled which did not exist in the AI Safety community before. These include outreach, ethics research, and rationality training. Although explicitly outreach focused projects remain small, organisations like FHI and MIRI do significant outreach work (arguably, Nick Bostrom’s *Superintelligence* falls into this category, for example).\n\n\n**2017 (forecast) – total = $10.5m**\n\n\n[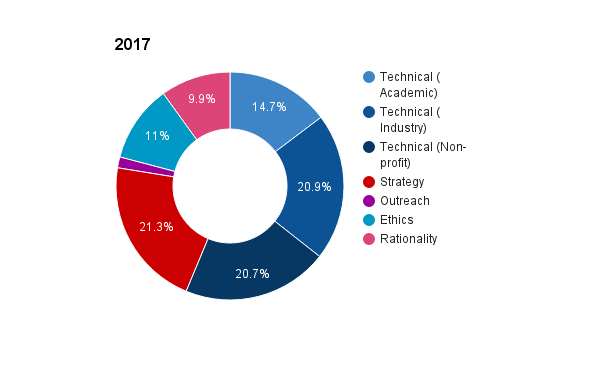](http://aiimpacts.org/wp-content/uploads/2017/02/chart-1.png)\n\n\n**2016 – total = $6.56m**\n\n\n[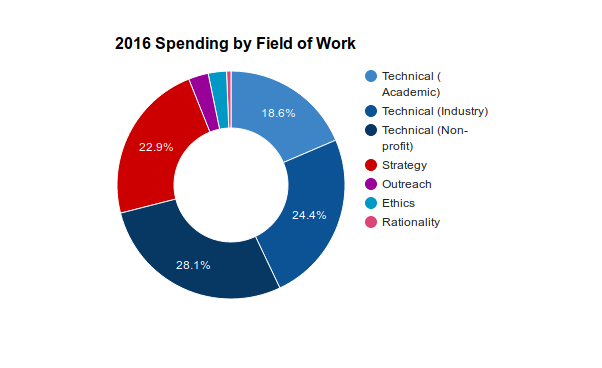](http://aiimpacts.org/wp-content/uploads/2017/02/S__lection_012.png)\n\n\n**2015 – total = $3.28m**\n\n\n[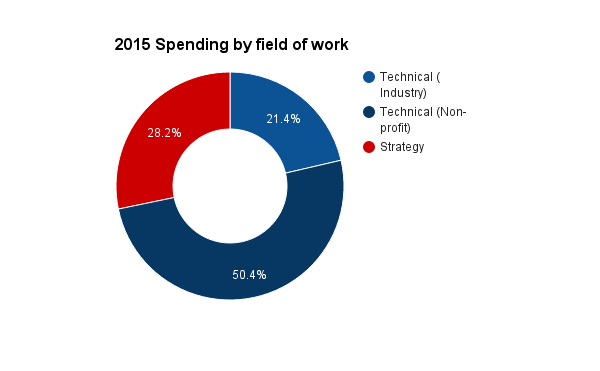](http://aiimpacts.org/wp-content/uploads/2017/02/chart-2.png)\n\n\n**2014 – total = $1.75m**\n\n\n[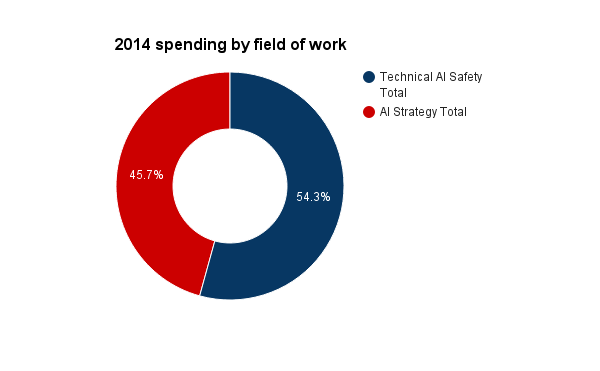](http://aiimpacts.org/wp-content/uploads/2017/02/chart-3.png)\n\n\nPossible implications and tentative suggestions\n-----------------------------------------------\n\n\nTechnical safety research\n\n\n* The MIRI technical agenda remains the largest coherent research project, despite the emergence of several other agendas. For the sake of diversity of approach, more work needs to be done to develop PIs within the AI community to take the [“Concrete Problems](https://arxiv.org/abs/1606.06565)” research agenda and others forwards.\n* The community should go out of its way to help the emerging academic technical research centers (CHCAI and Yoshua Bengio’s forthcoming center) to recruit and retain fantastic people.\n\n\nStrategy, outreach, and policy\n\n\n* Near-term policy has had a lot of people outside the AI Safety community moving towards it, though output remains relatively low. There is even less work on medium-term implications of AI.\n* Non-technical funding has not kept up with the growth of the AI safety field as a whole. This is likely to be because the pipeline for non-technical work is less easily specified and improved than it is for technical work. This could create gaps in the future, for example in:\n* Communication channels between AI Safety research teams.\n* Communication between the AI Safety research community and the rest of the AI community.\n* Guidance for policy-makers and researchers on long-run strategy.\n* It might be helpful to establish or identify a pipeline for AI strategy/policy work, perhaps by building a PhD or Masters course at an existing institution for the purpose.\n* There is not a lot of focused AI Safety outreach work. This is largely because all organisations are stepping carefully to avoid messaging that has the potential to frame the issues unconstructively, but it might be worthwhile to step into this gap over the next year or two.\n\n\nCaveats and assumptions\n-----------------------\n\n\n* **Scope**: I selected projects that either self-identify or were identified to me by people in the field as focused on AI Safety. Where organisations had only a partial focus on AI Safety, I estimated the proportion of their work that was related based on the distribution of their projects. The data probably represent the community of people who explicitly think they are working on AI safety moderately-well. But it **doesn’t include anyone generally working on verification/control, auditing, transparency**, etc. for other reasons. It also excludes people working on near-term AI policy.\n* **Forecasting**: Data for 2017 are a very loose guess. In particular, they make very rough guesses for the ability of centers to scale up, which have not been validated by interviews with centers. CFAR financial estimates for 2017 are also still not publicly available, and may be more than 10% of all AI Safety spending. I have assumed, in the pie charts of distribution only, that they will spend $1m next year (they spend $920k in 2015). That estimate is probably too low, but will probably not dramatically alter the overall picture. Forecasts also do not include funding for Yoshua Bengio’s new center or the next round of FLI grants.\n* **FLI grant distribution**: I have assumed that all FLI grantees spent according to the following schedule: nothing in 2015, 37% in 2016, 31% in 2017, 32% later. This is based on aggregate data, but will not be right for individual grants, which might mean the distribution of funding over time between fields is slightly wrong. The values are lagged slightly in order to account for the fact that money usually takes several months to make its way through university bureaucracies. In some cases, work happens at a different time from funding being received (earlier or later).\n* **Industry spending**: Estimates of industry spending are very rough. I approximated the amount of time spent by individual researchers on AI Safety based on conversations with some of them and with non-industry researchers. I (very) loosely approximated the per-researcher cost to firms at $300k each, inclusive of overheads and compute.\n* **Categorisation**: I used the abstracts of the FLI grants, and the websites of other projects, to categorise their work roughly. Some may be miscategorised, but the major chunks of funding are likely to be right.\n* **Funding is not a perfect proxy for what matters**: There are many ways of describing change in the field usefully, which include how funding is distributed. Funding is a moderate proxy for the amount of effort going into different approaches, but not perfect. For example, if a researcher were to move from being lightly funded at a non-profit to employed by OpenAI their ‘cost’ in this model will have increased by roughly an order of magnitude, which might be different from their impact. The funding picture may therefore come apart from ‘effort’ especially when comparing DeepMind/OpenAI/GoogleBrain to non-profits like MIRI.\n* **Re-granting**: I’ve tried to avoid double-counting (e.g., SAIRC is listed as an FHI project rather than FLI despite being funded by Elon Musk and OpenPhil via FLI), but there is enough regranting going on that I might not have succeeded.\n* **Inclusion**: I might have missed out organisations that should arguably be in there, or have incorrect information about their spending\n* **Corrections**: If you have corrections or extra information I should incorporate, please email me at seb@prioritisation.org.\n\n\n\n\n---\n\n\nFootnotes\n---------\n\n", "url": "https://aiimpacts.org/changes-in-funding-in-the-ai-safety-field/", "title": "Changes in funding in the AI safety field", "source": "aiimpacts.org", "source_type": "wordpress", "date_published": "2017-02-20T11:40:52+00:00", "paged_url": "https://aiimpacts.org/feed?paged=16", "authors": ["Katja Grace"], "id": "ce46398706ab716429de595b0a9eee98", "summary": []}
{"text": "Funding of AI Research\n\nProvisional data suggests:\n\n\n* Equity deals made with startups in AI were worth about $5bn in 2016, and this value has been growing by around 50% per year in recent years.\n* The number of equity deals in AI startups globally is growing at around 30% per year, and was estimated at 658 in 2016.\n* NSF funding of IIS, a section of computer science that appears to include AI and two other areas, has increased at around 9% per year over the past two decades.\n\n\n(Updated February 2017)\n\n\nBackground\n----------\n\n\nArtificial Intelligence research is funded both publicly and privately. This page currently contains some data on private funding globally, public funding in the US, and national government announcements of plans relating to AI funding. This page should not currently be regarded as an exhaustive summary of data available on these topics or on AI funding broadly.\n\n\nDetails\n-------\n\n\n### AI startups\n\n\nAccording to [CB Insights](https://www.cbinsights.com/blog/artificial-intelligence-startup-funding/), between the start of 2012 and the end of 2016, the number of equity deals being made with startups in artificial intelligence globally grew by a factor of four to 658 (around 30% per year), and the value of funding grew by a factor of over eight to $5 billion (around 50% per year).[1](https://aiimpacts.org/funding-of-ai-research/#easy-footnote-bottom-1-762 \"“Our analysis includes companies applying AI algorithms to verticals like healthcare, security, advertising, and finance as well as those developing general-purpose AI tech. Our list excludes robotics (hardware-focused) and AR/VR startups, which we’ve analyzed separately here and here. Our analysis includes all equity funding rounds and convertible notes. This post was updated on 1/19/2017 to include deals through the end of 2016….Deals reached a 5-year high last year, from 160 deals in 2012 to 658 in 2016. Dollars invested also rose considerably in 2016, up about 60%.” – CB Insights, https://www.cbinsights.com/blog/artificial-intelligence-startup-funding/ (See also Figure 1)\") Their measure includes both startups developing AI techniques, and those applying existing AI techniques to problems in areas such as healthcare or advertising. They provide Figure 1 below, with further details of the intervening years. We have not checked the trustworthiness or completeness of CB Insights’ data.\n\n\n[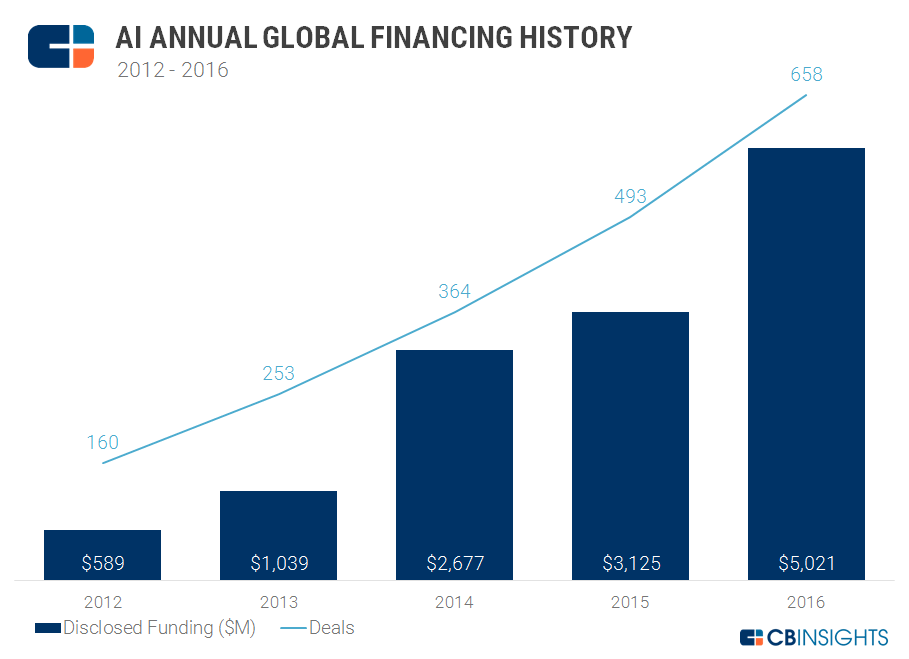](http://aiimpacts.org/wp-content/uploads/2017/02/AI_2016_yearly-CBI-1.png)Figure 1: Number of new equity deals supporting AI-related startups, and dollar values of disclosed investments over 2012-2015, according to [CB Insights](https://www.cbinsights.com/blog/artificial-intelligence-startup-funding/).\n\n\n### US National Science Foundation\n\n\nIn 2014, [Muehlhauser and Sinick](https://intelligence.org/2014/01/28/how-big-is-ai/) wrote:\n\n\n\n> In 2011, the National Science Foundation (NSF) received $636 million for funding CS research (through [CISE](http://www.nsf.gov/dir/index.jsp?org=CISE)). Of this, $169 million [went to](http://www.nsf.gov/about/budget/fy2013/pdf/06-CISE_fy2013.pdf) Information and Intelligent Systems (IIS). IIS has [three programs](http://www.nsf.gov/funding/pgm_summ.jsp?pims_id=13707&org=IIS&from=home): Cyber-Human Systems (CHS), Information Integration and Informatics (III) and Robust Intelligence (RI). If roughly 1/3 of the funding went to each of these, then $56 million went to Robust Intelligence, so 9% of the total CS funding. (Some CISE funding may have gone to AI work outside of IIS — that is, via [ACI](http://www.nsf.gov/div/index.jsp?div=ACI), [CCF](http://www.nsf.gov/div/index.jsp?div=CCF), or [CNS](http://www.nsf.gov/div/index.jsp?div=CNS) — but at a glance, non-IIS AI funding through CISE looks negligible.)\n> \n> \n> …\n> \n> \n> The NSF Budget for Information and Intelligent Systems (IIS) has generally increased between 4% and 20% per year since 1996, with a one-time percentage boost of 60% in 2003, for a total increase of 530% over the 15 year period between 1996 and 2011.[14 {See table with upper left-hand corner A367 in the [spreadsheet](https://intelligence.org/wp-content/uploads/2014/01/Current-size-past-growth-of-the-AI-field.xlsx).}] “Robust Intelligence” is one of three program areas covered by this budget.\n> \n> \n\n\nAs of February 2017, CISE (Computer and Information Science and Engineering) covers five categories, and IIS appears to be the most relevant one.[2](https://aiimpacts.org/funding-of-ai-research/#easy-footnote-bottom-2-762 \"“…IIS also invests in research on artificial intelligence, computer vision, natural language processing, robotics, machine learning, computational neuroscience, cognitive science, and areas leading to the computational understanding and modeling of intelligence in complex, realistic contexts.” – CISE Funding, Directorate for Computer and Information Science and Engineering (CISE).\") IIS still has three programs, of which Robust Intelligence is one.[3](https://aiimpacts.org/funding-of-ai-research/#easy-footnote-bottom-3-762 \"CISE’s Division of Information and Intelligent Systems (IIS) supports research and education projects that develop new knowledge in three core programs:
- \n
- The Cyber-Human Systems (CHS) program; \n
- The Information Integration and Informatics (III) program; and \n
- The Robust Intelligence (RI) program. \n
– Information and Intelligent Systems (IIS): Core Programs\")\n\n\nNSF funding into both CISE and IIS (the relevant subcategory) from 2009 to 2017 shows a steady rise.[4](https://aiimpacts.org/funding-of-ai-research/#easy-footnote-bottom-4-762 \"NSF Budget:
\nhttp://www.nsf.gov/about/budget/fy2017/pdf/18_fy2017.pdf
\nhttps://www.nsf.gov/about/budget/fy2016/pdf/18_fy2016.pdf
\nhttp://www.nsf.gov/about/budget/fy2015/pdf/18_fy2015.pdf
\nhttps://www.nsf.gov/about/budget/fy2014/pdf/18_fy2014.pdf
\nhttp://www.nsf.gov/about/budget/fy2013/pdf/06-CISE_fy2013.pdf
\nhttps://www.nsf.gov/about/budget/fy2012/pdf/17_fy2012.pdf
\nhttps://www.nsf.gov/about/budget/fy2011/pdf/06-CISE_fy2011.pdf\") IIS funding as a percentage of CISE funding fluctuates, and has gone down in this time period. The following table summarizes data from NSF, collected by Finan Adamson in 2016. The figures below it (2 and 3) combine this data with some collected previously in this [spreadsheet](https://intelligence.org/wp-content/uploads/2014/01/Current-size-past-growth-of-the-AI-field.xlsx) linked by [Muehlhauser and Sinick](https://intelligence.org/2014/01/28/how-big-is-ai/). Over 21 years, IIS funding has increased fairly evenly, at 9% per year overall.\n\n\n\n\n| | | | |\n| --- | --- | --- | --- |\n| Fiscal Year | IIS (Information and Intelligent Systems) Funding\nIn Millions of $ | Total CISE (Computer and Information Science and Engineering Funding in Millions of $ | IIS Funding as a % of total CISE Funding |\n| 2017 (Requested) | 207.20 | 994.80 | 20.8 |\n| 2016 (Estimate) | 194.90 | 935.82 | 20.8 |\n| 2015 (Actual) | 194.58 | 932.98 | 20.9 |\n| 2014 (Actual) | 184.87 | 892.60 | 20.7 |\n| 2013 (Actual) | 176.23 | 858.13 | 20.5 |\n| 2012 (Actual) | 176.58 | 937.16 | 18.8 |\n| 2011 (Actual) | 169.14 | 636.06 | 26.5 |\n| 2010 (Actual) | 163.21 | 618.71 | 26.4 |\n| 2009 (Actual) | 150.93 | 574.50 | 26.3 |\n\n\n### \n\n\n[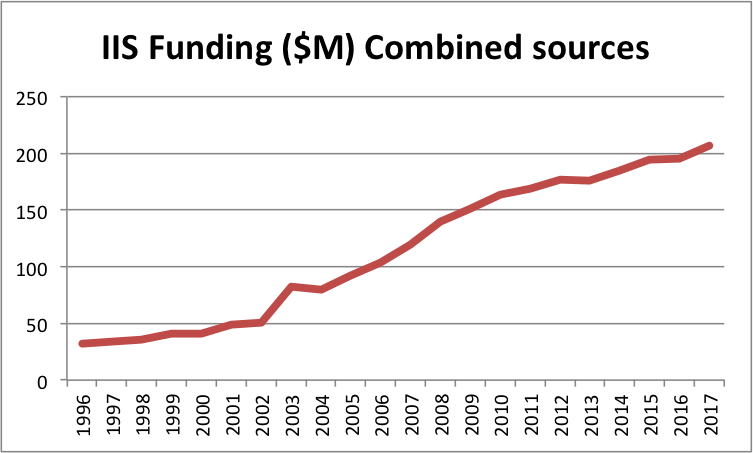](http://aiimpacts.org/wp-content/uploads/2017/02/IIS-funding-combined-sources.png)Figure 2: Annual NSF funding to IIS.\n\n\n[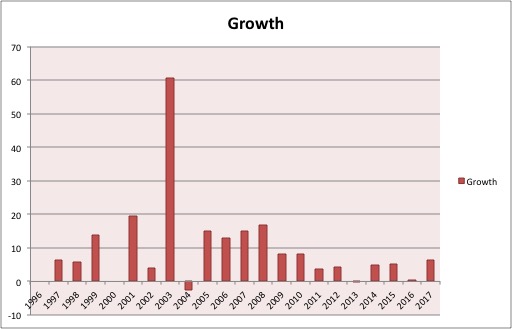](http://aiimpacts.org/wp-content/uploads/2017/02/IIS-funding-growth.jpg)Figure 3: Yearly growth in NSF funding to IIS.\n\n\n### National governments\n\n\n#### US\n\n\nOn May, 3 2016 white house Deputy U.S. Chief Technology Officer Ed Felten announced a series of workshops and an interagency group to learn more about the benefits and risks of artificial intelligence.[5](https://aiimpacts.org/funding-of-ai-research/#easy-footnote-bottom-5-762 \"White House Office of Science and Technology Policy, https://www.whitehouse.gov/blog/2016/05/03/preparing-future-artificial-intelligence\")\n\n\nThe Pentagon intended to include a request for $12-15 Billion to fund AI weapon technology in its 2017 fiscal year budget.[6](https://aiimpacts.org/funding-of-ai-research/#easy-footnote-bottom-6-762 \"Business Insider, http://www.businessinsider.com/the-pentagon-wants-at-least-12-billion-to-fund-ai-weapon-technology-in-2017-2015-12\")\n\n\n#### Japan\n\n\nMs. Kurata from the Embassy of Japan introduced Japan’s fifth Science and Technology Basic Plan, a ¥26 trillion government investment that will run between 2016-2020 and aims to promote R&D to establish a super smart society.[7](https://aiimpacts.org/funding-of-ai-research/#easy-footnote-bottom-7-762 \"UK-RAS Network, http://hamlyn.doc.ic.ac.uk/uk-ras/news/japan-uk-collaboration\")\n\n\n#### China\n\n\nThe Chinese government announced in 2016 that it plans to create a “100 billion level” ($15 billion USD) artificial intelligence market by 2018. In their statement, the Chinese government defined artificial intelligence as a “branch of computer science where machines have human-like intelligence” and includes robots, natural language processing, and image recognition.[8](https://aiimpacts.org/funding-of-ai-research/#easy-footnote-bottom-8-762 \"Technode, http://technode.com/2016/05/27/chinese-goverment-wants-100-billion-level-artificial-intelligence-market-2018/\")\n\n\n#### South Korea\n\n\nThe South Korean government announced on March 17, 2016 that it would spend 1 trillion won (US$840 million) by 2020 on Artificial Intelligence. They plan to fund a high profile research center joined by Samsung and LG Electronics, SKT, KT, Naver and Hyundai Motor.[9](https://aiimpacts.org/funding-of-ai-research/#easy-footnote-bottom-9-762 \"Yonhap News Agency, http://english.yonhapnews.co.kr/news/2016/03/17/0200000000AEN20160317003751320.html\")\n\n\nRelevance\n---------\n\n\nFinancial investment in AI research is interesting because as an input to AI progress, it may help in forecasting progress. To further that goal, we are also interested in examining the relationship of funding to progress.\n\n\nInvestment can also be read as an indicator of investors’ judgments of the promise of AI.\n\n\nNotable missing data\n--------------------\n\n\n* Private funding of AI other than equity deals.\n* Public funding of AI research in relevant nations other than the US.\n* Funding for internationally collaborative AI projects.\n\n\n\n\n\n---\n\n\n \n\n", "url": "https://aiimpacts.org/funding-of-ai-research/", "title": "Funding of AI Research", "source": "aiimpacts.org", "source_type": "wordpress", "date_published": "2017-02-20T11:25:13+00:00", "paged_url": "https://aiimpacts.org/feed?paged=16", "authors": ["Katja Grace"], "id": "cafae8d9b5632d166ae8fa66e4574f51", "summary": []}
{"text": "2016 Expert Survey on Progress in AI\n\n*Published June 2016; last substantial update before Oct 2017*\n\n\nThe 2016 Expert Survey on Progress in AI is a survey of machine learning researchers that Katja Grace and John Salvatier of AI Impacts ran in collaboration with Allan Dafoe, Baobao Zhang, and Owain Evans in 2016.\n\n\nDetails\n-------\n\n\nSome survey results are reported in *[When Will AI Exceed Human Performance? Evidence from AI Experts](https://arxiv.org/abs/1705.08807)*. This page reports on results from those questions more fully, and results from some questions not included in the paper.\n\n\nThe full list of survey questions is available [here](http://aiimpacts.org/2016-esopai-questions-printout/) ([pdf](https://www.dropbox.com/s/99os4grxlhf744m/Final%202016%20Expert%20Survey%20on%20Progress%20in%20AI.pdf?dl=0)). Participants received randomized subsets of these questions.\n\n\n### Definitions\n\n\nThroughout the survey, ‘HLMI’ was defined as follows:\n\n\n\n> \n> The following questions ask about ‘high–level machine intelligence’ (HLMI). Say we have ‘high-level machine intelligence’ when unaided machines can accomplish every task better and more cheaply than human workers. Ignore aspects of tasks for which being a human is intrinsically advantageous, e.g. being accepted as a jury member. Think feasibility, not adoption.\n> \n> \n> \n\n\n### Summary of results\n\n\nBelow is a table of summary results from the paper (the paper contains more results).\n\n\n[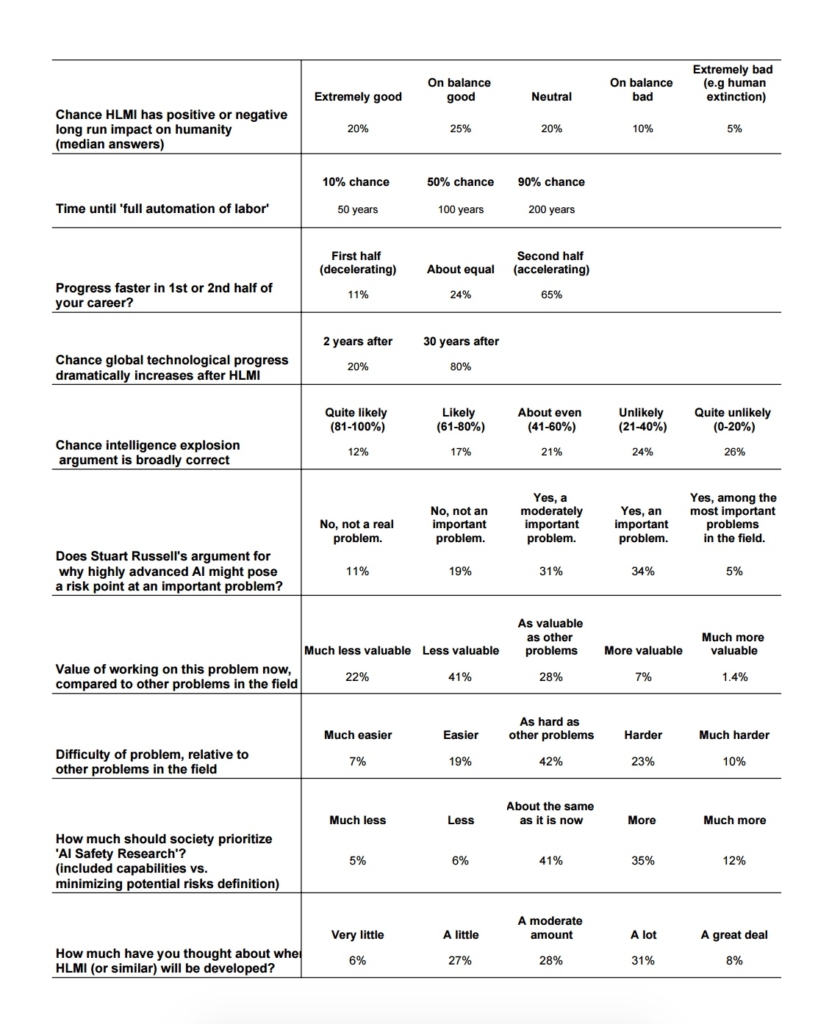](http://aiimpacts.org/wp-content/uploads/2016/12/survey-summary.jpeg)***Table S4 in [Grace et al 2017](https://arxiv.org/abs/1705.08807).***\nSome key interesting results, from our [blog post](http://aiimpacts.org/some-survey-results/):\n\n\n* **Comparable forecasts seem to be later than in past surveys.** in the [other surveys we know of](http://aiimpacts.org/ai-timeline-surveys/), the median dates for a 50% chance of [something like](http://aiimpacts.org/human-level-ai/) High-Level Machine Intelligence (HLMI) range from 2035 to 2050. Here the median answer to the most similar question puts a 50% chance of HLMI in 2057 (this isn’t in the paper—it is just the median response to the HLMI question asked using the ‘fixed probabilities framing’, i.e. the way it has been asked before). This seems surprising to me given the progress machine learning has seen since last survey, but less surprising because we changed the definition of HLMI, in part fearing it had previously been interpreted to mean a relatively low level of performance.\n* **Asking people about specific jobs massively changes HLMI forecasts.** When we asked some people when AI would be able to do several specific human occupations, and then all human occupations (presumably a subset of all tasks), they gave very much later timelines than when we just asked about HLMI straight out. For people asked to give probabilities for certain years, the difference was a factor of a thousand twenty years out! (10% vs. 0.01%) For people asked to give years for certain probabilities, the normal way of asking put 50% chance 40 years out, while the ‘occupations framing’ put it 90 years out. (These are all based on straightforward medians, not the complicated stuff in the paper.)\n* **People consistently give later forecasts if you ask them for the probability in N years instead of the year that the probability is M.** We saw this in the straightforward HLMI question, and most of the tasks and occupations, and also in most of these things when we tested them on mturk people earlier. For HLMI for instance, if you ask when there will be a 50% chance of HLMI you get a median answer of 40 years, yet if you ask what the probability of HLMI is in 40 years, you get a median answer of 30%.\n* **Lots of ‘narrow’ AI milestones are forecast in the next decade as likely as not.** These are interesting, because most of them haven’t been forecast before to my knowledge, and many of them have social implications. For instance, if in a decade machines can not only write pop hits as well as Taylor Swift can, but can write pop hits that sound like Taylor Swift as well as Taylor Swift can—and perhaps faster, more cheaply, and on Spotify—then will that be the end of the era of superstar musicians? This perhaps doesn’t rival human extinction risks for importance, but human extinction risks do not happen in a vacuum ([except one](https://en.wikipedia.org/wiki/False_vacuum#Vacuum_metastability_event)), and there is something to be said for paying attention to big changes in the world other than the one that matters most.\n* **There is broad support among ML researchers for the premises and conclusions of AI safety arguments.** Two thirds of them say the AI risk problem described by Stuart Russell is at least moderately important, and a third say it is at least as valuable to work on as other problems in the field. The median researcher thinks AI has a one in twenty chance of being extremely bad on net. Nearly half of researchers want to see more safety research than we currently have (compared to only 11% who think we are already prioritizing safety too much). There has been a perception lately that AI risk has become a mainstream concern among AI researchers, but it is hard to tell from voiced opinion whether one is hearing from a loud minority or the vocal tip of an opinion iceberg. So it is interesting to see the perception of widespread support confirmed with survey data.\n* **Researchers’ predictions vary a lot.** This is pretty much what I expected, but it is still important to know. Interestingly (and not in the paper), researchers don’t seem to be aware that their predictions vary a lot. More than half of respondents guess that they disagree ‘not much’ with the typical AI researcher about when HLMI will exist (vs. a moderate amount, or a lot).\n* **Researchers who studied in Asia have much shorter timelines than those who studied in North Amercia.** In terms of the survey’s ‘aggregate prediction’ thing, which is basically a mean, the difference is 30 years (Asia) vs. 74 years (North America). (See p5)\n* I feel like any circumstance where **a group of scientists guesses that the project they are familiar with has a 5% chance of outcomes near ‘human extinction’ levels** **of bad** is worthy of special note, though maybe it is not actually that surprising, and could easily turn out to be misuse of small probabilities or something.\n\n\n### Results\n\n\n#### Human-level intelligence\n\n\n##### Questions\n\n\nWe sought forecasts for something like [human-level AI](http://aiimpacts.org/human-level-ai/) in three different ways, to reduce noise from unknown framing biases:\n\n\n* Directly, using a question much like [Müller and Bostrom’s](http://aiimpacts.org/muller-and-bostrom-ai-progress-poll/), though with a refined definition of High-Level Machine Intelligence (HLMI).\n* At the end of a sequence of questions about the automation of specific human occupations.\n* Indirectly, with an ‘outside view’ approximation: by asking each person how long it has taken to make the progress to date in their subfield, and what fraction of the ground has been covered. This is [Robin Hanson](http://aiimpacts.org/hanson-ai-expert-survey/)‘s approach, which he found suggested much longer timelines than those reached directly.\n\n\nFor the first two of these, we split people in half, and asked one half how many years until a certain chance of the event would obtain, and the other half what the chance was of the event occurring by specific dates. We call these methods ‘fixed probabilities’ and ‘fixed years’ framings throughout.\n\n\nFor the (somewhat long and detailed) specifics of these questions, see [here](http://aiimpacts.org/2016-esopai-questions-printout/) or [here](https://www.dropbox.com/s/99os4grxlhf744m/Final%202016%20Expert%20Survey%20on%20Progress%20in%20AI.pdf?dl=0) (pdf).\n\n\n##### Answers\n\n\nThe table and figure below show the median dates and probabilities given for the direct ‘HLMI’ question, and in the ‘via occupations’ questions, under both the fixed probabilities and fixed years framings.\n\n\n\n\n | years until: | 10% | 50% | 90% | probability by: | 10 years | 20 years | 50 years |\n| | | | | | | | |\n| Truck Driver | 5 | 10 | 20 | | 50% | 75% | 95% |\n| Surgeon | 10 | 30 | 50 | | 5% | 20% | 50% |\n| Retail Salesperson | 5 | 13.5 | 20 | | 30% | 60% | 91.5% |\n| AI Researcher | 25 | 50 | 100 | | 0% | 1% | 10% |\n| Existing occupation among final to be automated | 50 | 100 | 200 | | 0% | 0% | 3.5% |\n| Full Automation of labor | 50 | 90 | 200 | | 0% | 0.01% | 3% |\n| HLMI | 15 | 40 | 100 | | 1% | 10% | >30%\\* (30% in 40y) |\n\n\n\\*Due to a typo, this question asked about 40 years rather than 50 years, so doesn’t match the others.\n\n\n[](http://aiimpacts.org/wp-content/uploads/2017/04/AI-forecasts-by-framing-and-milestone.png)*Figure 1: Median answers to questions about probabilities by dates (‘fixed year’) and dates for probabilities (‘fixed probability’), for different occupations, all current occupations, and all tasks (HLMI).*\nInteresting things to note:\n\n\n* Fixed years framings (‘Fyears —‘, labeled with stars) universally produce later timelines.\n* HLMI (thick blue lines) is logically required to be after full automation of labor (‘Occ’) yet is forecast much earlier than it, and earlier even than the specific occupation ‘AI researcher’.\n* Even the more pessimistic Fyears estimates suggest retail salespeople have a good chance of being automated within 20 years, and are very likely to be within 50.\n\n\n#### Intelligence Explosion\n\n\n##### Probability of dramatic technological speedup\n\n\n###### Question\n\n\nParticipants were asked[1](https://aiimpacts.org/2016-expert-survey-on-progress-in-ai/#easy-footnote-bottom-1-753 \"A small number of respondents may have answered a slightly different version of this question in an initial round, in which case those answers are not included here.\"):\n\n\nAssume that HLMI will exist at some point. How likely do you then think it is that the rate of global technological improvement will dramatically increase (e.g. by a factor of ten) as a result of machine intelligence:\n\n\nWithin **two years** of that point? \\_\\_\\_% chance\n\n\nWithin **thirty years** of that point? \\_\\_\\_% chance\n\n\n###### Answers\n\n\nMedian P(…within **two years**) = 20%\n\n\nMedian P(…within **thirty years**) = 80%\n\n\n##### Probability of superintelligence\n\n\n###### Question\n\n\nParticipants were asked:\n\n\nAssume that HLMI will exist at some point. How likely do you think it is that there will be machine intelligence that is **vastly better** than humans at all professions (i.e. that is vastly more capable or vastly cheaper):\n\n\nWithin **two years** of that point? \\_\\_\\_% chance\n\n\nWithin **thirty years** of that point? \\_\\_\\_% chance\n\n\n###### Answers\n\n\nMedian P(…within **two years**) = 10%\n\n\nMedian P(…within **thirty years**) = 50%\n\n\nThis is the distribution of answers to the former:\n\n\n[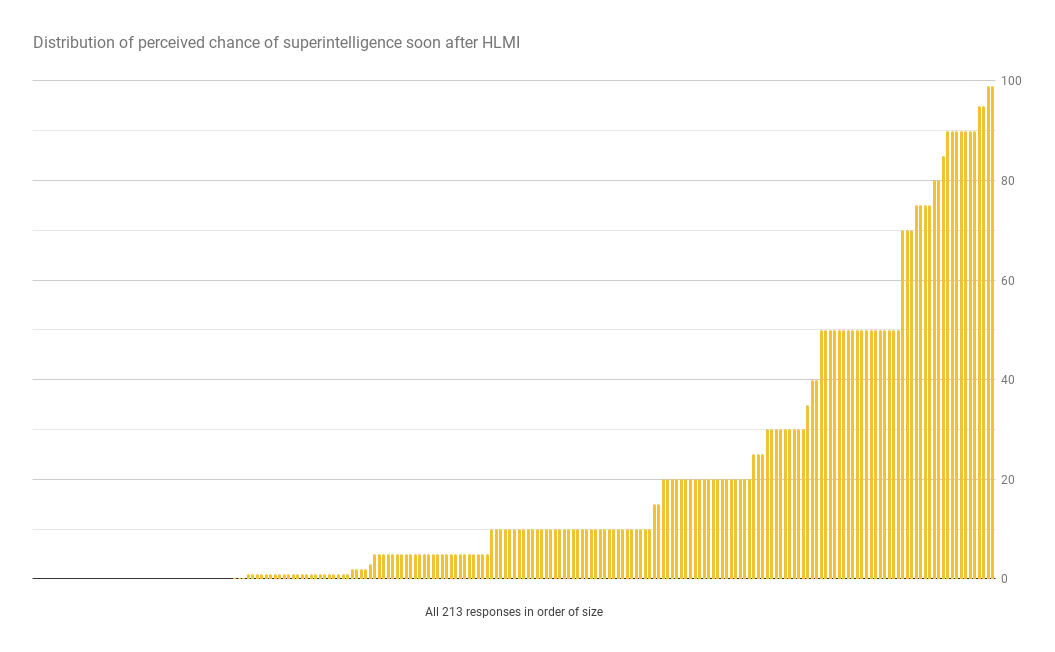](http://aiimpacts.org/wp-content/uploads/2017/04/ESOPAI-2ySuper-distribution.png)\n\n\n##### Chance that the intelligence explosion argument is about right\n\n\n###### Question\n\n\nParticipants were asked:\n\n\nSome people have argued the following:\n\n\n\n> \n> If AI systems do nearly all research and development, improvements in AI will accelerate the pace of technological progress, including further progress in AI.\n> \n> \n> .\n> \n> \n> Over a short period (less than 5 years), this feedback loop could cause technological progress to become more than an order of magnitude faster.\n> \n> \n> \n\n\nHow likely do you find this argument to be broadly correct?\n\n\n* + Quite unlikely (0-20%)\n\t+ Unlikely (21-40%)\n\t+ About even chance (41-60%)\n\t+ Likely (61-80%)\n\t+ Quite likely (81-100%)\n\n\n###### Answers\n\n\n[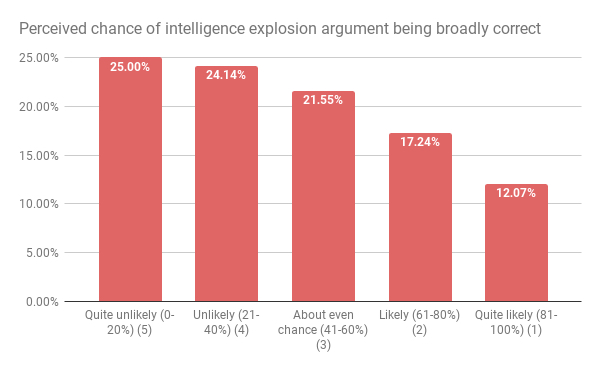](http://aiimpacts.org/wp-content/uploads/2017/04/High-quality-perception-of-ie-rightness.jpg)\n\n\nThese are the Pearson product-moment correlation coefficients for the different answers, among people who received both of a pair of questions:\n\n\n[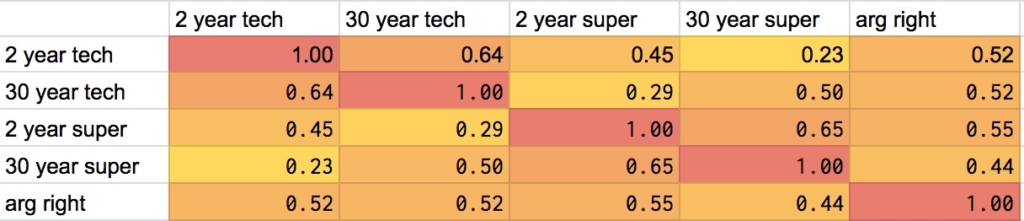](http://aiimpacts.org/wp-content/uploads/2017/04/ESOPAI-correlations-ie.jpeg)\n\n\n#### Impacts of HLMI\n\n\n##### Question\n\n\nParticipants were asked:\n\n\nAssume for the purpose of this question that HLMI will at some point exist. How positive or negative do you expect the overall impact of this to be on humanity, in the long run? Please answer by saying how probable you find the following kinds of impact, with probabilities adding to 100%:\n\n\n\\_\\_\\_\\_\\_\\_ Extremely good (e.g. rapid growth in human flourishing) (1)\n\n\n\\_\\_\\_\\_\\_\\_ On balance good (2)\n\n\n\\_\\_\\_\\_\\_\\_ More or less neutral (3)\n\n\n\\_\\_\\_\\_\\_\\_ On balance bad (4)\n\n\n\\_\\_\\_\\_\\_\\_ Extremely bad (e.g. human extinction) (5)\n\n\n##### Answers\n\n\n[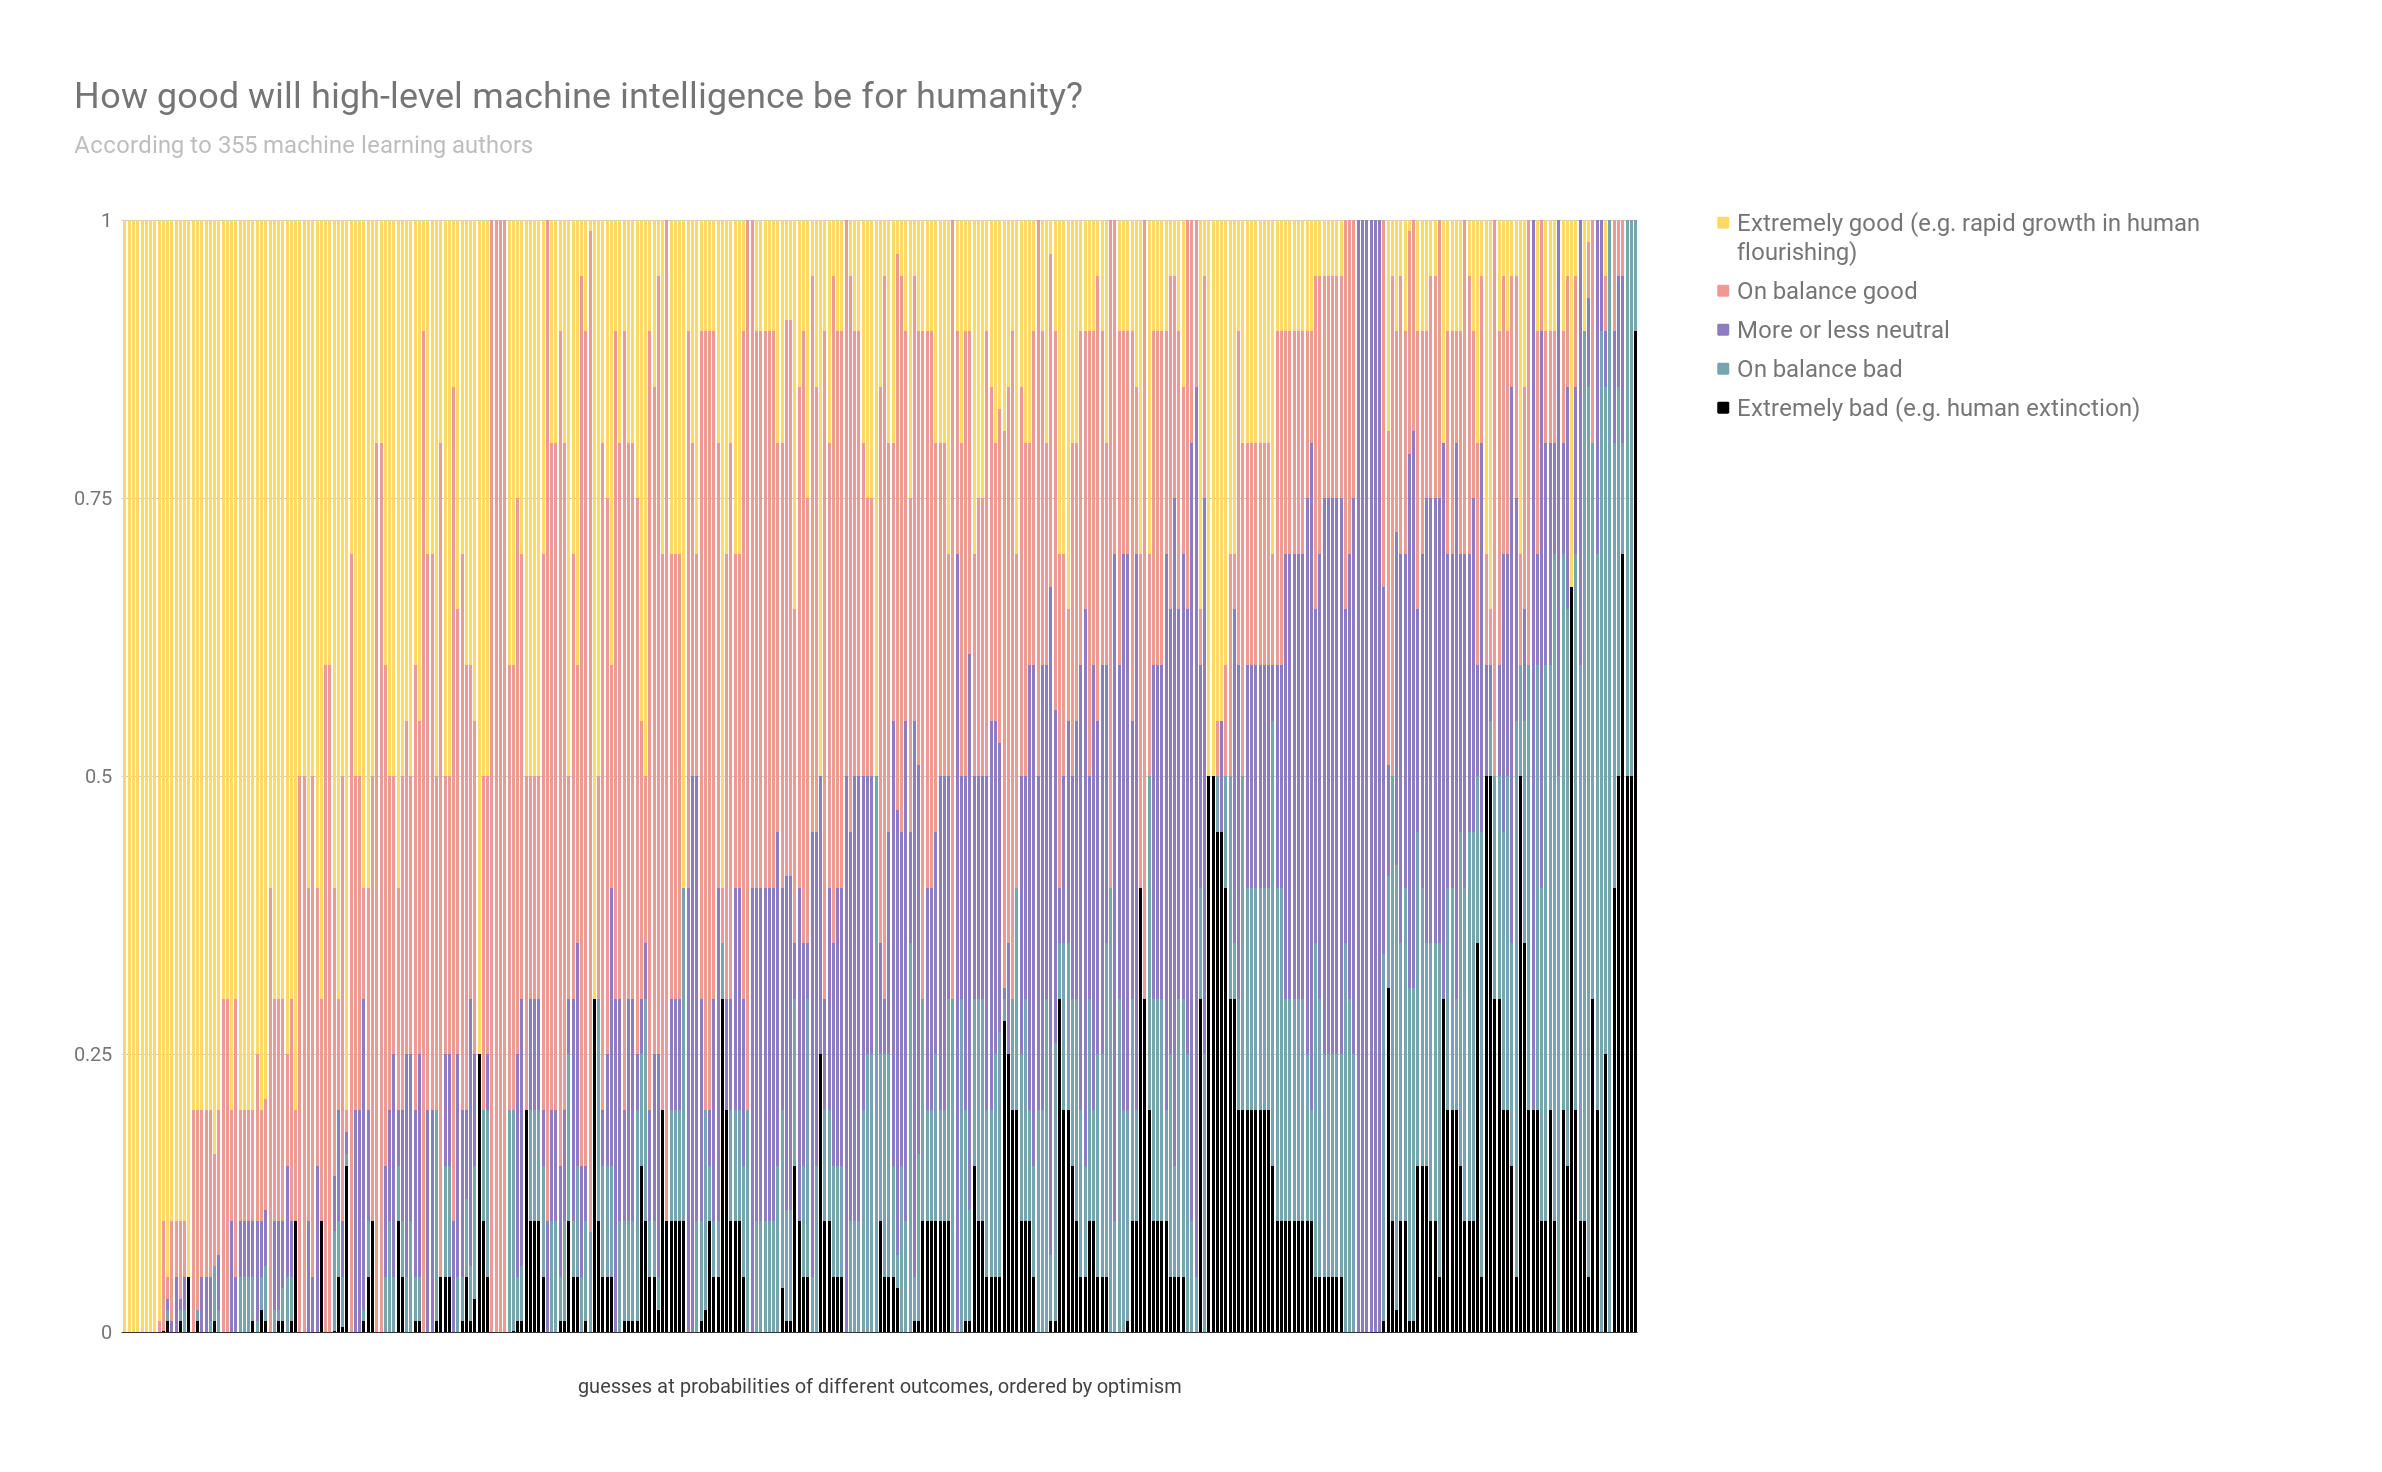](http://aiimpacts.org/wp-content/uploads/2017/04/ESOPAI-value.png)\n\n\n#### Sensitivity of progress to changes in inputs\n\n\n##### Question\n\n\nParticipants were told:\n\n\nThe next questions ask about the sensitivity of progress in AI capabilities to changes in inputs.\n\n\n‘Progress in AI capabilities’ is an imprecise concept, so we are asking about progress as you naturally conceive of it, and looking for approximate answers.\n\n\nParticipants then received a random three of the following five parts:\n\n\nImagine that over the past decade, only half as much researcher effort had gone into AI research. For instance, if there were actually 1,000 researchers, imagine that there had been only 500 researchers (of the same quality).How much less progress in AI capabilities would you expect to have seen? e.g. If you think progress is linear in the number of researchers, so 50% less progress would have been made, write ’50’. If you think only 20% less progress would have been made write ’20’.\n\n\n……% less\n\n\nOver the last 10 years the cost of computing hardware has fallen by a factor of 20. Imagine instead that the cost of computing hardware had fallen by only a factor of 5 over that time (around half as far on a log scale). How much less progress in AI capabilities would you expect to have seen? e.g. If you think progress is linear in 1/cost, so that 1-5/20=75% less progress would have been made, write ’75’. If you think only 20% less progress would have been made write ’20’.\n\n\n……% less\n\n\nImagine that over the past decade, there had only been half as much effort put into increasing the size and availability of training datasets. For instance, perhaps there are only half as many datasets, or perhaps existing datasets are substantially smaller or lower quality.How much less progress in AI capabilities would you expect to have seen? e.g. If you think 20% less progress would have been made, write ‘20’\n\n\n……% less\n\n\nImagine that over the past decade, AI research had half as much funding (in both academic and industry labs). For instance, if the average lab had a budget of $20 million each year, suppose their budget had only been $10 million each year. How much less progress in AI capabilities would you expect to have seen? e.g. If you think 20% less progress would have been made, write ‘20’\n\n\n……% less\n\n\nImagine that over the past decade, there had been half as much progress in AI algorithms. You might imagine this as conceptual insights being half as frequent. How much less progress in AI capabilities would you expect to have seen? e.g. If you think 20% less progress would have been made, write ‘20’\n\n\n……% less\n\n\n##### Answers\n\n\nThe following five figures are histograms, showing the number of people who gave different answers to the five question parts above.\n\n\n[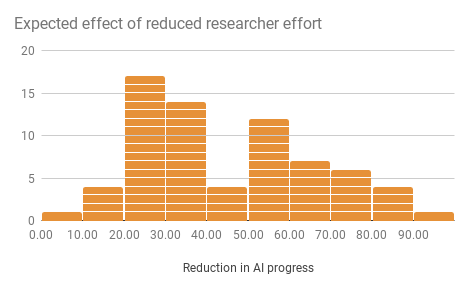](http://aiimpacts.org/wp-content/uploads/2017/04/chart-9.png) [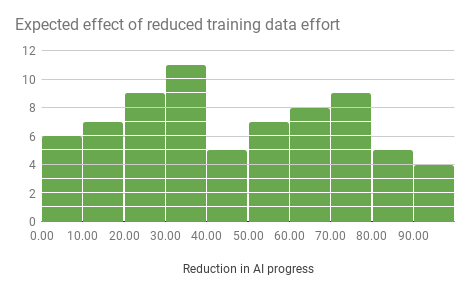](http://aiimpacts.org/wp-content/uploads/2017/04/chart-10.png) [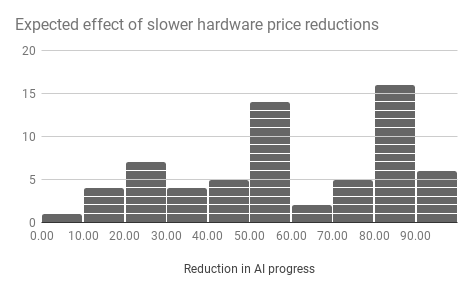](http://aiimpacts.org/wp-content/uploads/2017/04/chart-11.png) [](http://aiimpacts.org/wp-content/uploads/2017/04/chart-12.png) [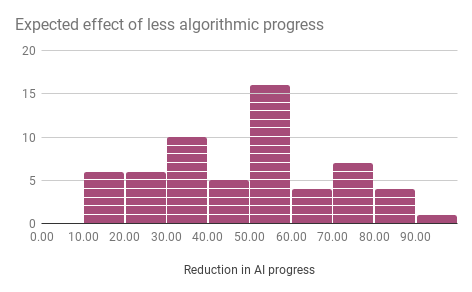](http://aiimpacts.org/wp-content/uploads/2017/04/chart-13.png)\n\n\n###### Sample sizes\n\n\n\n\n\n | Researcher effort | Cost computing | Training data | Funding | Algorithm progress |\n| 71 | 64 | 71 | 68 | 59 |\n\n\n###### Medians\n\n\nThe following figure shows median answers to the above questions.\n\n\n\n\n | Researcher effort | Cost computing | Training data | Funding | Algorithm progress |\n| 30 | 50 | 40 | 40 | 50 |\n\n\n###### Correlations\n\n\n[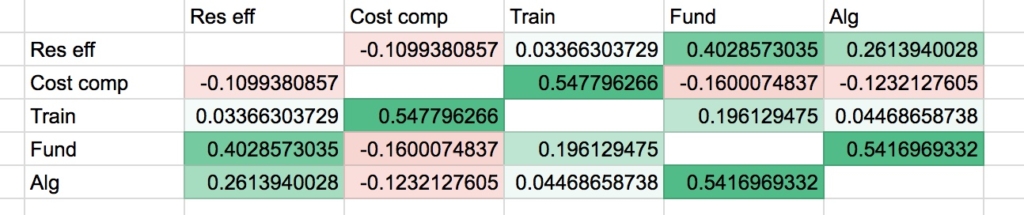](http://aiimpacts.org/wp-content/uploads/2017/04/Correlations.jpeg)\n\n\n#### Outside view implied HLMI forecasts\n\n\n##### Questions\n\n\nParticipants were asked:\n\n\nWhich AI research area have you worked in for the longest time?\n\n\n————————————\n\n\nHow long have you worked in this area?\n\n\n———years\n\n\nConsider three levels of progress or advancement in this area:\n\n\nA. Where the area was when you started working in it\n\n\nB. Where it is now\n\n\nC. Where it would need to be for AI software to have roughly human level abilities at the tasks studied in this area\n\n\nWhat fraction of the distance between where progress was when you started working in the area (A) and where it would need to be to attain human level abilities in the area (C) have we come so far (B)?\n\n\n———%\n\n\nDivide the period you have worked in the area into two halves: the first and the second. In which half was the rate of progress in your area higher?\n\n\n* + The first half\n\t+ The second half\n\t+ They were about the same\n\n\n##### Answers\n\n\nEach person told us how long they had been in their subfield, and what fraction of the remaining path to human-level performance (in their subfield) they thought had been traversed in that time. From this, we can estimate when the subfield should reach ‘human-level performance’, if progress continued at the same rate. The following graph shows those forecast dates.\n\n\n[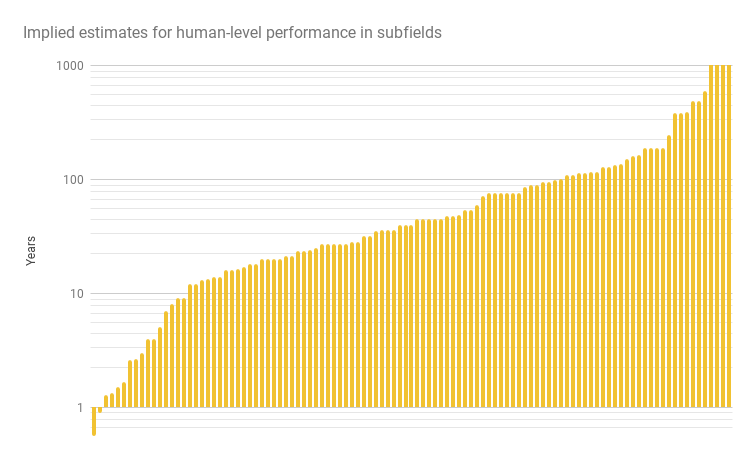](http://aiimpacts.org/wp-content/uploads/2017/04/chart-14.png)\n\n\n[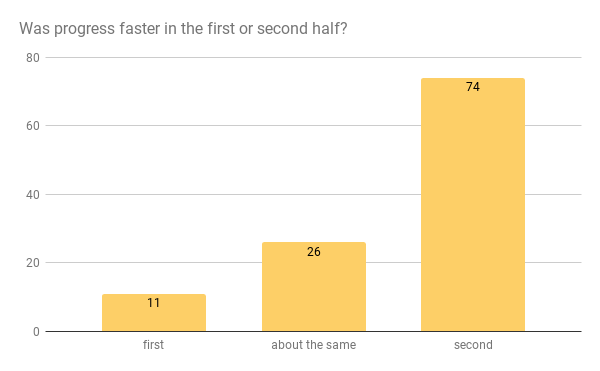](http://aiimpacts.org/wp-content/uploads/2017/04/chart-15.png)\n\n\n#### Disagreements and Misunderstandings\n\n\n##### Questions\n\n\nParticipants were asked:\n\n\nTo what extent do you think you disagree with the typical AI researcher about when HLMI will exist?\n\n\n* + A lot (17)\n\t+ A moderate amount (18)\n\t+ Not much (19)\n\n\n \n\n\nIf you disagree, why do you think that is?\n\n\n\\_\\_\\_\\_\\_\\_\\_\\_\\_\\_\\_\\_\\_\\_\\_\\_\\_\\_\\_\\_\\_\\_\\_\\_\\_\\_\\_\\_\\_\\_\\_\\_\\_\\_\\_\\_\\_\\_\\_\\_\\_\\_\\_\\_\\_\\_\\_\\_\\_\\_\\_\\_\\_\\_\\_\n\n\nTo what extent do you think people’s concerns about future risks from AI are due to misunderstandings of AI research?\n\n\n* + Almost entirely (1)\n\t+ To a large extent (2)\n\t+ Somewhat (4)\n\t+ Not much (3)\n\t+ Hardly at all (5)\n\n\n \n\n\nWhat do you think are the most important misunderstandings, if there are any?\n\n\n\\_\\_\\_\\_\\_\\_\\_\\_\\_\\_\\_\\_\\_\\_\\_\\_\\_\\_\\_\\_\\_\\_\\_\\_\\_\\_\\_\\_\\_\\_\\_\\_\\_\\_\\_\\_\\_\\_\\_\\_\\_\\_\\_\\_\\_\\_\\_\\_\\_\\_\\_\\_\\_\\_\\_\\_\n\n\n##### Answers\n\n\n[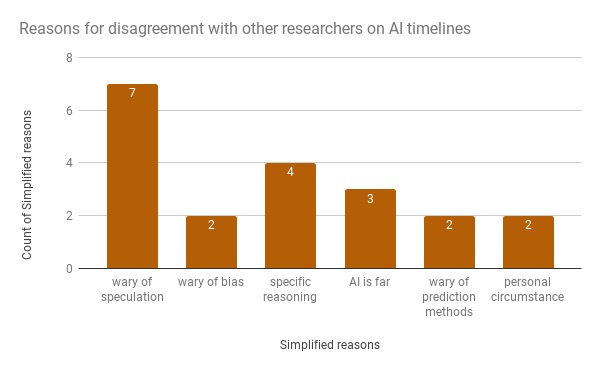](http://aiimpacts.org/wp-content/uploads/2017/04/Reasons-for-differences.jpg)\n\n\n[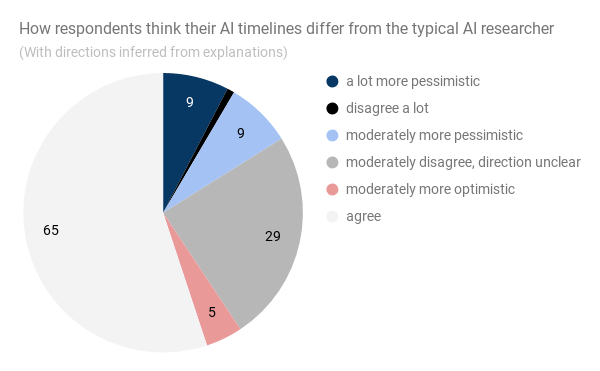](http://aiimpacts.org/wp-content/uploads/2017/04/chart-19.png)\n\n\nOne hundred and eighteen people responded to the question on misunderstandings, and 74 of them described what they thought the most important misunderstandings were. The table and figures below show our categorization of the responses.[2](https://aiimpacts.org/2016-expert-survey-on-progress-in-ai/#easy-footnote-bottom-2-753 \"One person has categorized these responses, and another has checked and corroborated their categorizations.\")\n[](http://aiimpacts.org/wp-content/uploads/2016/12/chart-35.png)\n\n\n\n\n | Most important misunderstandings | Number | Fraction of non-empty responses |\n| Underestimate distance from generality, open-ended tasks | 9 | 12% |\n| Overestimate state of the art (other) | 10 | 14% |\n| Underestimate distance from AGI at this rate | 13 | 18% |\n| Think AI will be in control of us or in conflict with us | 11 | 15% |\n| Expect humans to be obsoleted | 7 | 9% |\n| Overly influenced by fiction | 7 | 9% |\n| Expect AI to be human-like or sentient | 6 | 8% |\n| Expect sudden or surprising events | 5 | 7% |\n| Think AI will go outside its programming | 5 | 7% |\n| Influenced by poor reporting | 5 | 7% |\n| Wrongly equate intelligence with something else | 4 | 5% |\n| Underestimate systemic social risks | 2 | 3% |\n| Overestimate distance to strong AI | 2 | 3% |\n| Other ignorance of AI | 4 | 5% |\n| Other | 12 | 16% |\n| Empty | 44 | 59% |\n\n\n[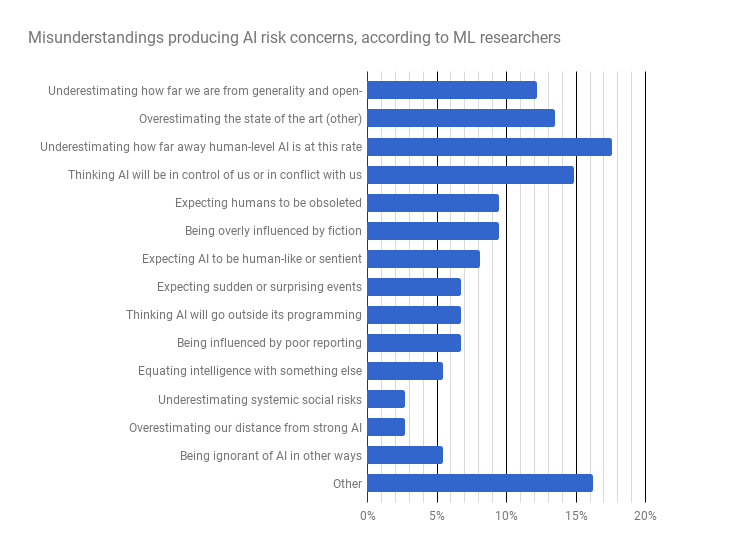](http://aiimpacts.org/wp-content/uploads/2016/12/chart-34.png)\n\n\n#### Narrow tasks\n\n\n##### Questions\n\n\nRespondents were each asked one of the following two questions:\n\n\nFixed years framing:\n\n\n\n> \n> **How likely do you think it is that the following AI tasks will be feasible within the next:**\n> \n> \n> * 10 years?\n> * 20 years?\n> * 50 years?\n> \n> \n> Let a task be ‘**feasible**’ if one of the best resourced labs could implement it in less than a year if they chose to. Ignore the question of whether they would choose to.\n> \n> \n> \n\n\nFixed probabilities framing:\n\n\n\n> \n> **How many years until you think the following AI tasks will be feasible with:**\n> \n> \n> * a small chance (10%)?\n> * an even chance (50%)?\n> * a high chance (90%)?\n> \n> \n> Let a task be ‘**feasible**’ if one of the best resourced labs could implement it in less than a year if they chose to. Ignore the question of whether they would choose to.\n> \n> \n> \n\n\nEach researcher was then presented with a random four of the following tasks:\n\n\n[**Rosetta**] Translate a text written in a newly discovered language into English as well as a team of human experts, using a single other document in both languages (like a Rosetta stone). Suppose all of the words in the text can be found in the translated document, and that the language is a difficult one.\n\n\n**[Subtitles]** Translate speech in a new language given only unlimited films with subtitles in the new language. Suppose the system has access to training data for other languages, of the kind used now (e.g. same text in two languages for many languages and films with subtitles in many languages).\n\n\n**[Translate]** Perform translation about as good as a human who is fluent in both languages but unskilled at translation, for most types of text, and for most popular languages (including languages that are known to be difficult, like Czech, Chinese and Arabic).\n\n\n[**Phone bank**] Provide phone banking services as well as human operators can, without annoying customers more than humans. This includes many one-off tasks, such as helping to order a replacement bank card or clarifying how to use part of the bank website to a customer.\n\n\n[**Class**] Correctly group images of previously unseen objects into classes, after training on a similar labeled dataset containing completely different classes. The classes should be similar to the ImageNet classes.\n\n\n[**One-shot**] One-shot learning: see only one labeled image of a new object, and then be able to recognize the object in real world scenes, to the extent that a typical human can (i.e. including in a wide variety of settings). For example, see only one image of a platypus, and then be able to recognize platypuses in nature photos. The system may train on labeled images of other objects. Currently, deep networks often need hundreds of examples in classification tasks1, but there has been work on one-shot learning for both classification2 and generative tasks3.\n\n\n1 Lake et al. (2015). Building Machines That Learn and Think Like People \n2 Koch (2015). Siamese Neural Networks for One-Shot Image Recognition \n3 Rezende et al. (2016). One-Shot Generalization in Deep Generative Models\n\n\n[**Video scene**] See a short video of a scene, and then be able to construct a 3D model of the scene that is good enough to create a realistic video of the same scene from a substantially different angle.\n\n\nFor example, constructing a short video of walking through a house from a video taking a very different path through the house.\n\n\n[**Transcribe**] Transcribe human speech with a variety of accents in a noisy environment as well as a typical human can.\n\n\n[**Read aloud**] Take a written passage and output a recording that can’t be distinguished from a voice actor, by an expert listener.\n\n\n[**Theorems**] Routinely and autonomously prove mathematical theorems that are publishable in top mathematics journals today, including generating the theorems to prove.\n\n\n[**Putnam**] Perform as well as the best human entrants in the Putnam competition—a math contest whose questions have known solutions, but which are difficult for the best young mathematicians.\n\n\n[**Go low**] Defeat the best Go players, training only on as many games as the best Go players have played.\n\n\nFor reference, DeepMind’s AlphaGo has probably played a hundred million games of self-play, while Lee Sedol has probably played 50,000 games in his life1.\n\n\n1 Lake et al. (2015). Building Machines That Learn and Think Like People\n\n\n[**Starcraft**] Beat the best human Starcraft 2 players at least 50% of the time, given a video of the screen.\n\n\nStarcraft 2 is a real time strategy game characterized by:\n\n\n* + Continuous time play\n\t+ Huge action space\n\t+ Partial observability of enemies Long term strategic play, e.g. preparing for and then hiding surprise attacks.\n\n\n[**Rand game**] Play a randomly selected computer game, including difficult ones, about as well as a human novice, after playing the game less than 10 minutes of game time. The system may train on other games.\n\n\n[**Angry birds**] Play new levels of Angry Birds better than the best human players. Angry Birds is a game where players try to efficiently destroy 2D block towers with a catapult. For context, this is the goal of the IJCAI Angry Birds AI competition1.\n\n\n1 aibirds.org\n\n\n[**Atari**] Outperform professional game testers on all Atari games using no game-specific knowledge. This includes games like Frostbite, which require planning to achieve sub-goals and have posed problems for deep Q-networks1, 2.\n\n\n1 Mnih et al. (2015). Human-level control through deep reinforcement learning \n2 Lake et al. (2015). Building Machines That Learn and Think Like People\n\n\n[**Atari fifty**] Outperform human novices on 50% of Atari games after only 20 minutes of training play time and no game specific knowledge.\n\n\nFor context, the original Atari playing deep Q-network outperforms professional game testers on 47% of games1, but used hundreds of hours of play to train2.\n\n\n1 Mnih et al. (2015). Human-level control through deep reinforcement learning \n2 Lake et al. (2015). Building Machines That Learn and Think Like People\n\n\n[**Laundry**] Fold laundry as well and as fast as the median human clothing store employee.\n\n\n[**Race**] Beat the fastest human runners in a 5 kilometer race through city streets using a bipedal robot body.\n\n\n[**Lego**] Physically assemble any LEGO set given the pieces and instructions, using non-specialized robotics hardware.\n\n\nFor context, Fu 20161 successfully joins single large LEGO pieces using model based reinforcement learning and online adaptation.\n\n\n1 Fu et al. (2016). One-Shot Learning of Manipulation Skills with Online Dynamics Adaptation and Neural Network Priors\n\n\n[**Sort**] Learn to efficiently sort lists of numbers much larger than in any training set used, the way Neural GPUs can do for addition1, but without being given the form of the solution.\n\n\nFor context, Neural Turing Machines have not been able to do this2, but Neural Programmer-Interpreters3 have been able to do this by training on stack traces (which contain a lot of information about the form of the solution).\n\n\n1 Kaiser & Sutskever (2015). Neural GPUs Learn Algorithms \n2 Zaremba & Sutskever (2015). Reinforcement Learning Neural Turing Machines \n3 Reed & de Freitas (2015). Neural Programmer-Interpreters\n\n\n[**Python**] Write concise, efficient, human-readable Python code to implement simple algorithms like quicksort. That is, the system should write code that sorts a list, rather than just being able to sort lists.\n\n\nSuppose the system is given only:\n\n\n* + A specification of what counts as a sorted list\n\t+ Several examples of lists undergoing sorting by quicksort\n\n\n[**Factoid**] Answer any “easily Googleable” **factoid** questions posed in natural language better than an expert on the relevant topic (with internet access), having found the answers on the internet.\n\n\nExamples of factoid questions:\n\n\n* + “What is the poisonous substance in Oleander plants?”\n\t+ “How many species of lizard can be found in Great Britain?”\n\n\n[**Open quest**] Answer any “easily Googleable” factual but open ended question posed in natural language better than an expert on the relevant topic (with internet access), having found the answers on the internet.\n\n\nExamples of open ended questions:\n\n\n* + “What does it mean if my lights dim when I turn on the microwave?”\n\t+ “When does home insurance cover roof replacement?”\n\n\n[**Unkn quest**] Give good answers in natural language to factual questions posed in natural language for which there are no definite correct answers.\n\n\nFor example:”What causes the demographic transition?”, “Is the thylacine extinct?”, “How safe is seeing a chiropractor?”\n\n\n[**Essay**] Write an essay for a high-school history class that would receive high grades and pass plagiarism detectors.\n\n\nFor example answer a question like ‘How did the whaling industry affect the industrial revolution?’\n\n\n[**Top forty**] Compose a song that is good enough to reach the US Top 40. The system should output the complete song as an audio file.\n\n\n[**Taylor**] Produce a song that is indistinguishable from a new song by a particular artist, e.g. a song that experienced listeners can’t distinguish from a new song by Taylor Swift.\n\n\n[**Novel**] Write a novel or short story good enough to make it to the New York Times best-seller list.\n\n\n[**Explain**] For any computer game that can be played well by a machine, explain the machine’s choice of moves in a way that feels concise and complete to a layman.\n\n\n[**Poker**] Play poker well enough to win the World Series of Poker.\n\n\n[**Laws phys**] After spending time in a virtual world, output the differential equations governing that world in symbolic form.\n\n\nFor example, the agent is placed in a game engine where Newtonian mechanics holds exactly and the agent is then able to conduct experiments with a ball and output Newton’s laws of motion.\n\n\n##### Answers\n\n\n###### Fixed years framing\n\n\n[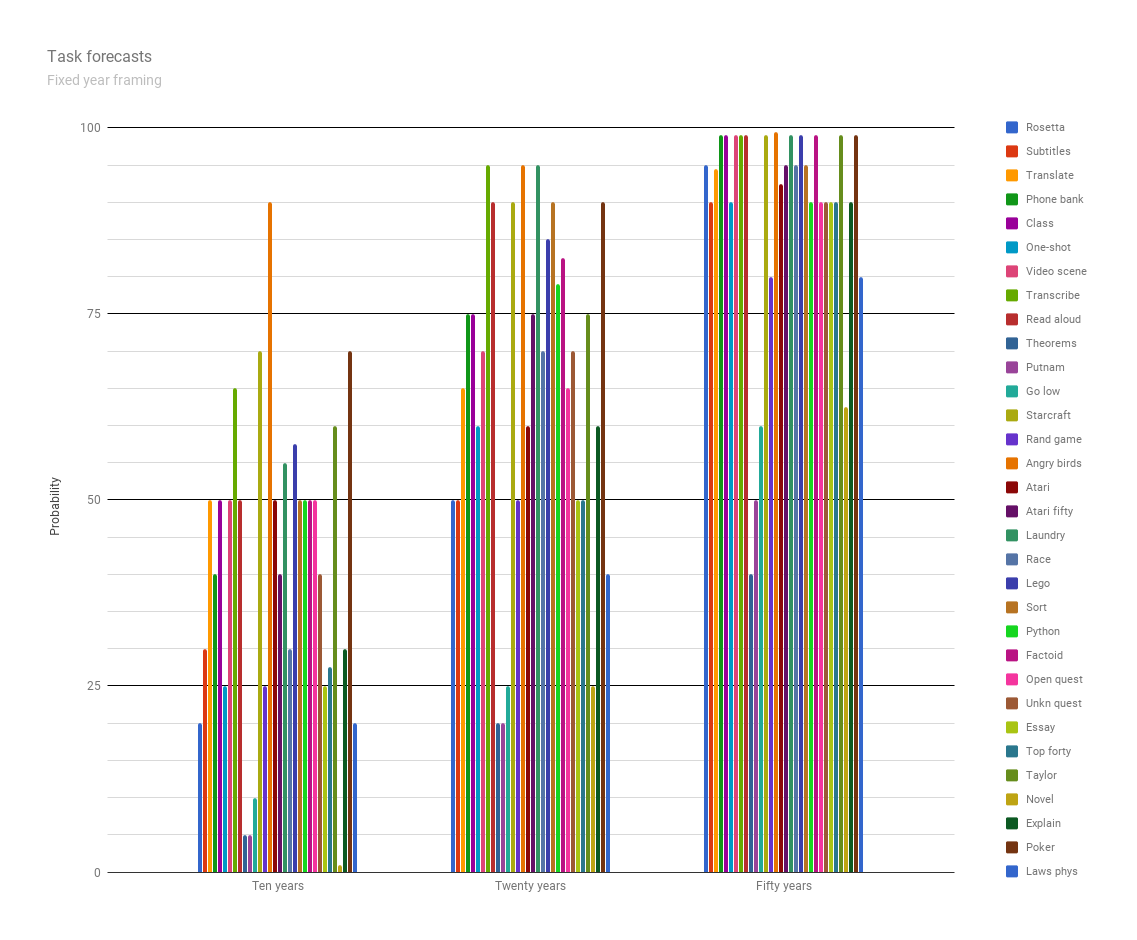](http://aiimpacts.org/wp-content/uploads/2017/04/chart-29.png)\n\n\nProbabilities by year (medians)\n\n\n\n\n | | **10 years** | **20 years** | **50 years** |\n| Rosetta | 20 | 50 | 95 |\n| Subtitles | 30 | 50 | 90 |\n| Translate | 50 | 65 | 94.5 |\n| Phone bank | 40 | 75 | 99 |\n| Class | 50 | 75 | 99 |\n| One-shot | 25 | 60 | 90 |\n| Video scene | 50 | 70 | 99 |\n| Transcribe | 65 | 95 | 99 |\n| Read aloud | 50 | 90 | 99 |\n| Theorems | 5 | 20 | 40 |\n| Putnam | 5 | 20 | 50 |\n| Go low | 10 | 25 | 60 |\n| Starcraft | 70 | 90 | 99 |\n| Rand game | 25 | 50 | 80 |\n| Angry birds | 90 | 95 | 99.4995 |\n| Atari | 50 | 60 | 92.5 |\n| Atari fifty | 40 | 75 | 95 |\n| Laundry | 55 | 95 | 99 |\n| Race | 30 | 70 | 95 |\n| Lego | 57.5 | 85 | 99 |\n| Sort | 50 | 90 | 95 |\n| Python | 50 | 79 | 90 |\n| Factoid | 50 | 82.5 | 99 |\n| Open quest | 50 | 65 | 90 |\n| Unkn quest | 40 | 70 | 90 |\n| Essay | 25 | 50 | 90 |\n| Top forty | 27.5 | 50 | 90 |\n| Taylor | 60 | 75 | 99 |\n| Novel | 1 | 25 | 62.5 |\n| Explain | 30 | 60 | 90 |\n| Poker | 70 | 90 | 99 |\n| Laws phys | 20 | 40 | 80 |\n\n\n###### Fixed probabilities framing\n\n\n[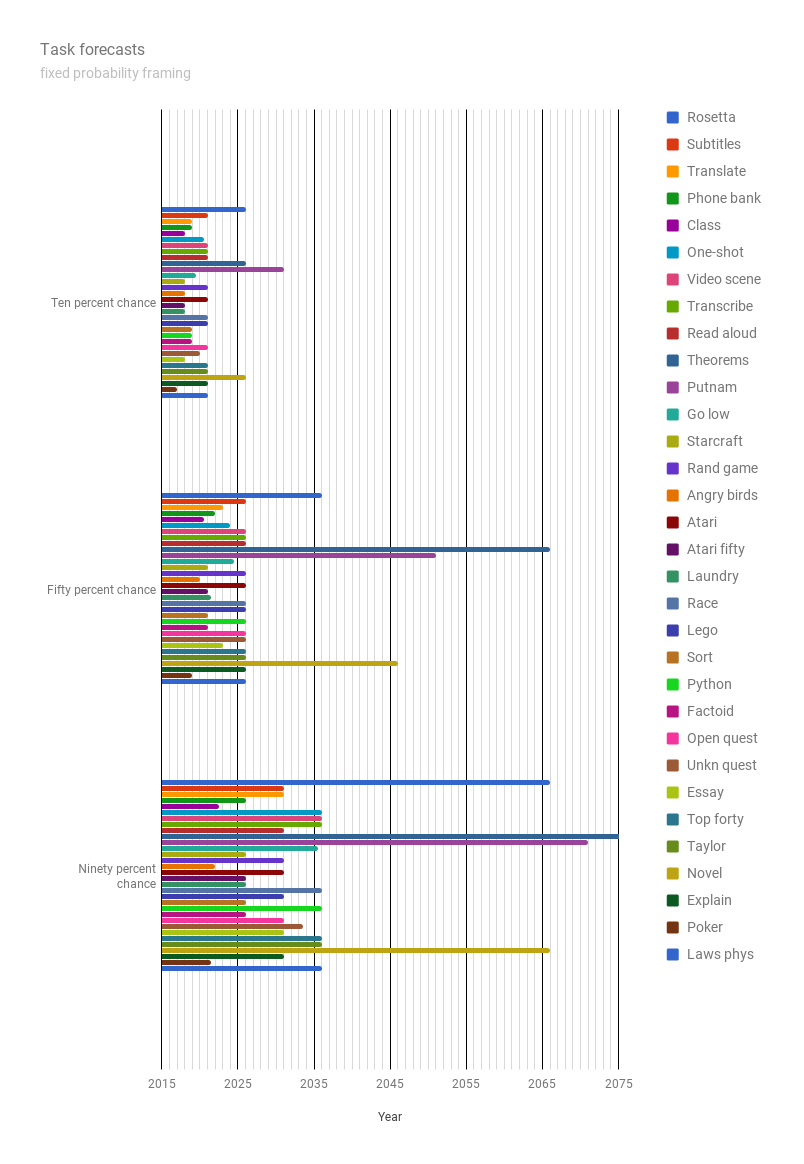](http://aiimpacts.org/wp-content/uploads/2017/04/chart-28.png)\n\n\nYears by probability (medians)\n\n\n\n\n | | **10 percent** | **50 percent** | **90 percent** |\n| Rosetta | 10 | 20 | 50 |\n| Subtitles | 5 | 10 | 15 |\n| Translate | 3 | 7 | 15 |\n| Phone bank | 3 | 6 | 10 |\n| Class | 2 | 4.5 | 6.5 |\n| One-shot | 4.5 | 8 | 20 |\n| Video scene | 5 | 10 | 20 |\n| Transcribe | 5 | 10 | 20 |\n| Read aloud | 5 | 10 | 15 |\n| Theorems | 10 | 50 | 90 |\n| Putnam | 15 | 35 | 55 |\n| Go low | 3.5 | 8.5 | 19.5 |\n| Starcraft | 2 | 5 | 10 |\n| Rand game | 5 | 10 | 15 |\n| Angry birds | 2 | 4 | 6 |\n| Atari | 5 | 10 | 15 |\n| Atari fifty | 2 | 5 | 10 |\n| Laundry | 2 | 5.5 | 10 |\n| Race | 5 | 10 | 20 |\n| Lego | 5 | 10 | 15 |\n| Sort | 3 | 5 | 10 |\n| Python | 3 | 10 | 20 |\n| Factoid | 3 | 5 | 10 |\n| Open quest | 5 | 10 | 15 |\n| Unkn quest | 4 | 10 | 17.5 |\n| Essay | 2 | 7 | 15 |\n| Top forty | 5 | 10 | 20 |\n| Taylor | 5 | 10 | 20 |\n| Novel | 10 | 30 | 50 |\n| Explain | 5 | 10 | 15 |\n| Poker | 1 | 3 | 5.5 |\n| Laws phys | 5 | 10 | 20 |\n\n\n#### Safety\n\n\n##### Stuart Russell’s problem\n\n\n###### Question\n\n\nParticipants were asked:\n\n\nStuart Russell summarizes an argument for why highly advanced AI might pose a risk as follows:\n\n\n*The primary concern [with highly advanced AI] is not spooky emergent consciousness but simply the ability to make high-quality decisions. Here, quality refers to the expected outcome utility of actions taken […]. Now we have a problem:*\n\n\n*1. The utility function may not be perfectly aligned with the values of the human race, which are (at best) very difficult to pin down.*\n\n\n*2. Any sufficiently capable intelligent system will prefer to ensure its own continued existence and to acquire physical and computational resources – not for their own sake, but to succeed in its assigned task.*\n\n\n*A system that is optimizing a function of n variables, where the objective depends on a subset of size k
AI Impacts. “Some Survey Results!,” June 8, 2017. https://aiimpacts.org/some-survey-results/.\"):\n\n\n1. The milestones in the timeline and in the abstract are from three different sets of questions. There seems to be a large framing effect between two of them—full automation of labor is logically required to be before HLMI, and yet it is predicted much later—and it is unclear whether people answer the third set of questions (about narrow tasks) more like the one about HLMI or more like the one about occupations. Plus even if there were no framing effect to worry about, we should expect milestones about narrow tasks to be much earlier than milestones about very similar sounding occupations. For instance, if there were an occupation ‘math researcher’, it should be later than the narrow task summarized here as ‘math research’. So there is a risk of interpreting the figure as saying AI research is harder than math research, when really the ‘-er’ is all-important. So to help avoid confusion, here is the timeline colored in by which set of questions each milestone came from. The blue one was asked on its own. The orange ones were always asked together: first all four occupations, then they were asked for an occupation they expected to be very late, and when they expected it, then full automation of labor. The pink milestones were randomized, so that each person got four. There are a lot more pink milestones not included here, but included in the long table at the end of the paper.[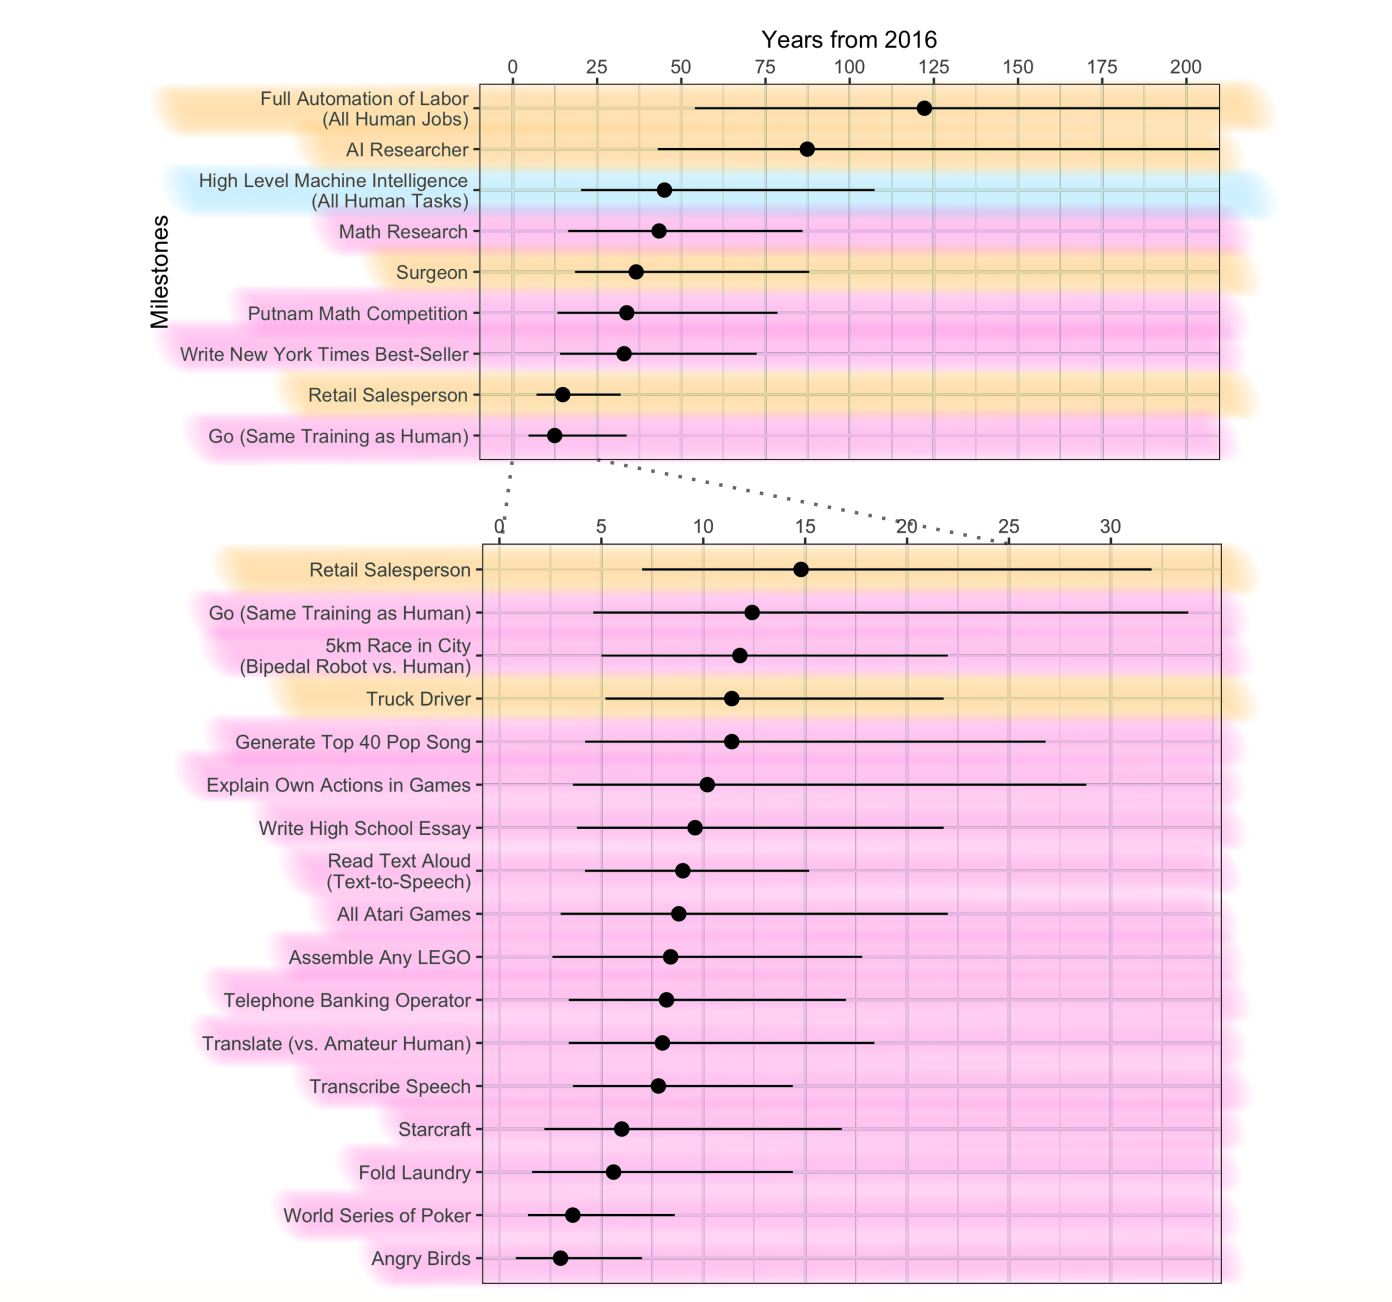](http://aiimpacts.org/wp-content/uploads/2017/06/timelineofairesults.jpeg)\n2. In Figure 2 and Table S5 I believe the word ‘median’ means we are talking about the ‘50% chance of occurring’ number, and the dates given are this ‘median’ (50% chance) date for a distribution that was made by averaging together all of the different people’s distributions (or what we guess their distributions are like from three data points).\n\n\n\n\n \n \n*Authors: Katja Grace, John Salvatier, Allan Dafoe, Baobao Zhang, and Owain Evans. This page is an extended analyses of research published in Grace et al 2017* [5](https://aiimpacts.org/2016-expert-survey-on-progress-in-ai/#easy-footnote-bottom-5-753 \"Grace, Katja, John Salvatier, Allan Dafoe, Baobao Zhang, and Owain Evans. “When Will AI Exceed Human Performance? Evidence from AI Experts.” ArXiv:1705.08807 [Cs], 2017. http://arxiv.org/abs/1705.08807.\")*, so includes research contributions from all authors, but Katja compiled and described these, and added additional figures and analyses, so composition decisions and opinion reflect her views and not necessarily those of the group, and much of the specific analysis has not been vetted by the group in this form.*\n\n\nSuggested citation: \n\n\nGrace, Katja, John Salvatier, Allan Dafoe, Baobao Zhang, and Owain Evans. “2016 Expert Survey on Progress in AI.” In *AI Impacts*, December 14, 2016.
Statista’s figure of ‘Forecast hardware spendings worldwide from 2013 to 2019 (in billion U.S. dollars)’ reports a 2013 figure of $987bn, increasing to $1075bn in 2015. It is unclear why these spending forecasts differ so much from Statista’s reported 2012 spending.
\nStatista also reports a prediction of 2016 hardware revenue at $409bn Euro, which is around $447bn USD. It looks like the prediction was made in 2012. Note that revenue is not identical to spending, but is probably a reasonable proxy.
\nFor 2009, Reuters reports a substantially lower revenue figure than Statista, suggesting Statista figures may be systematically high, e.g. by being relatively inclusive:
\n“The global computer hardware market had total revenue of $193.2 billion in 2009, representing a compound annual growth rate (CAGR) of 5.4% for the period spanning 2005-2009.” – Research and Markets press release, Reuters,
\nStatista‘s figure indicates revenue of 296 billion Euros, or around $320 billion USD in 2009 (this is the same figure as for 2007, which may be the only number you can see without a subscription—so while it may look like we made an error here, we do have the figure for the correct year). This is around 50% more than the Research and Markets press release.
\nFrom these figures we estimate that spending on hardware in 2015 was $300bn-$1,500bn\") Based on the [prices of FLOPS](http://aiimpacts.org/current-flops-prices/), (and making some assumptions, e.g. about how long hardware lasts) this suggests the total global stock of hardware can perform around 7.5 x 10¹⁹– 1.5 x 10²¹ FLOPS/year.[2](https://aiimpacts.org/mysteries-of-global-hardware/#easy-footnote-bottom-2-649 \"See our page on this topic for all the citations and calculations\") However the lower end of this range is below a relatively detailed estimate of global hardware made in 2007. It seems unlikely that the hardware base actually shrunk in recent years, so we push our estimate up to 2 x 10²⁰ – 1.5 x 10²¹ FLOPS/year.\n\n\nThis is about 0.3%-1.9% of global GDP—a more plausible number, we think—so resolves the original problem. But a big reason Naik gave such high estimates for global hardware was that the last time someone measured it—between 1986 and 2007—computing hardware was growing very fast. General purpose computing was growing at 61% per year, and the application specific computers studied (such as GPUs) were growing at 86% per year. Application specific computers made up the vast majority too, so we might expect growth to progress at close to 86% per year.\n\n\nHowever if global hardware is as low as we estimate, the growth rate of total computing hardware since 2007 has been 25% or less, much lower than in the previous 21 years. Which would present us with another puzzle: **what happened?**\n\n\nWe aren’t sure, but this is still our best guess for the solution to the original puzzle. Hopefully we will have time to look into this puzzle too, but for now I’ll leave interested readers to speculate.\n\n\n\n\n---\n\n\n \n\n\n**Added March 11 2016:** Assuming the 2007 hardware figures are right, how much of the world’s wealth was in hardware in 2007? Back then, GWP [was probably](https://web.archive.org/web/20080401214624/https://www.cia.gov/library/publications/the-world-factbook/fields/2001.html) about $66T (in 2007 dollars). According to [Hilbert & Lopez](http://ijoc.org/index.php/ijoc/article/view/1562/742), the world could then perform 2 x 10²⁰ IPS, which is 2 x 10¹⁴ MIPS. According to [Muehlhauser & Rieber](https://intelligence.org/2014/05/12/exponential-and-non-exponential/#footnote_7_11027), hardware cost roughly $5 x 10⁻³/MIPS in 2007. Thus the total value of hardware would have been around $5 x 10⁻³/MIPS x 2 x 10¹⁴ MIPS = $1012 (a trillion dollars), or 1.5% of GWP.\n\n\n\n\n---\n\n\n \n\n\n[](http://aiimpacts.org/wp-content/uploads/2016/03/Titan_supercomputer_at_the_Oak_Ridge_National_Laboratory.jpg)**Titan Supercomputer.** *[By](https://commons.wikimedia.org/w/index.php?curid=22575721) an employee of the Oak Ridge National Laboratory.*\n\n\n---\n\n\n \n\n", "url": "https://aiimpacts.org/mysteries-of-global-hardware/", "title": "Mysteries of global hardware", "source": "aiimpacts.org", "source_type": "wordpress", "date_published": "2016-03-08T00:45:24+00:00", "paged_url": "https://aiimpacts.org/feed?paged=18", "authors": ["Katja Grace"], "id": "fb4bf015ce3069e5773c9da0803585f0", "summary": []} {"text": "Global computing capacity\n\n*[This page is out of date and its contents may have been inaccurate in 2015, in light of new information that we are yet to integrate. See [Computing capacity of all GPUs and TPUs](https://wiki.aiimpacts.org/doku.php?id=ai_timelines:hardware_and_ai_timelines:computing_capacity_of_all_gpus_and_tpus \"ai_timelines:hardware_and_ai_timelines:computing_capacity_of_all_gpus_and_tpus\") for a related and more up-to-date analysis.]*\n\n\nComputing capacity worldwide was probably around 2 x 10²⁰– 1.5 x 10²¹ FLOPS, at around the end of 2015.\n\n\nSupport\n-------\n\n\nWe are not aware of recent, plausible estimates for hardware capacity.\n\n\nVipul Naik estimated global hardware capacity in February 2014, based on Hilbert & Lopez’s estimates for 1986-2007. He calculated that if all computers ran at full capacity, they would perform 10-1000 zettaFLOPS, i.e. 1022– 1024 FLOPS.[1](https://aiimpacts.org/global-computing-capacity/#easy-footnote-bottom-1-644 \"“My current guesstimate for total computation being done would be 0.1-10 zettaFLOPS and current estimate for how much computation can be done if all computers ran at full capacity would be 10-1000 zettaFLOPS (but this would entail prohibitive energy costs and not be sustainable).”
\n– Vipul Naik, research notes\") We think these are substantial overestimates, because producing so much computing hardware would cost more than 10% of gross world product (GWP), which is implausibly high. The most cost-efficient computing hardware we are aware of today are GPUs, which still cost about [$3/GFLOPS](http://aiimpacts.org/current-flops-prices/), or $1/GFLOPSyear if we assume hardware is used for around three years. This means maintaining hardware capable of 1022– 1024 FLOPS would cost at least $1013– $1015 per year. Yet [gross world product](https://en.wikipedia.org/wiki/Gross_world_product) (GWP) is only around $8 x 10¹³, so this would imply hardware spending constitutes more than 13% – 1300% of GWP. Even the lower end of this range seems implausible.[2](https://aiimpacts.org/global-computing-capacity/#easy-footnote-bottom-2-644 \"One might wonder if the total stock of hardware seems high because hardware lasts for much longer than three years. This probably does not account for it, because the growth rate is high enough that even if substantially older hardware persisted, it would make up a small share of total hardware. For instance in 2007 the world’s computing capacity (for the general purpose and application specific computers Hilbert & Lopez estimated) was only 2 x 10²⁰ IPS (similar to FLOPS), roughly 0.02%-2% of Naik’s estimate.
\n\")\n\n\nOne way to estimate global hardware capacity ourselves is based on annual hardware spending. This is slightly complicated because hardware lasts for several years. So to calculate how much hardware exists in 2016, we would ideally like to know how much was bought in every preceding year, and also how much of each annual hardware purchase has already been discarded. To simplify matters, we will instead assume that hardware lasts for around three years.\n\n\nIt appears that very roughly $300bn-$1,500bn was spent on hardware in 2015.[3](https://aiimpacts.org/global-computing-capacity/#easy-footnote-bottom-3-644 \"“In 2012, the worldwide computing hardware spending is expected at 418 billion U.S. dollars.” – Statista
\nStatista’s figure of ‘Forecast hardware spendings worldwide from 2013 to 2019 (in billion U.S. dollars)’ reports a 2013 figure of $987bn, increasing to $1075bn in 2015. It is unclear why these spending forecasts differ so much from Statista’s reported 2012 spending.
\nStatista also reports a prediction of 2016 hardware revenue at $409bn Euro, which is around $447bn USD. It looks like the prediction was made in 2012. Note that revenue is not identical to spending, but is probably a reasonable proxy.
\nFor 2009, Reuters reports a substantially lower revenue figure than Statista, suggesting Statista figures may be systematically high, e.g. by being relatively inclusive:
\n“The global computer hardware market had total revenue of $193.2 billion in 2009, representing a compound annual growth rate (CAGR) of 5.4% for the period spanning 2005-2009.” – Research and Markets press release, Reuters,
\nStatista‘s figure indicates revenue of 296 billion Euros, or around $320 billion USD in 2009 (this is the same figure as for 2007, which may be the only number you can see without a subscription—so while it may look like we made an error here, we do have the figure for the correct year). This is around 50% more than the Research and Markets press release.
\nFrom these figures we estimate that spending on hardware in 2015 was $300bn-$1,500bn\") We [previously estimated](http://aiimpacts.org/current-flops-prices/) that the cheapest available hardware (in April 2015) was around $3/GFLOPS. So if humanity spent $300bn-$1,500bn on hardware in 2015, and it was mostly the cheapest hardware, then the hardware we bought should perform around 1020 – 5 x 10²⁰ FLOPS. If we multiply this by three to account for the previous two years’ hardware purchases still being around, we have about 3 x 10²⁰– 1.5 x 10²¹ FLOPS.\n\n\nThis estimate is rough, and could be improved in several ways. Most likely, more hardware is being bought each year than the previous year. So approximating last years’ hardware purchase to this years’ will yield too much hardware. In particular, the faster global hardware is growing, the closer the total is to whatever humanity bought this year (that is, counterintuitively, if you think hardware is growing faster, you should suppose that there is *less of it* by this particular method of estimation). Furthermore, perhaps a lot of hardware is not the cheapest for various reasons. This too suggests there is less hardware than we estimated.\n\n\nOn the other hand, hardware may often last for more than three years (we don’t have a strong basis for our assumption there). And our prices are from early 2015, so hardware is likely somewhat cheaper now (in early 2016). Our guess is that overall these considerations mean our estimate should be lower, but probably by less than a factor of four in total. This suggests 7.5 x 10¹⁹ – 1.5 x 10²¹ FLOPS of hardware.\n\n\nHowever [Hilbert & Lopez](http://ijoc.org/index.php/ijoc/article/view/1562/742) (2012) estimated that in 2007 the world’s computing capacity was around 2 x 10²⁰IPS (similar to FLOPS) already, after constructing a detailed inventory of technologies.[4](https://aiimpacts.org/global-computing-capacity/#easy-footnote-bottom-4-644 \"“It is written from the perspective of the results of our recent inventory of 60 technological categories between 1986 and 2007 (measured in bits and MIPS [million-instructions-per-second])…”
\n“…The combined capacity of both groups of computers has grown from 730 tera-IPS in 1986 (73010^12 instructions per second), over 22.5 peta-IPS in 1993 (22.510^15 instructions per second), to 1.8 exa-IPS in 2000 (1.810^18 IPS), and 196 exa-IPS in 2007 (or roughly 210^20 instructions per second).”
\n– Hilbert & Lopez (2012)
\n\") Their estimate does not appear to conflict with data about the global economy at the time.[5](https://aiimpacts.org/global-computing-capacity/#easy-footnote-bottom-5-644 \"In 2007, GWP was probably about $66T (in 2007 dollars). According to Hilbert & Lopez, the world could then perform 2 x 10²⁰ IPS, which is 2 x 10¹⁴ MIPS. According to Muehlhauser & Rieber, hardware cost roughly $5 x 10⁻³/MIPS in 2007. Thus the total value of hardware would have been around $5 x 10⁻³/MIPS x 2 x 10¹⁴ MIPS = $1012 (a trillion dollars), or 1.5% of GWP.\") Growth is unlikely to have been negative since 2007, though Hilbert & Lopez may have overestimated. So we revise our estimate to 2 x 10²⁰ – 1.5 x 10²¹ FLOPS for the end of 2015.\n\n\nThis still suggests that in the last nine years, the world’s hardware has grown by a factor of 1-7.5, implying a growth rate of 0%-25%. Even 25% would be quite low compared to growth rates between 1986 and 2007 according to [Hilbert & Lopez](http://ijoc.org/index.php/ijoc/article/view/1562/742) (2012), which were 61% for general purpose computing and 86% for the set of ASICs they studied (which in 2007 accounted for 32 times as much computing as general purpose computers).[6](https://aiimpacts.org/global-computing-capacity/#easy-footnote-bottom-6-644 \"“The respective compound annual growth rates between 1986–2007 were 61% for general-purpose computations and 86% for application-specific computations, which is 10 and 14 times faster than global GDP during that period, respectively.”
\nHilbert & Lopez (2012)
\n\") However if we are to distrust estimates which imply hardware is a large fraction of GWP, then we must expect hardware growth has slowed substantially in recent years. For comparison, our estimates are around 2-15% of Naik’s lower bound, and suggest that hardware constitutes around 0.3%-1.9% of GWP.\n\n\nSuch large changes in the long run growth rate are surprising to us, and—if they are real—we are unsure what produced them. One possibility is that hardware prices have stopped falling so fast (i.e. Moore’s Law is ending for the price of computation). Another is that spending on hardware decreased for some reason, for instance because people stopped enjoying large returns from additional hardware. We think this question deserves further research.\n\n\nImplications\n------------\n\n\n### Global computing capacity in terms of human brains\n\n\nAccording to [different estimates](http://aiimpacts.org/brain-performance-in-flops/), the human brain performs the equivalent of between 3 x 10¹³ and 1025 FLOPS. The median estimate we know of is 1018 FLOPS. According to that median estimate and our estimate of global computing hardware, if the world’s entire computing capacity could be directed at running minds around as efficient as those of humans, we would have the equivalent of 200-1500 extra human minds.[7](https://aiimpacts.org/global-computing-capacity/#easy-footnote-bottom-7-644 \"2 x 10²⁰ /1018 = 2 x 10²
\n1.5 x 1021/1018=1.5 x 103\") That is, turning all of the world’s hardware into human-efficiency minds at present would increase the world’s population of minds by at most about 0.00002%. If we select the most favorable set of estimates for producing large numbers, turning all of the world’s computing hardware into minds as efficient as humans’ would produce around 50 million extra minds, increasing the world’s effective population by about 1%.[8](https://aiimpacts.org/global-computing-capacity/#easy-footnote-bottom-8-644 \"1.5 x 1021 FLOPS of hardware divided by 3 x 1013 FLOPS/brain gives us 5 x 107 minds.\")\n\n\n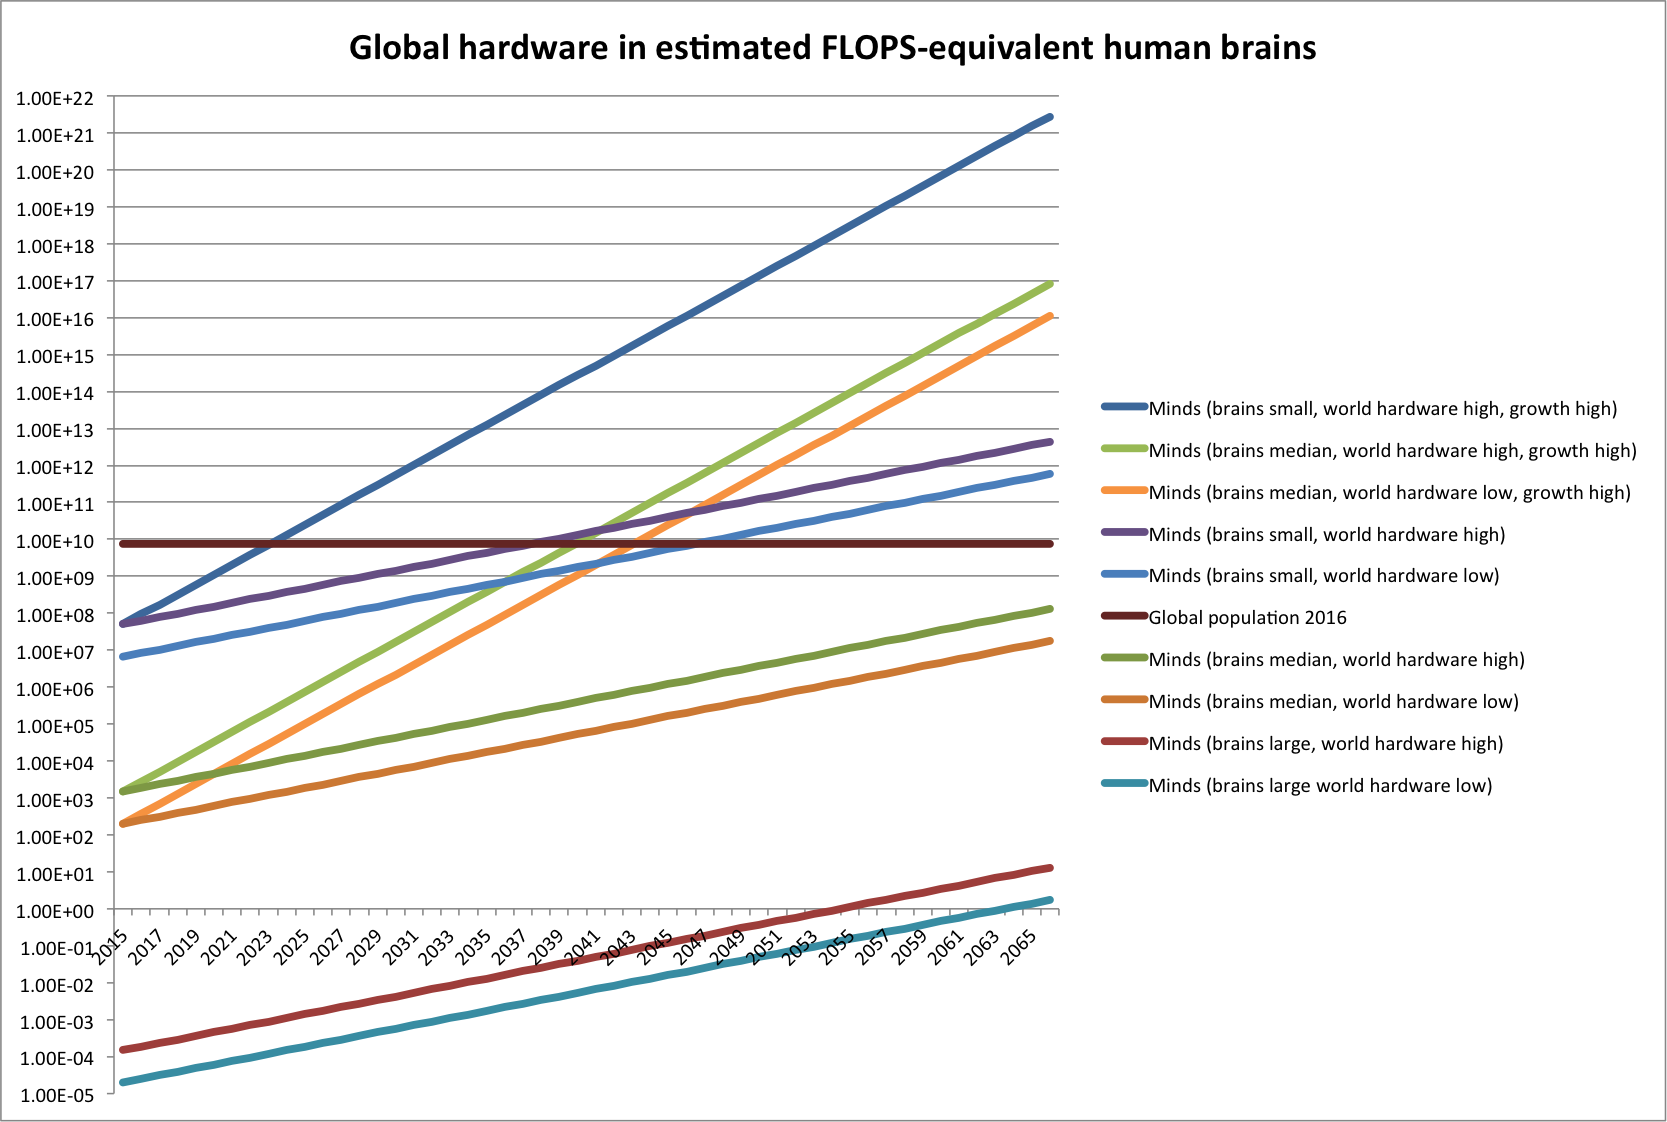Figure: Projected number of human brains equivalent to global hardware under various assumptions. For brains, ‘small’ = 3 x 10^ 13, ‘median’ = 10^18, ‘large’ = 10^25. For ‘world hardware’, ‘high’ =2 x 10^20, ‘low’ = 1.5 x 10^21. ‘Growth’ is growth in computing hardware, the unlabeled default used in most projections is 25% per annum (our estimate above), ‘high’ = 86% per annum (the apparent growth rate in ASIC hardware in around 2007).\n\n\n\n\n---\n\n", "url": "https://aiimpacts.org/global-computing-capacity/", "title": "Global computing capacity", "source": "aiimpacts.org", "source_type": "wordpress", "date_published": "2016-02-17T01:21:19+00:00", "paged_url": "https://aiimpacts.org/feed?paged=18", "authors": ["Katja Grace"], "id": "b476ce4b141afb04c06a62d4099ad3ce", "summary": []} {"text": "Coordinated human action as example of superhuman intelligence\n\nCollections of humans organized into groups and institutions provide many historical examples of the creation and attempted control of intelligences that routinely outperform individual humans. A preliminary look at the available evidence suggests that individuals are often cognitively outperformed in head-to-head competition with groups of similar average intelligence. This article surveys considerations relevant to the topic and lays out what a plausible research agenda in this area might look like.\n\n\nBackground\n----------\n\n\nHumans are often organized into groups in order to perform tasks beyond the abilities of any single human in the group. Many such groups perform cognitive tasks. The history of forming such groups is long and varied, and provides some evidence about what new forms of superhuman intelligence might be like. \n\n\nSome examples of humans cooperating on a cognitive task that no one member could perform include:\n\n\n* Ten therapists can see ten times as many patients as one therapist can.\n* A hospital can perform many more kinds of medical procedure and treat many more kinds of illness than any one person in the hospital.\n* A team of friends on trivia night might be able to answer more questions than any one of them individually might.\n\n\nHow such institutions are formed, and the sensitivity of their behavior to starting conditions, may help us predict the behavior of similarly constituted AIs or systems of AIs. This information would be especially useful if control or value alignment problems have been solved in some cases, or to the extent that existing human institutions resemble superintelligences or constitute an intelligence explosion.\n\n\nThere are several reasons these kinds of groups may present only a limited analogy to digital artificial intelligence. For instance, humans have no software-hardware distinction, so physical measures such as fences that can control the spread of humans are not likely to be as reliable at controlling the spread of digital intelligences. An individual human cannot easily be separated into different cognitive modules, which limits the design flexibility of intelligences constructed from humans. More generally, AIs may be programmed in ways very different from the heuristics and algorithms executed by the human brain, so while human organizations may be a kind of superhuman intelligence, they are not necessarily representative of the broader space of possible superintelligences.\n\n\n### Questions for further investigation:\n\n\n* Do any human organizations have the characteristics of superintelligences that some AI researchers and futurists expect to cause an intelligence explosion with catastrophic consequences? If so, do we expect catastrophe from human organizations? If not, what distinguishes them from other, potential artificial intelligences?\n* How similar is the problem of controlling institutional behavior to the value alignment problem with respect to powerful digital AIs? Are the expected consequences similar?\n* Do control mechanisms require limiting the cognitive performance of groups, or are there control mechanisms that do not appear to degrade in effectiveness as the intelligence of the group increases?\n* How relevant are the differences between human collective intelligence and digital AI?\n\n\nGroup vs individual performance\n-------------------------------\n\n\nInstitutions are mainly relevant as an example of constructed intelligence if their intelligence is higher than that of humans, in some sense. This section examines reasons to believe this might be the case.\n\n\n### Mechanisms for cognitive superiority of groups\n\n\nWe can think of several mechanisms by which a group might outperform individual humans on cognitive tasks, although this list is not comprehensive:\n\n\n* **Aggregation** – A large number of people can often perform cognitive tasks at a higher rate than a single person performing the same tasks. For example, a large accounting firm ought to be able to perform more audits, or prepare more tax returns, than a single accountant. In practice, there are often impediments to work scaling linearly with the number of people involved, as noted in observations such as [Parkinson’s Law](https://en.wikipedia.org/wiki/Parkinson%27s_law).\n* **Cognitive economies of scale**\n\t+ It is often less costly to teach someone how to perform a task than for them to figure it out on their own. Knowledge transfer between members of a group may therefore accelerate the learning process.\n\t+ Individuals with different skills can cooperate to produce things or quantities of things that no one person could have produced, through specialization and gains from trade. For example, [I, Pencil](http://www.econlib.org/library/Essays/rdPncl1.html) describes the large number of processes, each requiring a very different set of skills and procedures that it would take a long time to learn, to produce a single pencil.\n\n\n* ****Model combination and adjustment****\n\t+ In groups solving problems, people can make different suggestions and identify one another’s incorrect suggestions, which may help the group avoid wasting time on blind alleys or adopting premature, incorrect solutions.\n\t+ The average of the individual estimates from a group of people is typically more reliably accurate than the estimate of any individual in the group, because random errors tend to cancel each other out. This is often called the “wisdom of crowds”.\n\t+ Groups of people can also coordinate by comparing predictions and accepting the claim the group finds most credible. Trivia teams typically use this strategy. Groups of people have also been pitted against individuals in chess games.\n\t+ Markets can be used to combine information from many individuals.\n\n\nFurther investigation on this topic could include:\n\n\n* Generating a more comprehensive list of potential mechanisms by which institutions and groups may have a cognitive advantage, by examining the historical record, arguments, and experimental and case studies of individual vs group performance.\n* Assessing which mechanisms can be shown to work, and how much group intelligence can exceed individual intelligence, by evaluating historical examples, case studies, and experimental studies.\n* Assessing in which aspects of intelligence, if any, groups have not outperformed individuals.\n\n\n### Evidence of cognitive superiority of groups\n\n\nAn incomplete survey of literature on collective intelligence found several measures where group performance, distinct from individual performance, has been explicitly evaluated:\n\n\n* [Wooley et al. 2010](http://www.sebbm.es/archivos_tinymce/woolley2010.pdf) examined the performance of groups on tasks such as solving visual puzzles, brainstorming, making collective moral judgments, negotiating over limited resources, and playing checkers against a standardized computer opponent. The study found correlation between performance on different tasks, related more to the ability of members to coordinate than to the average or maximum intelligence of group members.\n* [Shaw 1932](http://www.jstor.org/stable/1415351?seq=1#page_scan_tab_contents) compared the timed performance of individuals and four-person groups on simple spatial and logical reasoning problems, and verbal tasks (arranging a set of words to form the end of some text). The study found that on problems where anyone was able to solve them, groups substantially outperformed individuals, mostly by succeeding much more often than individuals did. No one was able to solve the last two problems, but the study did find that on those problems, suggestions rejected during the process of group problem-solving were predominantly incorrect suggestions rejected by someone other than the person who proposed them, which shows error-correction to be potentially an important part of the advantage of group cognition.\n* [Thorndike 1938](http://psycnet.apa.org/journals/abn/33/3/409/) compared group and individual performance on vocabulary completion, limerick completion, and solving and making cross-word puzzle tests. Groups outperformed individuals on everything except making crossword puzzles.\n* [Taylor and Faust 1952](http://psycnet.apa.org/journals/xge/44/5/360/) tested the ability of individuals, groups of two, and groups of four, to solve “twenty questions” style problems. Groups outperformed individuals, but larger groups did not outperform smaller groups.\n* [Gurnee 1936](http://www.tandfonline.com/doi/abs/10.1080/00223980.1937.9917512?journalCode=vjrl20&#.VpwKGFMrKAw) compared individual and group performance at maze learning. Groups completed mazes faster and with fewer false moves.\n* [Gordon 1924](http://psycnet.apa.org/journals/xge/7/5/398/) compared individual estimates of an object’s weight with the average of members of a group. The study found that group averages outperformed individual estimates, and that larger groups performed better than smaller groups.\n* [McHaney et al. 2015](http://crx.sagepub.com/content/early/2015/09/29/0093650215607627.abstract) compared the performance of individuals, ad hoc groups, and groups with a prior history of working together, at detecting deception. The study found that groups with a prior history of working together outperform ad hoc groups, and refers to earlier literature that found no difference between the performance of individuals and that of ad hoc groups.\n\n\nMostly these studies appear to show groups outperforming individuals. We also found review articles referencing tens of other studies. We may follow up with a more comprehensive review of the evidence in this area in the future.\n\n\n### Questions for further investigation:\n\n\n* Which of the possible mechanisms for cognitive superiority of groups do human institutions demonstrate in practice? Do they have important advantages other than the ones enumerated?\n* In what contexts has the difference between group and individual performance been measured? Are there measures on which large organizations do much better than a single human? On what kinds of tasks does group performance most exceed that of individuals? How are these groups constituted?\n* Are there measures on which large organizations cannot be arbitrarily better than a single human? (These might still be things that an AI could do much better, and so where organizations are not a good analogue.) Are there measures for which large organizations have not yet even reached human level intelligence? (It is deprecatory to say something was “written by a committee.”)\n", "url": "https://aiimpacts.org/coordinated-human-action-example-superhuman-intelligence/", "title": "Coordinated human action as example of superhuman intelligence", "source": "aiimpacts.org", "source_type": "wordpress", "date_published": "2016-01-21T16:24:12+00:00", "paged_url": "https://aiimpacts.org/feed?paged=18", "authors": ["Ben Hoffman"], "id": "6ff4890662c730801b709a90cb43cb42", "summary": []} {"text": "Recently at AI Impacts\n\n*By Katja Grace, 24 November 2015*\n\n\nWe’ve been working on a few longer term projects lately, so here’s an update in the absence of regular page additions.\n\n\n### New researchers\n\n\nStephanie Zolayvar and John Salvatier have recently joined us, to try out research here.\n\n\nStephanie recently moved to Berkeley from Seattle, where she was a software engineer at Google. She is making sense of a recent spate of interviews with AI researchers (more below), and investigating purported instances of discontinuous progress. She also just made this [glossary of AI risk terminology](http://aiimpacts.org/ai-risk-terminology/).\n\n\nJohn also recently moved to Berkeley from Seattle, where he was a software engineer at Amazon. He has been interviewing AI researchers with me, helping to design a new survey on AI progress, and evaluating different research avenues.\n\n\nI’ve also been working on several smaller scale collaborative projects with other researchers.\n\n\n### AI progress survey\n\n\nWe are making a survey, to help us ask AI researchers about AI progress and timelines. We hope to get answers that are less ambiguous and more current than [past timelines surveys](http://aiimpacts.org/ai-timeline-surveys/). We also hope to learn about the landscape of progress in more detail than we have, to help guide our research.\n\n\n### AI researcher interviews\n\n\nWe have been having in-depth conversations with AI researchers about AI progress and predictions of the future. This is partly to inform the survey, but mostly because there are lots of questions where we want elaborate answers from at least one person, instead of hearing everybody’s one word answers to potentially misunderstood questions. We plan to put up notes on these conversations soon.\n\n\n### Bounty submissions\n\n\nTen people have submitted many more entries to [our bounty experiment](http://aiimpacts.org/ai-impacts-research-bounties/). We are investigating these, but are yet to verify that any of them deserve a bounty. Our request was for examples of discontinuous progress, or very early action on a risk. So far the more lucrative former question has been substantially more popular.\n\n\n### Glossary\n\n\nWe just put up a [glossary of AI safety terms](http://aiimpacts.org/ai-risk-terminology/). Having words for things often helps in thinking about them, so we hope to help in the establishment of words for things. If you notice important words without entries, or concepts without words, please send them our way.\n\n", "url": "https://aiimpacts.org/recently-at-ai-impacts/", "title": "Recently at AI Impacts", "source": "aiimpacts.org", "source_type": "wordpress", "date_published": "2015-11-24T17:09:48+00:00", "paged_url": "https://aiimpacts.org/feed?paged=18", "authors": ["Katja Grace"], "id": "9ec31a13527d40ebe8c368c3641067bd", "summary": []} {"text": "Glossary of AI Risk Terminology and common AI terms\n\nTerms\n-----\n\n\n### A\n\n\n#### **AI timeline**\n\n\nAn expectation about how much time will lapse before important AI events, especially the advent of *[human-level AI](http://aiimpacts.org/human-level-ai/)* or a similar milestone. The term can also refer to the actual periods of time (which are not yet known), rather than an expectation about them.\n\n\n#### **Artificial General Intelligence** (also, ***AGI***)\n\n\nSkill at performing intellectual tasks across at least the range of variety that a human being is capable of. As opposed to skill at certain specific tasks (‘narrow’ AI). That is, synonymous with the more ambiguous *Human-Level AI* for some meanings of the latter*.*\n\n\n#### **Artificial Intelligence** (also, ***AI***)\n\n\nBehavior characteristic of human minds exhibited by man-made machines, and also the area of research focused on developing machines with such behavior. Sometimes used informally to refer to *human-level AI* or another strong form of AI not yet developed.\n\n\n#### **Associative value accretion**\n\n\nA hypothesized approach to value learning in which the AI acquires values using some machinery for synthesizing appropriate new values as it interacts with its environment, inspired by the way humans appear to acquire values (Bostrom 2014, p189-190)[1](https://aiimpacts.org/ai-risk-terminology/#easy-footnote-bottom-1-358 \"Bostrom, Nick. Superintelligence: Paths, Dangers, Strategies. 1st edition. Oxford: Oxford University Press, 2014.\").\n\n\n#### **Anthropic capture**\n\n\nA hypothesized control method in which the AI thinks it might be in a simulation, and so tries to behave in ways that will be rewarded by its simulators (Bostrom 2014 p134).\n\n\n#### **Anthropic reasoning**\n\n\nReaching beliefs (posterior probabilities) over states of the world and your location in it, from priors over possible physical worlds (without your location specified) and evidence about your own situation. For an example where this is controversial, see [The Sleeping Beauty Problem](https://en.wikipedia.org/wiki/Sleeping_Beauty_problem). For more on the topic and its relation to AI, see [here](https://meteuphoric.wordpress.com/anthropic-principles/).\n\n\n#### **Augmentation**\n\n\nAn approach to obtaining a superintelligence with desirable motives that consists of beginning with a creature with desirable motives (eg, a human), then making it smarter, instead of designing good motives from scratch (Bostrom 2014, p142).\n\n\n### B\n\n\n#### **Backpropagation**\n\n\nA fast method of computing the derivative of cost with respect to different parameters in a network, allowing for training neural nets through gradient descent. See [Neural Networks and Deep Learning](http://neuralnetworksanddeeplearning.com/chap2.html)[2](https://aiimpacts.org/ai-risk-terminology/#easy-footnote-bottom-2-358 \"Nielsen, Michael A. “Neural Networks and Deep Learning,” 2015. http://neuralnetworksanddeeplearning.com.\") for a full explanation.\n\n\n#### **Boxing**\n\n\nA control method that consists of constructing the AI’s environment so as to minimize interaction between the AI and the outside world. (Bostrom 2014, p129).\n\n\n### C\n\n\n#### **Capability control methods**\n\n\nStrategies for avoiding undesirable outcomes by limiting what an AI can do (Bostrom 2014, p129).\n\n\n#### **Cognitive enhancement**\n\n\nImprovements to an agent’s mental abilities.\n\n\n#### **Collective superintelligence**\n\n\n“A system composed of a large number of smaller intellects such that the system’s overall performance across many very general domains vastly outstrips that of any current cognitive system” (Bostrom 2014, p54).\n\n\n#### **Computation**\n\n\nA sequence of mechanical operations intended to shed light on something other than this mechanical process itself, through an established relationship between the process and the object of interest.\n\n\n#### **The common good principle**\n\n\n“Superintelligence should be developed only for the benefit of all of humanity and in the service of widely shared ethical ideals” (Bostrom 2014, p254).\n\n\n#### **Crucial consideration**\n\n\nAn idea with the potential to change our views substantially, such as by reversing the sign of the desirability of important interventions.\n\n\n### D\n\n\n#### **Decisive strategic advantage**\n\n\nStrategic superiority (by technology or other means) sufficient to enable an agent to unilaterally control most of the resources of the universe.\n\n\n#### **Direct specification**\n\n\nAn approach to the control problem in which the programmers figure out what humans value, and code it into the AI (Bostrom 2014, p139-40).\n\n\n#### **Domesticity**\n\n\nAn approach to the control problem in which the AI is given goals that limit the range of things it wants to interfere with (Bostrom 2014, p140-1).\n\n\n### E\n\n\n#### **Emulation modulation**\n\n\nStarting with brain emulations with approximately normal human motivations (see ‘Augmentation’), and modifying their motivations using drugs or digital drug analogs.\n\n\n#### **Evolutionary selection approach to value learning**\n\n\nA hypothesized approach to the value learning problem which obtains an AI with desirable values by iterative selection, the same way evolutionary selection produced humans (Bostrom 2014, p187-8).\n\n\n#### **Existential risk**\n\n\nRisk of an adverse outcome that would either annihilate Earth-originating intelligent life or permanently and drastically curtail its potential [(Bostrom 2002)](http://www.nickbostrom.com/existential/risks.html)\n\n\n### F\n\n\n#### **Feature**\n\n\nA dimension in the vector space of activations in a single layer of a neural network (i.e. a neuron activation or linear combination of activations of different neurons)\n\n\n#### **First principal-agent problem**\n\n\nThe well-known problem faced by a sponsor wanting an employee to fulfill their wishes (usually called ‘the principal agent problem’).\n\n\n### G\n\n\n#### **Genie**\n\n\nAn AI that carries out a high level command, then waits for another (Bostrom 2014, p148).\n\n\n### H\n\n\n#### **[Hardware overhang](http://aiimpacts.org/hardware-overhang/)**\n\n\nA situation where large amounts of hardware being used for other purposes become available for AI, usually posited to occur when AI reaches human-level capabilities.\n\n\n#### **Human-level AI**\n\n\nAn AI that matches human capabilities in virtually every domain of interest. Note that this term is used ambiguously; see [our page on human-level AI](http://aiimpacts.org/human-level-ai/). \n\n\n#### **Human-level hardware**\n\n\nHardware that matches the information-processing ability of the human brain.\n\n\n#### **Human-level software**\n\n\nSoftware that matches the algorithmic efficiency of the human brain, for doing the tasks the human brain does.\n\n\n### I\n\n\n#### **Impersonal perspective**\n\n\nThe view that one should act in the best interests of everyone, including those who may be brought into existence by one’s choices (see Person-affecting perspective).\n\n\n#### **Incentive methods**\n\n\nStrategies for controlling an AI that consist of setting up the AI’s environment such that it is in the AI’s interest to cooperate. e.g. a social environment with punishment or social repercussions often achieves this for contemporary agents (Bostrom 2014, p131).\n\n\n#### **Incentive wrapping**\n\n\nProvisions in the goals given to an AI that allocate extra rewards to those who helped bring the AI about (Bostrom 2014, p222-3).\n\n\n#### **Indirect normativity**\n\n\nAn approach to the control problem in which we specify a way to specify what we value, instead of specifying what we value directly (Bostrom, p141-2).\n\n\n#### **Instrumental convergence thesis**\n\n\nWe can identify ‘convergent instrumental values’. That is, subgoals that are useful for a wide range of more fundamental goals, and in a wide range of situations (Bostrom 2014, p109).\n\n\n#### **Intelligence explosion**\n\n\nA hypothesized event in which an AI rapidly improves from ‘relatively modest’ to superhuman level (usually imagined to be as a result of recursive self-improvement).\n\n\n### M\n\n\n#### **Macrostructural development accelerator**\n\n\nAn imagined lever used in thought experiments which slows the large scale features of history (e.g. technological change, geopolitical dynamics) while leaving the small scale features the same.\n\n\n#### **Mind crime**\n\n\nThe mistreatment of morally relevant computations.\n\n\n#### **Moore’s Law**\n\n\nAny of several different consistent, many-decade patterns of exponential improvement that have been observed in digital technologies. The classic version concerns the number of transistors in a dense integrated circuit, which was observed to be doubling around every year when the ‘law’ was formulated in [1965](https://en.wikipedia.org/wiki/Moore%27s_law). [Price-Performance Moore’s Law](https://aiimpacts.org/ai-risk-terminology/#Price-Performance_Moores_Law) is often relevant to AI forecasting.\n\n\n#### **Moral rightness (MR) AI**\n\n\nAn AI which seeks to do what is morally right.\n\n\n#### **Motivational scaffolding**\n\n\nA hypothesized approach to value learning in which the seed AI is given simple goals, and these goals are replaced with more complex ones once it has developed sufficiently sophisticated representational structure (Bostrom 2014, p191-192).\n\n\n#### **Multipolar outcome**\n\n\nA situation after the arrival of superintelligence in which no single agent controls most of the resources. \n\n\n### O\n\n\n#### **Optimization power**\n\n\nThe strength of a process’s ability to improve systems.\n\n\n#### **Oracle**\n\n\nAn AI that only answers questions (Bostrom 2014, p145).\n\n\n#### **Orthogonality thesis**\n\n\nIntelligence and final goals are orthogonal: more or less any level of intelligence could in principle be combined with more or less any final goal.\n\n\n### P\n\n\n#### **Person-affecting perspective**\n\n\nThe view that one should act in the best interests of everyone who already exists, or who will exist independent of one’s choices (see Impersonal perspective).\n\n\n#### **Perverse instantiation**\n\n\nA solution to a posed goal (eg, make humans smile) that is destructive in unforeseen ways (eg, paralyzing face muscles in the smiling position).\n\n\n#### **Price-Performance Moore’s Law**\n\n\nThe [observed pattern](http://aiimpacts.org/trends-in-the-cost-of-computing/) of relatively consistent, long term, exponential price decline for computation.\n\n\n#### **Principle of differential technological development**\n\n\n“Retard the development of dangerous and harmful technologies, especially the ones that raise the level of existential risk; and accelerate the development of beneficial technologies, especially those that reduce the existential risk posed by nature or by other technologies” (Bostrom 2014, p230).\n\n\n#### **Principle of epistemic deference**\n\n\n“A future superintelligence occupies an epistemically superior vantage point: it’s beliefs are (probably, on most topics) more likely than our to be true. We should therefore defer to the superintelligence’s position whenever feasible” (Bostrom 2014, p226).\n\n\n### Q\n\n\n#### **Quality superintelligence**\n\n\n“A system that is at least as fast as a human mind and vastly qualitatively smarter” (Bostrom 2014, p56).\n\n\n### R\n\n\n#### **Recalcitrance**\n\n\nHow difficult a system is to improve.\n\n\n#### **Recursive self-improvement**\n\n\nThe envisaged process of AI (perhaps a seed AI) iteratively improving itself.\n\n\n#### **Reinforcement learning approach to value learning**\n\n\nA hypothesized approach to value learning in which the AI is rewarded for behaviors that more closely approximate human values (Bostrom 2014, p188-9).\n\n\n### S\n\n\n#### **Second principal-agent problem**\n\n\nThe emerging problem of a developer wanting their AI to fulfill their wishes.\n\n\n#### **Seed AI**\n\n\nA modest AI which can bootstrap into an impressive AI by improving its own architecture.\n\n\n#### **Singleton**\n\n\nAn agent that is internally coordinated and has no opponents.\n\n\n#### **Sovereign**\n\n\nAn AI that acts autonomously in the world, in pursuit of potentially long range objectives (Bostrom 2014, p148).\n\n\n#### **Speed superintelligence**\n\n\n“A system that can do all that a human intellect can do, but much faster” (Bostrom 2014, p53).\n\n\n#### **State risk**\n\n\nA risk that comes from being in a certain state, such that the amount of risk is a function of the time spent there. For example, the state of not having the technology to defend from asteroid impacts carries risk proportional to the time we spend in it.\n\n\n#### **Step risk**\n\n\nA risk that comes from making a transition. Here the amount of risk is not a simple function of how long the transition takes. For example, traversing a minefield is not safer if done more quickly.\n\n\n#### **Stunting**\n\n\nA control method that consists of limiting the AI’s capabilities, for instance as by limiting the AI’s access to information (Bostrom 2014, p135).\n\n\n#### **Superintelligence**\n\n\nAny intellect that greatly exceeds the cognitive performance of humans in virtually all domains of interest (Bostrom 2014, p22).\n\n\n### T\n\n\n#### **Takeoff**\n\n\nThe event of the emergence of a superintelligence, often characterized by its speed: ‘slow takeoff’ takes decades or centuries, ‘moderate takeoff’ takes months or years and ‘fast takeoff’ takes minutes to days.\n\n\n#### **Technological completion conjecture**\n\n\nIf scientific and technological development efforts do not cease, then all important basic capabilities that could be obtained through some possible technology will be obtained (Bostrom 2014, p127).\n\n\n#### **Technology coupling**\n\n\nA predictable timing relationship between two technologies, such that hastening of the first technology will hasten the second, either because the second is a precursor or because it is a natural consequence (Bostrom 2014, p236-8) e.g. brain emulation is plausibly coupled to ‘neuromorphic’ AI, because the understanding required to emulate a brain might allow one to more quickly create an AI on similar principles.\n\n\n#### **Tool AI**\n\n\nAn AI that is not ‘like an agent’, but like a more flexible and capable version of contemporary software. Most notably perhaps, it is not goal-directed (Bostrom 2014, p151).\n\n\n### U\n\n\n#### Utility function\n\n\nA mapping from states of the world to real numbers (‘utilities’), describing an entity’s degree of preference for different states of the world. Given the choice between two lotteries, the entity prefers the lottery with the highest ‘expected utility’, which is to say, sum of utilities of possible states weighted by the probability of those states occurring.\n\n\n### V\n\n\n#### **Value learning**\n\n\nAn approach to the value loading problem in which the AI learns the values that humans want it to pursue (Bostrom 2014, p207).\n\n\n#### **Value loading problem**\n\n\nThe problem of causing the AI to pursue human values (Bostrom 2014, p185).\n\n\n### W\n\n\n#### **Wise-Singleton Sustainability Threshold**\n\n\nA capability set exceeds the wise-singleton threshold if and only if a patient and existential risk-savvy system with that capability set would, if it face no intelligent opposition or competition, be able to colonize and re-engineer a large part of the accessible universe (Bostrom 2014, p100).\n\n\n#### **Whole-brain emulation**\n\n\nMachine intelligence created by copying the computational structure of the human brain.\n\n\n#### **Word embedding**\n\n\nA mapping of words to high-dimensional vectors that has been trained to be useful in a word task such that the arrangement of words in the vector space is meaningful. For instance, words near one other in the vector-space are related, and similar relationships between different pairs of words correspond to similar vectors between them, so that e.g. if E(x) is the vector for the word ‘x’, then E(king) – E(queen) ≈ E(woman) – E(man). Word embeddings are explained in more detail [here](https://colah.github.io/posts/2014-07-NLP-RNNs-Representations/).\n\n\nNotes\n-----\n\n", "url": "https://aiimpacts.org/ai-risk-terminology/", "title": "Glossary of AI Risk Terminology and common AI terms", "source": "aiimpacts.org", "source_type": "wordpress", "date_published": "2015-10-30T22:58:34+00:00", "paged_url": "https://aiimpacts.org/feed?paged=18", "authors": ["Katja Grace"], "id": "7037e9aa1be45a87ff1aa2b1adfc6752", "summary": []} {"text": "AI timelines and strategies\n\n*AI Impacts sometimes invites guest posts from fellow thinkers on the future of AI. These are not intended to relate closely to our current research, nor to necessarily reflect our views. However we think they are worthy contributions to the discussion of AI forecasting and strategy.*\n\n\n*This is a guest post by Sarah Constantin, 20 August 2015*\n\n\nOne frame of looking at AI risk is the “geopolitical” stance. Who are the major players who might create risky strong AI? How could they be influenced or prevented from producing existential risks? How could safety-minded institutions gain power or influence over the future of AI? What is the correct strategy for reducing AI risk?\n\n\nThe correct strategy depends sharply on the timeline for when strong AI is likely to be developed. Will it be in 10 years, 50 years, 100 years or more? This has implications for AI safety research. If a basic research program on AI safety takes 10-20 years to complete and strong AI is coming in 10 years, then research is relatively pointless. If basic research takes 10-20 years and strong AI is coming more than 100 years from now (if at all), then research can wait. If basic research takes 10-20 years and strong AI is coming in around 50 years, then research is a good idea.\n\n\nAnother relevant issue for AI timelines and strategies is the boom-and-bust cycle in AI. Funding for AI research and progress on AI has historically fluctuated since the 1960s, with roughly 15 years between “booms.” The timeline between booms may change in the future, but fluctuation in investment, research funding, and popular attention seems to be a constant in scientific/technical fields.\n\n\nEach AI boom has typically focused on a handful of techniques (GOFAI in the 1970’s, neural nets and expert systems in the 1980’s) which promised to deliver strong AI but eventually ran into limits and faced a collapse of funding and investment. The current AI boom is primarily focused on massively parallel processing and machine learning, particularly deep neural nets.\n\n\nThis is relevant because institutional and human capital is lost between booms. While leading universities can survive for centuries, innovative companies are usually only at their peak for a decade or so. It is unlikely that the tech companies doing the most innovation in AI during one boom will be the ones leading subsequent booms. (We don’t usually look to 1980’s expert systems companies for guidance on AI today.) If there were to be a Pax Googleiana lasting 50 years, it might make sense for people concerned with AI safety to just do research and development within Google. But the history of the tech industry suggests that’s not likely. Which means that any attempt to influence long-term AI risk will need to survive the collapse of current companies and the end of the current wave of popularity of AI.\n\n\nThe “extremely short-term AI risk scenario” (of strong AI arising within a decade) is not a popular view among experts; most contemporary surveys of AI researchers predict that strong AI will arise sometime in the mid-to-late 21st century. If we take the view that strong AI in the 2020’s is vanishingly unlikely (which is more “conservative” than the results of most AI surveys, but may be more representative of the mainstream computer science view), then this has various implications for AI risk strategy that seem to be rarely considered explicitly.\n\n\nIn the “long-term AI risk scenario”, there will be at least one “AI winter” before strong AI is developed. We can expect a period (or multiple periods) in the future where AI will be poorly funded and popularly discredited. We can expect that there are one or more jumps in innovation that will need to occur before human-level AI will be possible. And, given the typical life cycle of corporations, we can expect that if strong AI is developed, it will probably be developed by an institution that does not exist yet.\n\n\nIn the “long-term AI risk scenario”, there will probably be time to develop at least some theory of AI safety and the behavior of superintelligent agents. Basic research in computer science (and perhaps neuroscience) may well be beneficial in general from an AI risk perspective. If research on safety can progress during “AI winters” while progress on AI in general halts, then winters are particularly good news for safety. In this long-term scenario, there is no short-term imperative to cease progress on “narrow AI”, because contemporary narrow AI is almost certainly not risky.\n\n\nIn the “long-term AI risk scenario”, another important goal besides basic research is to send a message to the future. Today’s leading tech CEOs will not be facing decisions about strong AI; the critical decisionmakers may be people who haven’t been born yet, or people who are currently young and just starting their careers. Institutional cultures are rarely built to last decades. What can we do today to ensure that AI safety will be a priority decades from now, long after the current wave of interest in AI has come to seem faddish and misguided?\n\n\nThe mid- or late 21st century may be a significantly different place than the early 21st century. Economic and political situations fluctuate. The US may no longer be the world’s largest economy. Corporations and universities may look very different. Imagine someone speculating about artificial intelligence in 1965 and trying to influence the world of 2015. Trying to pass laws or influence policy at leading corporations in 1965 might not have had a lasting effect (this would be a useful historical topic to investigate in more detail.)\n\n\nAnd what if the next fifty years looks more like the cataclysmic first half of the 20th century than the comparatively stable second half of the 20th century? How could a speculative thinker of 1895 hope to influence the world of 1945?\n\n\nEducational and cultural goals, broadly speaking, seem relevant in this scenario. It will be important to have a lasting influence on the intellectual culture of future generations.\n\n\nFor instance: if fields of theoretical computer science relevant for AI risk are developed and included in mainstream textbooks, then the CS majors of 2050 who might grow up to build strong AI will know about the concerns being raised today as more than a forgotten historical curiosity. Of course, they might not be CS majors, and perhaps they won’t even be college students. We have to think about robust transmission of information.\n\n\nIn the “long-term AI risk scenario”, the important task is preparing future generations of AI researchers and developers to avoid dangerous strong AI. This means performing and disseminating and teaching basic research in new theoretical fields necessary for understanding the behavior of superintelligent agents.\n\n\nA “geopolitical” approach is extremely difficult if we don’t know who the players will be. We’d like the future institutions that will eventually develop strong AI to be run and staffed by people who will incorporate AI safety into their plans. This means that a theory of AI safety needs to be developed and disseminated widely.\n\n\nUltimately, long-term AI strategy bifurcates, depending on whether the future of AI is more “centralized” or “decentralized.”\n\n\nIn a “centralized” future, a small number of individuals, perhaps researchers themselves, contribute most innovation in AI, and the important mission is to influence them to pursue research in helpful rather than harmful directions.\n\n\nIn a “decentralized” future, progress in AI is spread over a broad population of institutions, and the important mission is to develop something like “industry best practices” — identifying which engineering practices are dangerous and instituting broadly shared standards that avoid them. This may involve producing new institutions focused on safety.\n\n\nBasic research is an important prerequisite for both the “centralized” and “decentralized” strategies, because currently we do not know what kinds of progress in AI (if any) are dangerous.\n\n\nThe “centralized” strategy means promoting something like an intellectual culture, or philosophy, among the strongest researchers of the future; it is something like an educational mission. We would like future generations of AI researchers to have certain habits of mind: in particular, the ability to reason about the dramatic practical consequences of abstract concepts. The discoverers of quantum mechanics were able to understand that the development of the atomic bomb would have serious consequences for humanity, and to make decisions accordingly. We would like the future discoverers of major advances in AI to understand the same. This means that today, we will need to communicate (through books, schools, and other cultural institutions, traditional and new) certain intellectual and moral virtues, particularly to the brightest young people.\n\n\nThe “decentralized” strategy will involve taking the theoretical insights from basic AI research and making them broadly implementable. Are some types of “narrow AI” particularly likely to lead to strong AI? Are there some precautions which, on the margin, make harmful strong AI less likely? Which kinds of precautions are least costly in immediate terms and most compatible with the profit and performance needs of the tech industry? To the extent that AI progress is decentralized and incremental, the goal is to ensure that it is difficult to go very far in the wrong direction. Once we know what we mean by a “wrong direction”, this is a matter of building long-term institutions and incentives that shape AI progress towards beneficial directions.\n\n\nThe assumption that strong AI is a long-term rather than a short-term risk affects strategy significantly. Influencing current leading players is not particularly important; promoting basic research is very important; disseminating information and transmitting culture to future generations, as well as building new institutions, is the most effective way to prepare for AI advances decades from now.\n\n\nIn the event that AI never becomes a serious risk, developing institutions and intellectual cultures that can successfully reason about AI is still societally valuable. The skill (in institutions and individuals) of taking theoretical considerations seriously and translating them into practical actions for the benefit of humanity is useful for civilizational stability in general. What’s important is recognizing that this is a long-term strategy — i.e. thinking more than ten years ahead. Planning for future decades looks different from taking advantage of the current boom in funding and attention for AI and locally hill-climbing.\n\n\n*Sarah Constantin blogs at [Otium](https://srconstantin.wordpress.com/). She recently graduated from Yale with a PhD in mathematics.*\n\n", "url": "https://aiimpacts.org/ai-timelines-and-strategies/", "title": "AI timelines and strategies", "source": "aiimpacts.org", "source_type": "wordpress", "date_published": "2015-08-21T06:55:25+00:00", "paged_url": "https://aiimpacts.org/feed?paged=18", "authors": ["Katja Grace"], "id": "18e915ace8ee9e21aa3502dd0b0a0f1b", "summary": []} {"text": "Introducing research bounties\n\n*By Katja Grace, 7 August 2015*\n\n\nSometimes we like to experiment with novel research methods and formats. Today we are introducing ‘[AI Impacts Research Bounties](http://aiimpacts.org/ai-impacts-research-bounties/)‘, in which you get money if you send us inputs to some of our research.\n\n\nTo start, we have two bounties: one for showing us instances of [abrupt technological progress](http://aiimpacts.org/cases-of-discontinuous-technological-progress/), and one for pointing us to instances of people acting to avert risks decades ahead of time. Rewards currently range from $20 to $500, and anyone can enter. We may add more bounties, or adjust prices, according to responses. We welcome feedback on any aspect of this experiment.\n\n\nThanks to John Salvatier for ongoing collaboration on this project.\n\n", "url": "https://aiimpacts.org/introducing-research-bounties/", "title": "Introducing research bounties", "source": "aiimpacts.org", "source_type": "wordpress", "date_published": "2015-08-07T07:23:04+00:00", "paged_url": "https://aiimpacts.org/feed?paged=19", "authors": ["Katja Grace"], "id": "8f71d8103aef6638ec1fe1659a5e5cf1", "summary": []} {"text": "AI Impacts research bounties\n\nWe are offering rewards for several inputs to our research, described below. These offers have no specific deadline except where noted. We may modify them or take them down, but will give at least one week’s notice here unless there is strong reason not to. To submit an entry, email katja@intelligence.org. There is currently a large backlog of entries to check, so new entries will not receive a rapid response.\n\n\n### 1. An example of discontinuous technological progress ($50-$500)\n\n\n*This bounty offer is no longer available after 3 November 2016.*\n\n\nWe are interested in finding more examples of large discontinuous technological progress to add to [our collection](http://aiimpacts.org/cases-of-discontinuous-technological-progress/). We’re offering a bounty of around $50-500 per good example.\n\n\nWe currently know of [two good examples](http://aiimpacts.org/cases-of-discontinuous-technological-progress/) (and one moderate example):\n\n\n1. **Nuclear weapons** discontinuously increased the [relative effectiveness](https://en.wikipedia.org/wiki/Relative_effectiveness_factor) of explosives.\n2. **High temperature superconductors**led to a dramatic increase in the highest temperature at which superconducting was possible.\n\n\nTo assess discontinuity, we’ve been using “number of years worth of progress at past rates”, as measured by any relevant metric of technological progress. For example, the discovery of nuclear weapons was equal to about 6,000 years worth of previous progress in the relative effectiveness of explosives. However, we are also interested in examples that seem intuitively discontinuous, even if they don’t exactly fit the criteria of being a large number of year’s progress in one go.\n\n\nThings that make examples better:\n\n\n1. **Size:** Better examples represent larger changes. More than 20 times normal annual progress is ideal.\n2. **Sharpness:** Better examples happened over shorter periods. Over less than a year is ideal.\n3. **Breadth:** Metrics that measure larger categories of things are better. For example, fast adoption curves for highly specific categories (say a particular version of some software) is much less interesting than fast adoption curves for much broader categories (say a whole category of software).\n4. **Rarity:**As we receive more examples, the interestingness of each one will tend to decline.\n\n\nAI Impacts is willing to pay more for better examples. Basically we will judge how interesting your example is and then reward you based on that. We will accept examples that violate our stated preferences but satisfy the spirit of the bounty. Our guess is that we would pay about $500 for another example as good nuclear weapons.\n\n\n**How to enter:** all that is necessary to submit an example is to email us a paragraph describing the example, along with sources to verify your claims (such sources are likely to involve at least one time series of success on a particular metric). Note that an example should be of the form ‘A caused abrupt progress in metric B’. For instance, ‘The boliolicopter caused abrupt progress in the maximum rate of fermblangling at sub-freezing temperatures’.\n\n\n### 2. An example of early action on a risk ($20-$100)\n\n\n*This bounty offer is no longer available after 3 November 2016.*\n\n\n**We want:** a one sentence description of a case where at least one person acted to avert a risk that was least fifteen years away, along with a link or citation supporting the claim that the action preceded the risk by at least fifteen years. \n\n\n**We will give:** up $100, with higher sums for examples that are better according to our judgment (see criteria for betterness below), and which we don’t already know about. We might go over $100 for exceptionally good examples.\n\n\n**Further details**\n\n\nExamples are better if:\n\n\n1. **The risk is more novel:** relatively similar problems have not arisen before, and would probably not arise sooner than fifteen years in the future. e.g. Poverty in retirement is a risk people often prepare for more than fifteen year before it befalls them, however it is not very novel because other people already face an essentially identical risk, and have done many times before.\n2. **The solution is more specific:** the action taken would not be nearly as useful if the risk disappeared. e.g. Saving money to escape is a reasonable solution to expecting your country to face civil war soon. However saving money is fairly useful in any case, so this solution is not very specific.\n3. **We haven’t received a lot of examples:** as we collect more examples, the value of each one will tend to decline.\n\n\nSome examples: \n\n\n1. **Leo Szilard’s secret nuclear patent**: the threat of nuclear weapons was quite novel. It’s unclear when Szilard expected such weapons, but quite plausibly at least fifteen years later in 1934. The secret patent does not seem broadly useful, though useful for encouraging more local nuclear research, which is somewhat more broadly useful than secrecy per se. More details in [this report](https://intelligence.org/files/SzilardNuclearWeapons.pdf). This is a reasonably good example.\n2. **The Asilomar Conference on recombinant DNA**: the risk of was arguably quite novel (genetically engineered pandemics), and the solution was reasonably specific (safety rules for dealing with recombinant DNA). However the risks people were concerned about were immediate, rather than decades hence. More details [here](https://intelligence.org/2015/06/30/new-report-the-asilomar-conference-a-case-study-in-risk-mitigation/). This is not a good example.\n\n\nEvidence that the example is better in the above ways is also welcome, though we reserve the right not to explore it fully.\n\n", "url": "https://aiimpacts.org/ai-impacts-research-bounties/", "title": "AI Impacts research bounties", "source": "aiimpacts.org", "source_type": "wordpress", "date_published": "2015-08-07T06:46:38+00:00", "paged_url": "https://aiimpacts.org/feed?paged=19", "authors": ["Katja Grace"], "id": "45f250265fab569565632b1542eba335", "summary": []} {"text": "Time flies when robots rule the earth\n\n*By Katja Grace, 28 July 2015*\n\n\nThis week Robin Hanson is finishing off his much anticipated book, [The Age of Em: Work, Love and Life When Robots Rule the Earth](http://www.overcomingbias.com/2015/03/oxford-to-publish-the-age-of-em.html). He recently told me that it would be helpful to include rough numbers for the brain’s memory and computing capacity in the book, so I agreed to prioritize finding the ones AI Impacts didn’t already have. Consequently we just put up [new](http://aiimpacts.org/costs-of-information-storage/) [pages](http://aiimpacts.org/information-storage-in-the-brain/) [about](http://aiimpacts.org/cost-of-human-level-information-storage/) information storage in the brain. We also made a [summary](http://aiimpacts.org/costs-of-human-level-hardware/) of related ‘human-level’ hardware pages, and an [index](http://aiimpacts.org/index-of-hardware-articles/) of pages about hardware in general.\n\n\nRobin’s intended use for these numbers is interesting. The premise of his book is that one day (perhaps in the far future) human minds might be [emulated](https://en.wikipedia.org/wiki/Mind_uploading) on computers, and that this would produce a society that is somewhere between recognizably human and predictably alien. Robin’s project is a detailed account of life in such a society, as far as it can be discerned by peering through social science and engineering theory.\n\n\nOne prediction Robin makes is that these emulated minds (’ems’) will run at a wide variety of speeds, depending on their purposes and the incentives. So some ems will have whole lifetimes while others are getting started on a single thought. Robin wanted to know how slow the very slowest ems would run. And for this, he wanted to know much memory the brain uses, and how much computing it does.\n\n\nHis reasoning is as follows. The main costs of running emulations are computing hardware and memory. If Anna is running twice as fast as Ben, then Anna needs about twice as much computing power to run, which will cost about twice as much. However Anna still uses around as much memory as Ben to store the contents of her brain over time. So if most of the cost of an emulation is in computation, then halving the speed would halve the cost, and would often be worth it. But once an emulation is moving so slowly that memory becomes the main cost, slowing down by half makes little difference, and soon stops being worth it. So the slowest emulations should run at around the speed at which computing hardware and memory contribute similarly to cost.\n\n\n[Hardware](http://aiimpacts.org/trends-in-the-cost-of-computing/) and [memory](http://aiimpacts.org/costs-of-information-storage/) costs have been falling at roughly similar rates in the past, so if this continues, then the ratio between their costs now is a reasonable (if noisy) predictor of their ratio in several decades time. Given [our numbers](http://aiimpacts.org/costs-of-human-level-hardware/), Robin estimates that the slowest emulations will operate at between a one hundred trillionth of human speed and one millionth of human speed, with a middle estimate of one tenth of a billionth of human speed.\n\n\nAt these rates, immortality looks a lot like dying. If you had been experiencing the world at these speeds since the beginning of the universe, somewhere between an hour and a thousand years would seem to have passed, with a middle estimate of a year. Even if the em economy somehow lasts for a thousand years, running this slowly would mean immediately jumping into whatever comes next.\n\n\nThese things are rough of course, but it seems pretty cool to me that we can make reasonable guesses at all about such exotic future scenarios, using clues from our everyday world, like the prevailing prices of hard disks and memory.\n\n\nIf you are near Berkeley, CA and want to think more about this kind of stuff, or in this kind of style, remember you can come and meet Robin and partake in more economic futurism at our event [this Thursday](http://aiimpacts.org/event-exercises-in-economic-futurism/). We expect a good number of attendees already, but could squeeze in a few more.\n\n\n*Image: [Robin Hanson in a field](https://commons.wikimedia.org/wiki/File:Robin_Hanson_in_a_field.jpg), taken by Katja Grace*\n\n", "url": "https://aiimpacts.org/time-flies-when-robots-rule-the-earth/", "title": "Time flies when robots rule the earth", "source": "aiimpacts.org", "source_type": "wordpress", "date_published": "2015-07-28T22:39:43+00:00", "paged_url": "https://aiimpacts.org/feed?paged=19", "authors": ["Katja Grace"], "id": "3fb68a06e3078d1eac3e90044e2c904f", "summary": []} {"text": "Costs of human-level hardware\n\nComputing hardware which is equivalent to the brain –\n\n\n* in terms of FLOPS probably costs between $1 x 10⁵ and $3 x 10¹⁶, or $2/hour-$700bn/hour.\n* in terms of TEPS probably costs $200M – $7B, or or $4,700 – $170,000/hour (including energy costs in the hourly rate).\n* in terms of secondary memory probably costs $300-3,000, or $0.007-$0.07/hour.\n\n\nDetails\n-------\n\n\n### Partial costs\n\n\n#### Computation\n\n\n*Main articles: [Brain performance in FLOPS](http://aiimpacts.org/brain-performance-in-flops/), [Current FLOPS prices](http://aiimpacts.org/current-flops-prices/), [Trends in the costs of computing](http://aiimpacts.org/trends-in-the-cost-of-computing/)*\n\n\n[FLoating-point Operations Per Second](https://en.wikipedia.org/wiki/FLOPS) (FLOPS) is a measure of computer performance that emphasizes computing capacity. The human brain is estimated to perform between 1013.5 and 1025FLOPS. Hardware [currently costs](http://aiimpacts.org/current-flops-prices/) around $3 x 10⁻⁹/FLOPS, or $7 x 10-14/FLOPShour. This makes the current price of hardware which has equivalent computing capacity to the human brain between $1 x 10⁵ and $3 x 10¹⁶, or $2/hour-$700bn/hour if hardware is used for five years.\n\n\nThe price of FLOPS [has probably](http://aiimpacts.org/trends-in-the-cost-of-computing/) decreased by a factor of ten roughly every four years in the last quarter of a century.\n\n\n#### Communication\n\n\n*Main articles: [Brain performance in TEPS](http://aiimpacts.org/brain-performance-in-teps/), [The cost of TEPS](http://aiimpacts.org/cost-of-teps/)*\n\n\n[Traversed Edges Per Second](https://en.wikipedia.org/wiki/Traversed_edges_per_second) (TEPS) is a measure of computer performance that emphasizes communication capacity. The human brain [is estimated](http://aiimpacts.org/brain-performance-in-teps/) to perform at 0.18 – 6.4 x 10⁵ GTEPS. Communication capacity [costs](http://aiimpacts.org/cost-of-teps/) around $11,000/GTEP or $0.26/GTEPShour in 2015, when amortized over five years and combined with energy costs. This makes the current price of hardware which has equivalent communication capacity to the human brain around $200M – $7B in total, or $4,700 – $170,000/hour including energy costs.\n\n\n[We estimate](http://aiimpacts.org/cost-of-teps/) that the price of TEPS falls by a factor of ten every four years, based the relationship between TEPS and FLOPS.\n\n\n#### Information storage\n\n\n*Main articles: [Information storage in the brain](http://aiimpacts.org/information-storage-in-the-brain/), [Costs of information storage](http://aiimpacts.org/costs-of-information-storage/), [Costs of human-level information storage](http://aiimpacts.org/cost-of-human-level-information-storage/)*\n\n\n[Computer memory](https://en.wikipedia.org/wiki/Computer_memory) comes in primary and secondary forms. Primary memory (e.g. RAM) is intended to be accessed frequently, while secondary memory is slower to access but has higher capacity. Here we estimate the secondary memory requirements ofthe brain. The human brain [is estimated](http://aiimpacts.org/information-storage-in-the-brain/) to store around 10-100TB of data. Secondary storage [costs around $30/TB](http://aiimpacts.org/costs-of-information-storage/) in 2015. [This means](http://aiimpacts.org/cost-of-human-level-information-storage/) it costs $300-3,000 for enough storage to store the contents of a human brain, or $0.007-$0.07/hour if hardware is used for five years.\n\n\nIn the long run [the price of secondary memory has declined](http://aiimpacts.org/costs-of-information-storage/) by an order of magnitude roughly every 4.6 years. However the rate has declined so much that prices haven’t substantially dropped since 2011 (in 2015).\n\n\n### Interpreting partial costs\n\n\nCalculating the total cost of hardware that is relevantly equivalent to the brain is not as simple as adding the partial costs as listed. FLOPS and TEPS are measures of different capabilities of the same hardware, so if you pay for TEPS at the aforementioned prices, you will also receive FLOPS.\n\n\nThe above list is also not exhaustive: there may be substantial hardware costs that we haven’t included.\n\n", "url": "https://aiimpacts.org/costs-of-human-level-hardware/", "title": "Costs of human-level hardware", "source": "aiimpacts.org", "source_type": "wordpress", "date_published": "2015-07-26T23:21:54+00:00", "paged_url": "https://aiimpacts.org/feed?paged=19", "authors": ["Katja Grace"], "id": "74b79718e03a8edb9bd2cd180accedbf", "summary": []} {"text": "Brain performance in FLOPS\n\nThe computing power needed to replicate the human brain’s relevant activities has been estimated by various authors, with answers ranging from 1012 to 1028 FLOPS.\n\n\nDetails\n-------\n\n\n### Notes\n\n\nWe have not investigated the brain’s performance in FLOPS in detail, nor substantially reviewed the literature since 2015. This page summarizes others’ estimates that we are aware of, as well as the implications of our investigation into brain performance in TEPS.\n\n\n### Estimates\n\n\n#### Sandberg and Bostrom 2008: estimates and review\n\n\n[Sandberg and Bostrom](http://www.fhi.ox.ac.uk/brain-emulation-roadmap-report.pdf) project the processing required to emulate a human brain at different levels of detail.[1](https://aiimpacts.org/brain-performance-in-flops/#easy-footnote-bottom-1-596 \"From Sandberg and Bostrom, table 9: Processing demands (emulation only, human brain)(p80):
\n- \n
- spiking neural network: 1018 FLOPS (Earliest year, $1 million: commodity computer estimate: 2042, supercomputer estimate: 2019) \n
- electrophysiology: 1022 FLOPS (Earliest year, $1 million: commodity computer estimate: 2068, supercomputer estimate: 2033) \n
- metabolome: 1025 FLOPS (Earliest year, $1 million: commodity computer estimate: 2087, supercomputer estimate: 2044) \n
\") For the three levels that their workshop participants considered most plausible, their estimates are 1018, 1022, and 1025 FLOPS.\n\n\nThey also summarize other brain compute estimates, as shown below (we reproduce their Table 10).[2](https://aiimpacts.org/brain-performance-in-flops/#easy-footnote-bottom-2-596 \"See appendix A, Nick Bostrom and Anders Sandberg, “Whole Brain Emulation: A Roadmap,” 2008, 130.\") We have not reviewed these estimates, and some do not appear superficially credible to us.\n\n\n[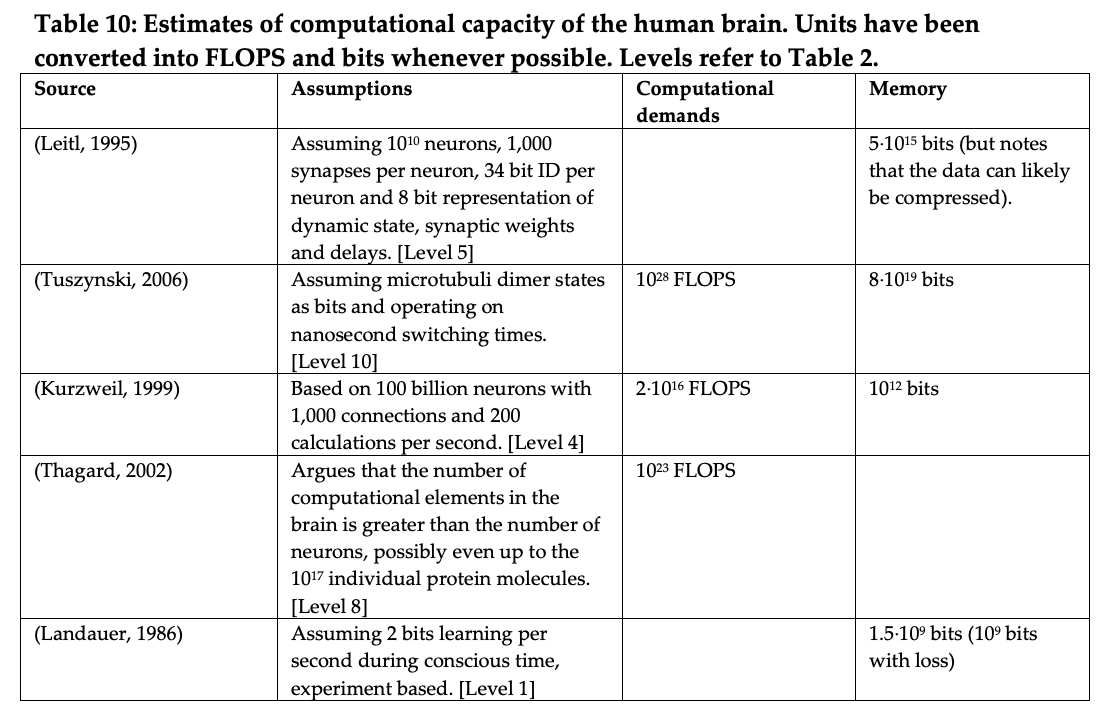](http://aiimpacts.org/wp-content/uploads/2015/07/Screen-Shot-2019-07-06-at-4.47.04-PM.png)\n\n\n[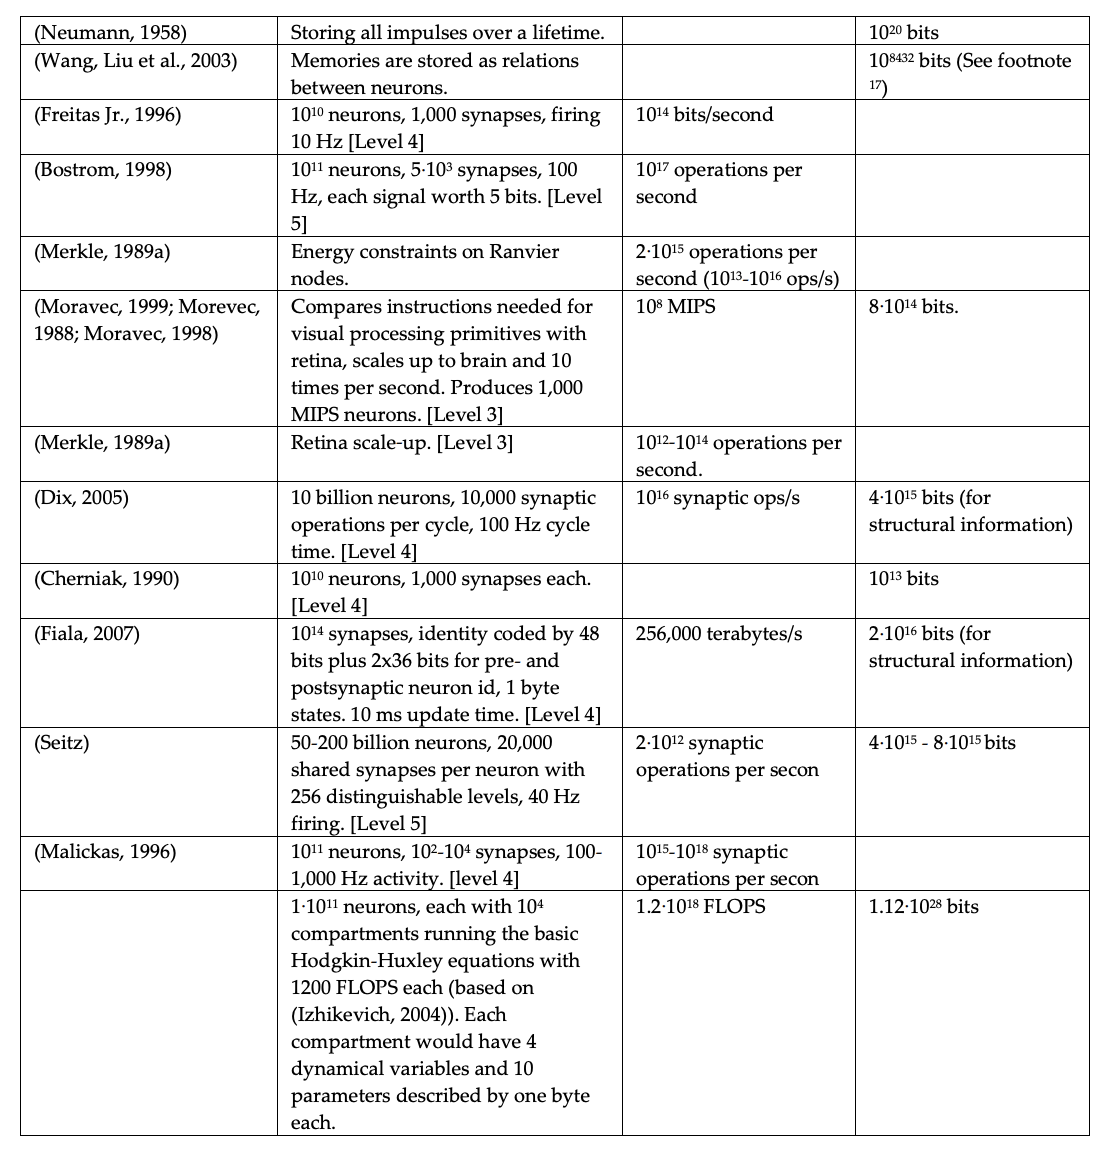](http://aiimpacts.org/wp-content/uploads/2015/07/Screen-Shot-2019-07-06-at-4.47.27-PM.png)\n\n\n#### Drexler 2018\n\n\nDrexler looks at multiple comparisons between narrow AI tasks and neural tasks, and finds that they suggest the ‘basic functional capacity’ of the human brain is less than one petaFLOPS (1015).[3](https://aiimpacts.org/brain-performance-in-flops/#easy-footnote-bottom-3-596 \"“Multiple comparisons between narrow AI tasks and narrow neural tasks concur in suggesting that PFLOP/s computational systems exceed the basic functional capacity of the human brain.”
\nK Eric Drexler, “Reframing Superintelligence,” 2019, 182.\")\n\n\n#### Conversion from brain performance in TEPS\n\n\nAmong a small number of computers we compared[4](https://aiimpacts.org/brain-performance-in-flops/#easy-footnote-bottom-4-596 \"“The [eight] supercomputers measured here consistently achieve around 1-2 GTEPS per scaled TFLOPS (see Figure 3). The median ratio is 1.9 GTEPS/TFLOPS, the mean is 1.7 GTEPS/TFLOP, and the variance 0.14 GTEPS/TFLOP. ” See Relationship between FLOPS and TEPS here for more details\"), FLOPS and TEPS seem to vary proportionally, at a rate of around 1.7 GTEPS/TFLOP. We also [estimate](http://aiimpacts.org/brain-performance-in-teps/) that the human brain performs around 0.18 – 6.4 \\* 1014 TEPS. Thus if the FLOPS:TEPS ratio in brains is similar to that in computers, a brain would perform around 0.9 – 33.7 \\* 1016 FLOPS.[5](https://aiimpacts.org/brain-performance-in-flops/#easy-footnote-bottom-5-596 \"0.18 – 6.4 * 1014 TEPS =0.18 – 6.4 * 105 GTEPS =0.18 – 6.4 * 105 GTEPS * 1TFLOPS/1.9GTEPS = 9,000-337,000 TFLOPS = 0.9 – 33.7 * 1016FLOPS\") We have not investigated how similar this ratio is likely to be.\n\n\nNotes\n-----\n\n", "url": "https://aiimpacts.org/brain-performance-in-flops/", "title": "Brain performance in FLOPS", "source": "aiimpacts.org", "source_type": "wordpress", "date_published": "2015-07-26T19:33:41+00:00", "paged_url": "https://aiimpacts.org/feed?paged=19", "authors": ["Katja Grace"], "id": "0f43a2813b71c780a8ebb4162e2cf72b", "summary": []} {"text": "Index of articles about hardware\n\n### Hardware in terms of computing capacity (FLOPS and MIPS)\n\n\n[Brain performance in FLOPS](http://aiimpacts.org/brain-performance-in-flops/)\n\n\n[2019 recent trends in GPU price per FLOPS](https://aiimpacts.org/2019-recent-trends-in-gpu-price-per-flops/)\n\n\n[Electrical efficiency of computing](https://aiimpacts.org/electrical-efficiency-of-computing/)\n\n\n[2018 price of performance by Tensor Processing Units](https://aiimpacts.org/2018-price-of-performance-by-tensor-processing-units/)\n\n\n[2017 trend in the cost of computing](https://aiimpacts.org/recent-trend-in-the-cost-of-computing/)\n\n\n[Price-performance trend in top supercomputers](https://aiimpacts.org/price-performance-trend-in-top-supercomputers/)\n\n\n[2017 FLOPS prices](http://aiimpacts.org/current-flops-prices/)\n\n\n[Trends in the cost of computing](http://aiimpacts.org/trends-in-the-cost-of-computing/)\n\n\n[Wikipedia history of GFLOPS costs](http://aiimpacts.org/wikipedia-history-of-gflops-costs/)\n\n\n### Hardware in terms of communication capacity (TEPS)\n\n\n[Brain performance in TEPS](http://aiimpacts.org/brain-performance-in-teps/) (includes the cost of brain-level TEPS performance on current hardware)\n\n\n[The cost of TEPS](http://aiimpacts.org/cost-of-teps/) (includes current costs, trends and relationship to other measures of hardware price)\n\n\n### Information storage\n\n\n[Information storage in the brain](http://aiimpacts.org/information-storage-in-the-brain/)\n\n\n[Costs of information storage](http://aiimpacts.org/costs-of-information-storage/)\n\n\n[Costs of human-level information storage](http://aiimpacts.org/cost-of-human-level-information-storage/)\n\n\n### Other\n\n\n[Costs of human-level hardware](http://aiimpacts.org/costs-of-human-level-hardware/)\n\n\n[2019 recent trends in Geekbench score per CPU price](https://aiimpacts.org/2019-recent-trends-in-geekbench-score-per-cpu-price/)\n\n\n[Trends in DRAM price per gigabyte](https://aiimpacts.org/trends-in-dram-price-per-gigabyte/)\n\n\n[Effect of marginal hardware on artificial general intelligence](https://aiimpacts.org/effect-of-marginal-hardware-on-artificial-general-intelligence/)\n\n\n[Research topic: hardware, software and AI](http://aiimpacts.org/research-topic-hardware-software-and-ai/)\n\n\n[Index of articles about hardware](http://aiimpacts.org/index-of-hardware-articles/)\n\n\n### Related blog posts\n\n\n*[Preliminary prices for human level hardware](http://aiimpacts.org/preliminary-prices-for-human-level-hardware/) (4 April 2015)*\n\n\n*[A new approach to predicting brain-computer parity](http://aiimpacts.org/tepsbrainestimate/) (7 May 2015)*\n\n\n*[Time flies when robots rule the earth](http://aiimpacts.org/time-flies-when-robots-rule-the-earth/) (28 July 2015)*\n\n", "url": "https://aiimpacts.org/index-of-hardware-articles/", "title": "Index of articles about hardware", "source": "aiimpacts.org", "source_type": "wordpress", "date_published": "2015-07-26T17:38:34+00:00", "paged_url": "https://aiimpacts.org/feed?paged=19", "authors": ["Katja Grace"], "id": "c11625eb650f8f44cc937e5585997164", "summary": []} {"text": "Cost of human-level information storage\n\nIt costs roughly $300-$3000 to buy enough storage space to store all information contained by a human brain.\n\n\nSupport\n-------\n\n\nThe human brain probably stores around [10-100TB of data](http://aiimpacts.org/information-storage-in-the-brain/). Data storage costs around $30/TB. Thus it costs roughly $300-$3000 to buy enough storage space to store all information contained by a human brain.\n\n\nIf we suppose that one wants to replace the hardware every five years, this is $0.007-$0.07/hour.[1](https://aiimpacts.org/cost-of-human-level-information-storage/#easy-footnote-bottom-1-592 \"$300 to $3000 / (5 * 365 * 24)\")\n\n\nFor reference, we have estimated that the computing hardware and electricity required to do the computation the brain does would cost around $4,700 – $170,000/hour at present (using an estimate based on [TEPS](http://aiimpacts.org/brain-performance-in-teps/), and assuming computers last for five years). Estimates based on computation rather than communication capabilities (like TEPS) appear to be spread between $3/hour and $1T/hour.[2](https://aiimpacts.org/cost-of-human-level-information-storage/#easy-footnote-bottom-2-592 \"“So it seems human-level hardware presently costs between $3/hour and $1T/hour. ” – our blog post, ‘preliminary prices for human-level hardware’.\") On the TEPS-based estimate then, the cost of replicating the brain’s information storage using existing hardware would currently be between a twenty millionth and a seventy thousandth of the cost of replicating the brain’s computation using existing hardware.\n\n", "url": "https://aiimpacts.org/cost-of-human-level-information-storage/", "title": "Cost of human-level information storage", "source": "aiimpacts.org", "source_type": "wordpress", "date_published": "2015-07-23T20:33:08+00:00", "paged_url": "https://aiimpacts.org/feed?paged=19", "authors": ["Katja Grace"], "id": "75af79001de557c6ed9165a5a471cfbf", "summary": []} {"text": "Costs of information storage\n\n*Posted 23 July 2015*\n\n\nCheap [secondary memory](https://en.wikipedia.org/wiki/Auxiliary_memory) appears to cost around $0.03/GB in 2015. In the long run the price has declined by an order of magnitude roughly every 4.6 years. However the rate has declined so much that prices haven’t substantially dropped since 2011 (in 2015).\n\n\nSupport\n-------\n\n\nCheap [secondary memory](https://en.wikipedia.org/wiki/Auxiliary_memory) appears to cost around $0.03/GB in 2015.[1](https://aiimpacts.org/costs-of-information-storage/#easy-footnote-bottom-1-589 \"John C. McCallum’s dataset includes a point at May 2015 for $0.0000317/MB, which is $0.03/GB. He says ‘In general, these are the lowest priced disk drives for which I could find prices at the time.’ Figure 1 shows a similar price, from a different dataset. We have not assessed how different the datasets are, however they look somewhat different.\")\n\n\nThe price appears to have declined at an average rate of around an order of magnitude every five years in the long run, as illustrated in Figures 1 and 2. Figure 1 shows roughly six and a half orders of magnitude in the thirty years between 1985 and 2015, for around an order of magnitude every 4.6 years. Figure 2 shows thirteen orders of magnitude over the the sixty years between 1955 and 2015, for exactly the same rate. Both figures suggest the rate has been much slower in the past five years, seemingly as part of a longer term flattening. It appears that prices haven’t substantially dropped since 2011 (in 2015).\n\n\n[](http://aiimpacts.org/wp-content/uploads/2015/07/cost-per-gigabyte-large.png)**Figure 1:** Historic prices of hard drive space, from [Matt Komorowski](http://www.mkomo.com/cost-per-gigabyte-update)\n\n\n[](http://aiimpacts.org/wp-content/uploads/2015/07/storage_memory_prices_large-_hblok.net_.png)Figure 2: Historical prices of information storage in various formats, from [Havard Blok](http://hblok.net/blog/storage/), mostly drawing on John C. McCallum’s [data](http://www.jcmit.com/diskprice.htm).\n\n\n\n\n---\n\n", "url": "https://aiimpacts.org/costs-of-information-storage/", "title": "Costs of information storage", "source": "aiimpacts.org", "source_type": "wordpress", "date_published": "2015-07-23T19:55:02+00:00", "paged_url": "https://aiimpacts.org/feed?paged=19", "authors": ["Katja Grace"], "id": "684da1f96d5c7610b706cdde62d4ff28", "summary": []} {"text": "Information storage in the brain\n\n*Last updated 9 November 2020*\n\n\nThe brain probably stores around 10-100TB of data.\n\n\nSupport\n-------\n\n\nAccording to Forrest Wickman, computational neuroscientists generally believe the brain stores 10-100 terabytes of data.[1](https://aiimpacts.org/information-storage-in-the-brain/#easy-footnote-bottom-1-587 \"“…Most computational neuroscientists tend to estimate human storage capacity somewhere between 10 terabytes and 100 terabytes, though the full spectrum of guesses ranges from 1 terabyte to 2.5 petabytes. (One terabyte is equal to about 1,000 gigabytes or about 1 million megabytes; a petabyte is about 1,000 terabytes.)
\nThe math behind these estimates is fairly simple. The human brain contains roughly 100 billion neurons. Each of these neurons seems capable of making around 1,000 connections, representing about 1,000 potential synapses, which largely do the work of data storage. Multiply each of these 100 billion neurons by the approximately 1,000 connections it can make, and you get 100 trillion data points, or about 100 terabytes of information.
\nNeuroscientists are quick to admit that these calculations are very simplistic. First, this math assumes that each synapse stores about 1 byte of information, but this estimate may be too high or too low…”
\n– Wickman 2012\") He suggests that these estimates are produced by assuming that information is largely stored in synapses, and that each synapse stores around 1 byte. The number of bytes is then simply the number of synapses.\n\n\nThese assumptions are simplistic (as he points out). In particular:\n\n\n* synapses may store more or less than one byte of information on average\n* some information may be stored outside of synapses\n* not all synapses appear to store information\n* synapses do not appear to be entirely independent\n\n\n[We estimate](http://aiimpacts.org/scale-of-the-human-brain/) that there are 1.8-3.2 x 10¹⁴ synapses in the human brain, so according to the procedure Wickman outlines, this suggests that the brain stores around 180-320TB of data. It is unclear from his article whether the variation in the views of computational neuroscientists is due to different opinions on the assumptions stated above, or on the number of synapses in the brain. This makes it hard to adjust our estimate well, so our best guess for now is that the brain can store around 10-100TB of data, based on this being the common view among computational neuroscientists.\n\n\n\n\n---\n\n", "url": "https://aiimpacts.org/information-storage-in-the-brain/", "title": "Information storage in the brain", "source": "aiimpacts.org", "source_type": "wordpress", "date_published": "2015-07-23T16:26:18+00:00", "paged_url": "https://aiimpacts.org/feed?paged=19", "authors": ["Katja Grace"], "id": "8f31a0107ed7b7dd0174aeae4114e69c", "summary": []} {"text": "Event: Exercises in Economic Futurism\n\n*By Katja Grace, 15 July 2015*\n\n\nOn Thursday July 30th Robin Hanson is visiting [again](http://aiimpacts.org/event-multipolar-ai-workshop-with-robin-hanson/), and this time we will be holding an informal workshop on how to usefully answer questions about the future, with an emphasis on economic approaches. We will pick roughly three concrete futurism questions, then think about how to go about answering them together. We hope both to make progress on the questions at hand, and to equip attendees with a wider range of tools for effective futurism.\n\n\nTopic suggestions are welcome in the comments, whether or not you hope to come.\n\n\nAfternoon tea will be provided.\n\n\n### Details summary\n\n\n**Date:** 30 July 2015\n\n\n**Location:** Berkeley, near College Ave and Ashby (ask for more detail)\n\n\n**Timetable:**\n\n\n2pm: Afternoon tea and chatting (it is best to show up somewhere in this hour)\n\n\n3pm: Exercises\n\n\n7pm: End (and transition into a party at the same location—attendees welcome to stay on)\n\n\nWe hope to keep the event to around twenty people, so RSVP required. If you would like to come, write to katja@intelligence.org.\n\n\n[](http://aiimpacts.org/wp-content/uploads/2015/07/Sortie_de_lopéra_en_lan_2000-2.jpg)\n\n\nImage: [La Sortie de l’opéra en l’an 2000](https://en.wikipedia.org/wiki/File:Sortie_de_l%27op%C3%A9ra_en_l%27an_2000-2.jpg)\n\n", "url": "https://aiimpacts.org/event-exercises-in-economic-futurism/", "title": "Event: Exercises in Economic Futurism", "source": "aiimpacts.org", "source_type": "wordpress", "date_published": "2015-07-15T19:27:03+00:00", "paged_url": "https://aiimpacts.org/feed?paged=19", "authors": ["Katja Grace"], "id": "75ad9b2b3170dec844c235a9c12e85e7", "summary": []} {"text": "Steve Potter on neuroscience and AI\n\n*By Katja Grace, 13 July 2015*\n\n\n[](http://aiimpacts.org/wp-content/uploads/2015/07/Dr.-Potter.jpg)Dr Steve Potter\n[Prof. Steve Potter](https://neurolab.gatech.edu/labs/potter/steve-potter) works at the [Laboratory of Neuroengineering](https://neurolab.gatech.edu/) in Atlanta, Georgia. I wrote to him after coming across his old article, [‘What can AI get from Neuroscience?’](http://www.neurolab.gatech.edu/wp/wp-content/uploads/potter/publications/Potter-NeuroscienceForAIchapter.pdf) I wanted to know how neuroscience might contribute to AI in the future: for instance will ‘[reverse engineering the brain](http://aiimpacts.org/kurzweil-the-singularity-is-near/)‘ be a substantial contributor of software for general AI? To shed light on this, I talked to Prof. Potter about how neuroscience has helped AI in the past, how the fields interact now, and what he expects in the future. Summary notes on the conversation are [here](http://aiimpacts.org/conversation-with-steve-potter/).\n\n", "url": "https://aiimpacts.org/steve-potter-on-neuroscience-and-ai/", "title": "Steve Potter on neuroscience and AI", "source": "aiimpacts.org", "source_type": "wordpress", "date_published": "2015-07-14T01:50:37+00:00", "paged_url": "https://aiimpacts.org/feed?paged=20", "authors": ["Katja Grace"], "id": "1e48507b490e6f5c86201f64835f0dfc", "summary": []} {"text": "Conversation with Steve Potter\n\n*Posted 13 July 2015*\n\n\n### Participants\n\n\n[](http://aiimpacts.org/wp-content/uploads/2015/07/SteveholdingMEA.jpg)**Figure 1:** Professor Steve Potter\n\n\n* **[Professor Steve Potter](https://neurolab.gatech.edu/labs/potter/steve-potter)** – Associate Professor, Laboratory of NeuroEngineering, Coulter Department of Biomedical Engineering, Georgia Institute of Technology\n* **[Katja Grace](http://katjagrace.com)** – Machine Intelligence Research Institute (MIRI)\n\n\n**Note**: These notes were compiled by MIRI and give an overview of the major points made by Professor Steve Potter.\n\n\n### Summary\n\n\nKatja Grace spoke with Professor Steve Potter of Georgia Institute of Technology as part of AI Impacts’ investigation into the implications of neuroscience for artificial intelligence (AI). Conversation topics included how neuroscience now contributes to AI and how it might contribute in the future.\n\n\nHow has neuroscience helped AI in the past?\n-------------------------------------------\n\n\nProfessor Potter found it difficult to think of examples where neuroscience has helped with higher level ideas in AI. Some elements of cognitive science have been implemented in AI, but these may not be biologically based. He described two broad instances of neuroscience-inspired projects.\n\n\n### Subsumption architecture\n\n\nPast work in AI has focused on disembodied computers with little work in robotics. Researchers now understand that AI does not need to be centralized; it can also take on physical form. Subsumption architecture is one way that robotics has advanced. This involves the coupling of sensory information to action selection. For example, Professor Rodney Brooks at MIT has developed robotic legs that respond to certain sensory signals. These legs also send messages to one another to control their movement. Professor Potter believes that this work could have been based on neuroscience, but it is not clear how much Professor Brooks was inspired by neuroscience while working on this project; the idea may have come to him independently.\n\n\n### Neuromorphic engineering\n\n\nThis type of engineering employs properties of biological nervous systems in neural system AI, such as perception and motor control. One aspect of brain function can be imitated with silicon chips through pulse-coding, where analog signals are sent and received in tiny pulses. An application for this is in camera development by mimicking pulse-coded signals between the brain and the retina.\n\n\nHow is neuroscience contributing to AI today?\n---------------------------------------------\n\n\nAlthough neuroscience has not assisted AI development much in the past, Professor Potter has confidence that this intersection has considerable potential. This is because the brain works well in areas where AI falls short. For example, AI needs to improve how it works in real time in the real world. Self-driving cars may be improved through examining how a model organism, such as a bee, would respond to an analogous situation. Professor Potter believes it would be worthwhile research to record how humans use their brains while driving. Brain algorithms developed from this could be implemented into car design.\n\n\nCurrent work at the intersection of neuroscience and AI include the following:\n\n\n**Artificial neural networks**\n\n\nMost researchers at the intersection of AI and neuroscience are examining artificial neural networks, and might describe their work as ‘neural simulations’. These networks are a family of statistical learning models that are inspired by biological neural networks. Hardware in this discipline includes neuromorphic chips, while software includes work in pattern recognition. This includes handwriting recognition and finding military tanks in aerial photographs. The translation of these networks into useful products for both hardware and software applications has been slow.\n\n\n**Hybrots**\n\n\nProfessor Potter has helped develop hybrots, which are hybrid living tissue interfaced with robotic machines: robots controlled by neurons. Silent Barrage was an early hybrot that drew on paper attached to pillars. Video was taken of people viewing the Silent Barrage hybrots. This data was transmitted back to Prof. Potter’s lab, where it was used to trigger electrical stimulation in the living brain of the system. This was a petri dish interfaced to a culture of rat cortical neurons. This work is currently being expanded to include more types of hybrots. In one the control will be by living neurons, while the other will be controlled by a simulated neural network.\n\n\nMeart (MultiElectrode Array Art) was an earlier hybrot. Controlled by a brain composed of rat neuron cells, it used robotic arms to draw on paper. It never progressed past the toddler stage of scribbling.\n\n\nHow is neuroscience likely to help AI in the future?\n----------------------------------------------------\n\n\nA particular line of research in neuroscience that is likely to help with AI is the concept of delays. Computer design is often optimized to reduce the amount of time between command and execution. The brain though may take milliseconds longer to respond. However delays in the brain were evolved to respond to the timing of the real world and are a useful part of the brain’s learning process.\n\n\nNeuroscience probably also has potential to help AI in searching databases. It appears that the brain has methods for this that are completely unlike those used in computers, though we do not yet know what the brain’s methods are. One example given of the brain’s impressive abilities here is that Professor Potter can meet a new person and instantly be confident that he has never seen that person before.\n\n\nHow long will it take to duplicate human intelligence?\n------------------------------------------------------\n\n\nIt will be hard to say when this has been achieved; success is happening at different rates for different applications. The future of neuroscience in AI will most likely involve taking elements of neuroscience and applying them to AI; it is unlikely that there will be a wait until we have a good understanding of the brain, then an export of that knowledge complete to AI.\n\n\nProfessor Potter greatly respects Ray Kurzweil, but does not think that he has an in depth knowledge of neuroscience. Professor Potter thinks the brain is much more complex than Kurzweil appears to believe, and that ‘duplicating’ human intelligence will take far longer than Kurzweil predicts. In Professor Potter’s consideration, it will take over a hundred years to develop a robot butler that can convince you that it is human.\n\n\n### **Challenges to progress**\n\n\n#### Lack of collaboration\n\n\nNeuroscience-inspired AI progress has been hampered because researchers across neuroscience and AI seldom collaborate with one another. This may be from disinterest or limited understanding of each other’s fields. Neuroscientists are not generally interested in the goal of creating human-level artificial intelligence. Professor Potter believes that of the roughly 30,000 people who attend the Society for Neuroscience, approximately 20 people want this. Most neuroscientists, for example, want to learn how something works instead of learning how it can be applied (e.g. learning how the auditory system works instead of developing a new hearing aid). If more people saw benefits in applying neuroscience to AI and in particular human-level AI, there would be greater progress. However, the scale is hard to predict. There is the potential for very much more rapid progress. For researchers to move their projects in this direction, the priorities of funding agencies would first have to move; these as these effectively dictate which projects move forward.\n\n\n#### Funding\n\n\nFunding for work at the intersection of neuroscience and AI may be hard to find. The National Institute of Health (NIH) funds only health-related work and has not funded AI projects. The National Science Foundation (NSF) may not think the work fits its requirement of being basic science research; it may be too applied. NSF though, is more open-minded to funding research on AI than NIH is. The military is also interested in AI research. Outside (of )the U.S., the European Union (EU) funds cross-disciplinary work in neuroscience and AI.\n\n\n##### National Science Foundation (NSF) funding\n\n\nNSF had a call for radical proposals, from which Professor Potter received a four-year-long grant to apply neuroscience to electrical grid systems. Collaborators included a power engineer and people studying neural networks. The group was interested in addressing the U.S.’s large and uneven power supply and usage. The electrical grid has become increasingly difficult to control because of geographically varying differences in input and output.\n\n\nProfessor Potter believes that if people in neuroscience, AI, neural networks, and computer design talked more, this would bring progress. However, there were some challenges with this collaborative electrical grid systems project that need to be addressed. For example, the researchers needed to spend considerable time educating one another about their respective fields. It was also difficult to communicate with collaborators across the country; NSF paid for only one meeting per year, and the nuances of in-person interaction seem important for bringing together such diverse groups of people and reaping the benefits of their creative communication.\n\n\nOther people working in this field\n----------------------------------\n\n\n* **Henry Markram** – Professor, École Polytechnique Fédérale de Lausanne, Laboratory of Neural Microcircuitry. Using EU funding, he creates realistic computer models of the brain, one piece at a time.\n* **Rodney Douglas** – Professor Emeritus, University of Zurich, Institute of Neuroinformatics. He is a neuromorphic engineer who worked on emulated brain function.\n* **Carver Mead –** Gordon and Betty Moore Professor of Engineering and Applied Science Emeritus, California Institute of Technology. He was a founding father of neuromorphic engineering.\n* **Rodney Brooks** – Panasonic Professor of Robotics Emeritus, Massachusetts Institute of Technology (MIT). He was a pioneer in studying distributed intelligence and developed subsumption architecture.\n* **Andy Clark** – Professor of Logic and Metaphysics, University of Edinburgh. He does work on embodiment, artificial intelligence, and philosophy.\n* **Jose Carmena** – Associate Professor of Electrical Engineering and Neuroscience, University of California-Berkeley. Co-Director of the Center of Neural Engineering and Prostheses, University of California-Berkeley, University of California-San Francisco. He has researched the impact of electrical stimulation on sensorimotor learning and control in rats.\n* **Guy Ben-Ary** – Manager, University of Western Australia, CELLCentral in the School of Anatomy and Human Biology. He is an artist and researcher who uses biologically related technology in his work. He worked in collaboration with Professor Potter on Silent Barrage.\n* **Wolfgang Maass** – Professor of Computer Science, Graz University of Technology. He is doing research on artificial neural networks.\n* **Thad Starner** – Assistant Professor, Georgia Institute of Technology, College of Computing. He applies biological concepts into developing wearable computing devices.\n* **Jennifer Hasler** – Professor, Georgia Institute of Technology, Bioengineering and Electronic Design and Applications. She has studied neuromorphic hardware.\n", "url": "https://aiimpacts.org/conversation-with-steve-potter/", "title": "Conversation with Steve Potter", "source": "aiimpacts.org", "source_type": "wordpress", "date_published": "2015-07-14T01:49:36+00:00", "paged_url": "https://aiimpacts.org/feed?paged=20", "authors": ["Katja Grace"], "id": "23b8bfd8ed679a43cb0722ab708ddb10", "summary": []} {"text": "New funding for AI Impacts\n\n*By Katja Grace, 4 July 2015*\n\n\nAI Impacts has received two grants! We are grateful to the [Future of Humanity Institute](http://fhi.ox.ac.uk) (FHI) for $8,700 to support work on the project until September 2015, and the [Future of Life Institute](http://futureoflife.org) (FLI) for $49,310 for another year of work after that. Together this is enough to have a part time researcher until September 2016, plus a little extra for things like workshops and running the website.\n\n\nWe are big fans of FHI and FLI, and are excited to be working alongside them.\n\n\nThe FLI grant was part of the [recent contest](http://futureoflife.org/misc/2015selection) which distributed around $7M funding from Elon Musk and the [Open Philanthropy Project](http://www.openphilanthropy.org/) to projects designed to keep AI robust and beneficial. The full list of projects to be funded is [here](http://futureoflife.org/misc/2015awardees). You can see part of our proposal [here](http://aiimpacts.org/wp-content/uploads/2015/07/AI-Impacts-narrative-for-FLI-grant.pdf).\n\n\nThis funding means that AI Impacts is no longer in urgent [need of support](http://aiimpacts.org/supporting-ai-impacts/). Further [donations](http://aiimpacts.org/donate/) will likely go to additional research through contract work, guest research, short term collaborations, and outsourceable data collection.\n\n\nMany thanks to those whose support—in the form of both funding and other feedback—has brought AI Impacts this far.\n\n", "url": "https://aiimpacts.org/new-funding-for-ai-impacts/", "title": "New funding for AI Impacts", "source": "aiimpacts.org", "source_type": "wordpress", "date_published": "2015-07-04T22:25:54+00:00", "paged_url": "https://aiimpacts.org/feed?paged=20", "authors": ["Katja Grace"], "id": "12b839bfb2709866c0a653bd4f7ae73d", "summary": []} {"text": "Update on all the AI predictions\n\n*By Katja Grace, 5 June 2015*\n\n\nFor the last little while, we’ve been looking into [a dataset of individual AI predictions](http://aiimpacts.org/miri-ai-predictions-dataset/), collected by MIRI a couple of years ago. We also previously gathered all the [surveys](http://aiimpacts.org/ai-timeline-surveys/) about AI predictions that we could find. Together, these are all the public predictions of AI that we know of. So we just wrote up [a quick summary](http://aiimpacts.org/predictions-of-human-level-ai-timelines/) of what we have so far.\n\n\nHere’s a picture of most of the predictions, from our summary:\n\n\n[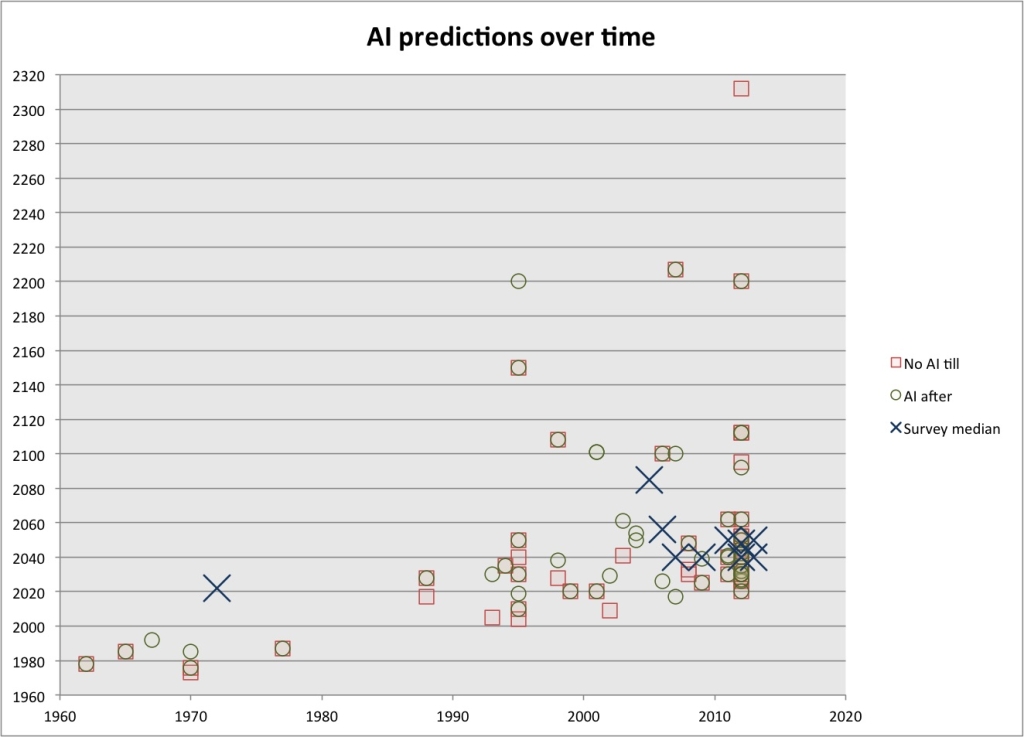](http://aiimpacts.org/wp-content/uploads/2014/12/AI-predictions-summary-3.jpg)**Figure 1:** Predictions from the [MIRI dataset](http://aiimpacts.org/miri-ai-predictions-dataset/) (red = [maxIY](http://aiimpacts.org/miri-ai-predictions-dataset/) ≈ ‘AI more likely than not after …’, and green = [minPY](http://aiimpacts.org/miri-ai-predictions-dataset/) ≈ ‘AI less likely than not before …’) and [surveys](http://aiimpacts.org/ai-timeline-surveys/). This figure excludes one prediction of 3012 made in 2012, and the [Hanson survey](http://aiimpacts.org/hanson-ai-expert-survey/), which doesn’t ask directly about prediction dates.\nRecent [surveys](http://aiimpacts.org/ai-timeline-surveys/) seem to pretty reliably predict AI between 2040 and 2050, as you can see. The [earlier](http://aiimpacts.org/michie-survey/) [surveys](http://aiimpacts.org/bainbridge-survey/) [which](http://aiimpacts.org/klein-agi-survey/) [don’t](http://aiimpacts.org/ai50-survey/) fit this trend also had less uniform questions, whereas the last six surveys ask about the year in which there is a 50% chance that (something like) human-level AI will exist. The entire set of individual predictions has a median somewhere in the 2030s, depending on how you count. However for predictions made since 2000, the median is 2042 ([minPY](http://aiimpacts.org/miri-ai-predictions-dataset/)), in line with the surveys. [The surveys that ask](http://aiimpacts.org/ai-timeline-surveys/) also consistently get median dates for a 10% chance of AI in the 2020s.\n\n\nThis consistency seems interesting, and these dates seem fairly soon. If we took these estimates seriously, and people really meant at least ‘AI that could replace most humans in their jobs’, the predictions of ordinary AI researchers seem pretty concerning. 2040 is not far off, and the 2020s seem too close for us to be prepared to deal with moderate chances of AI, at the current pace.\n\n\nWe are not sure what to make of these predictions. Predictions about AI are frequently distrusted, though often alongside complaints that seem weak to us. For instance that [people are biased to predict AI twenty years in the future](https://intelligence.org/files/PredictingAI.pdf), or [just before their own deaths](http://aiimpacts.org/the-maes-garreau-law/); that [AI researchers have always been very optimistic and continually proven wrong](http://aiimpacts.org/michie-and-overoptimism/); [that experts and novices make the same predictions](https://intelligence.org/files/PredictingAI.pdf) (**Edit (6/28/2016):** now found to be [based on an error](http://aiimpacts.org/error-in-armstrong-and-sotala-2012/)); or that [failed predictions of the past look like current predictions](http://aiimpacts.org/similarity-between-historical-and-contemporary-ai-predictions/). There really do seem to be selection biases, from [people who are optimistic about AGI](http://aiimpacts.org/group-differences-in-ai-predictions/) [working in the field](http://aiimpacts.org/why-do-agi-researchers-expect-ai-so-soon/) [for instance](http://aiimpacts.org/bias-from-optimistic-predictors/), and from [shorter predictions being more published](http://aiimpacts.org/short-prediction-publication-biases/). However there are ways to avoid these.\n\n\nThere seem to be a few good [reasons to distrust these predictions](http://aiimpacts.org/accuracy-of-ai-predictions/) however. First, it’s not clear that people can predict these kinds of events well in any field, at least without the help of tools. Relatedly, it’s not clear what tools and other resources people used in the creation of these predictions. Did they model the situation carefully, or just report their gut reactions? My guess is near the ‘gut reaction’ end of the spectrum, based on [looking for reasoning](http://aiimpacts.org/list-of-analyses-of-time-to-human-level-ai/) and finding only a little. Often gut reactions are reliable, but I don’t expect them to be so, on their own, in an area such as forecasting novel and revolutionary technologies.\n\n\nThirdly, phrases like, ‘human-level AI arrives’ appear to stand for [different events](http://aiimpacts.org/human-level-ai/) for different people. Sometimes people are talking about almost perfect human replicas, sometimes software entities that can undercut a human at work without resembling them much at all, sometimes human-like thinking styles which are far from being able to replace us. Sometimes they are talking about human-level abilities at human cost, sometimes at any cost. Sometimes consciousness is required, sometimes poetry is, sometimes calculating ability suffices. Our impressions from talking to people are that ‘AI predictions’ mean a wide variety of things. So the collection of predictions is probably about different events, which we might reasonably expect to happen at fairly different times. Before trusting experts here, it seems key to check we know what they are talking about.\n\n\nGiven all of these things, I don’t trust these predictions a huge amount. However I expect they are somewhat informative, and there are not a lot of good sources to trust at present.\n\n\nThe next things I’d like to know in this area:\n\n\n* What do experts actually believe about human-level AI timelines, if you check fairly thoroughly that they are talking about what you think they are talking about, and aren’t making obviously different assumptions about other matters?\n* How reliable are similar predictions? For instance, predictions of novel technologies, predictions of economic upheaval, predictions of disaster?\n* [Why do](http://aiimpacts.org/are-ai-surveys-seeing-the-inside-view/) the results of the [Hanson survey](http://aiimpacts.org/hanson-ai-expert-survey/) conflict with the other surveys?\n* How do people make the predictions they make? (e.g. How often are they thinking of hardware trends? Using intuition? Following the consensus of others?)\n* [Why](http://aiimpacts.org/why-do-agi-researchers-expect-ai-so-soon/) are AGI researchers so much more optimistic than AI researchers, and are AI researchers [so much more optimistic](http://aiimpacts.org/group-differences-in-ai-predictions/) than others?\n* What disagreements between AI researchers produce their different predictions?\n* What do AI researchers know that informs their predictions that people outside the field (like me) do not know? (What do they know that doesn’t inform their predictions, but should?)\n\n\nHopefully we’ll be looking more into some of these things soon.\n\n\n \n\n", "url": "https://aiimpacts.org/update-on-all-the-ai-predictions/", "title": "Update on all the AI predictions", "source": "aiimpacts.org", "source_type": "wordpress", "date_published": "2015-06-06T05:27:59+00:00", "paged_url": "https://aiimpacts.org/feed?paged=20", "authors": ["Katja Grace"], "id": "8b3d2d17617fac4249f05f21bc21fbac", "summary": []} {"text": "Predictions of Human-Level AI Timelines\n\n***Note: This page is out of date. See an [up-to-date version of this page](https://wiki.aiimpacts.org/doku.php?id=ai_timelines:predictions_of_human-level_ai_timelines) on our wiki.** \n\nUpdated 5 June 2015*\n\n\nWe know of around 1,300 public predictions of when human-level AI will arrive, of varying levels of quality. These include predictions from individual statements and larger surveys. Median predictions tend to be between 2030 and 2055 for predictions made since 2000, across different subgroups of predictors.\n\n\nDetails\n-------\n\n\n### The landscape of AI predictions\n\n\nPredictions of when [human-level AI](http://aiimpacts.org/human-level-ai/) will be achieved exist in the form of [surveys](http://aiimpacts.org/ai-timeline-surveys/) and public statements (e.g. in articles, books or interviews). Some statements backed by analysis are discussed [here](http://aiimpacts.org/list-of-analyses-of-time-to-human-level-ai/). Many more statements have been [collected](http://aiimpacts.org/miri-ai-predictions-dataset/) by [MIRI](http://intelligence.org/). Figure 1 illustrates almost all of the predictions we know about, though most are aggregated there into survey medians. Altogether, we know of around 1,300 public predictions of when human-level AI will arrive, though 888 are from a single informal online poll. We know of ten surveys that address this question directly (plus [a set of interviews](http://aiimpacts.org/kruel-ai-survey/) which we sometimes treat as a survey but here count here as individual statements, and [a survey](http://aiimpacts.org/hanson-ai-expert-survey/) which asks about progress so far as a fraction of what is required for human-level AI). Only 65 predictions that we know of are not part of surveys.\n\n\n### Summary of findings\n\n\n[](http://aiimpacts.org/wp-content/uploads/2014/12/AI-predictions-summary-3.jpg)**Figure 1:** Predictions from the [MIRI dataset](http://aiimpacts.org/miri-ai-predictions-dataset/) (red = [maxIY](http://aiimpacts.org/miri-ai-predictions-dataset/) ≈ ‘AI more likely than not after …’, and green = [minPY](http://aiimpacts.org/miri-ai-predictions-dataset/) ≈ ‘AI less likely than not before …’) and [surveys](http://aiimpacts.org/ai-timeline-surveys/). This figure excludes one prediction of 3012 made in 2012, and the [Hanson survey](http://aiimpacts.org/hanson-ai-expert-survey/), which doesn’t ask directly about prediction dates.\n\n\nRecent [surveys](http://aiimpacts.org/ai-timeline-surveys/) tend to have median dates between 2040 and 2050. All six of the surveys which ask for the year in which human-level AI will have arrived with 50% probability produce medians in this range (not including [Kruel’s interviews](http://aiimpacts.org/kruel-ai-survey/), which have a median of 2035, and are counted in the statements here). The median prediction in [statements](http://aiimpacts.org/miri-ai-predictions-dataset/) is 2042, though predictions of AGI researchers and futurists have medians in the early 2030s. [Surveys](http://aiimpacts.org/ai-timeline-surveys/) give median estimates for a 10% chance of human-level AI in the 2020s. We have not attempted to adjust these figures for [biases](http://aiimpacts.org/accuracy-of-ai-predictions/).\n\n\n### Implications\n\n\nExpert predictions about AI timelines are often considered uninformative. Evidence that predictions are less informative than in other messy fields [appears](http://aiimpacts.org/accuracy-of-ai-predictions/) to be weak. We have not evaluated baseline prediction accuracy in such fields however. We expect survey results and predictions from those further from AGI are more accurate than other sources, due to [selection biases](http://aiimpacts.org/accuracy-of-ai-predictions/). The differences between these sources appear to be a small number of decades.\n\n", "url": "https://aiimpacts.org/predictions-of-human-level-ai-timelines/", "title": "Predictions of Human-Level AI Timelines", "source": "aiimpacts.org", "source_type": "wordpress", "date_published": "2015-06-05T15:36:50+00:00", "paged_url": "https://aiimpacts.org/feed?paged=20", "authors": ["Katja Grace"], "id": "5f7ba9c7818cbf4cee083c8b7af09f3c", "summary": []} {"text": "Accuracy of AI Predictions\n\n*Updated 4 June 2015*\n\n\nIt is unclear how informative we should expect expert predictions about AI timelines to be. Individual predictions are undoubtedly often off by many decades, since they disagree with each other. However their aggregate may still be quite informative. The main potential reason we know of to doubt the accuracy of expert predictions is that experts are generally poor predictors in many areas, and AI looks likely to be one of them. However we have not investigated how accurate ‘poor’ is, or whether AI really is such a case.\n\n\nPredictions of AI timelines are likely to be biased toward optimism by roughly decades, especially if they are [voluntary statements](http://aiimpacts.org/bias-from-optimistic-predictors/) rather than surveys, and especially if they are [from populations selected for optimism](http://aiimpacts.org/group-differences-in-ai-predictions/). We expect these factors account for less than a decade and around two decades’ difference in median predictions respectively.\n\n\nSupport\n-------\n\n\n### Considerations regarding accuracy\n\n\nA number of reasons have been suggested for distrusting predictions about AI timelines:\n\n\n* **Models of areas where people predict well**Research has produced a characterization of situations where experts predict well and where they do not. See table 1 [here](http://intelligence.org/files/PredictingAI.pdf). AI appears to fall into several classes that go with worse predictions. However we have not investigated this evidence in depth, or the extent to which these factors purportedly influence prediction quality.\n* **Expert predictions are generally poor**Experts are notoriously poor predictors. However our impression is that this is because of their disappointing inability to predict some things well, rather than across the board failure. For instance, experts can predict the Higgs boson’s existence, outcomes of chemical reactions, and astronomical phenomena. So the question falls back to where AI falls in the spectrum of expert predictability, discussed in the last point.\n* **Disparate predictions**One sign that AI predictions are not very accurate is that they differ over a range of a century or so. This strongly suggests that many individual predictions are inaccurate, though not that the aggregate distribution is uninformative.\n* **[Similarity of old and new predictions](http://aiimpacts.org/similarity-between-historical-and-contemporary-ai-predictions/)**Older predictions seem to form a fairly similar distribution to more recent predictions, except for very old predictions. This is weak evidence that new predictions are not strongly affected by evidence, and are therefore more likely to be inaccurate.\n* **Similarity of expert and lay opinions**[Armstrong and Sotala](https://intelligence.org/files/PredictingAI.pdf) found that expert and non-expert predictions look very similar.[1](https://aiimpacts.org/accuracy-of-ai-predictions/#easy-footnote-bottom-1-166 \"‘Using a database of 95 AI timeline predictions, it will show that these expectations are borne out in practice: expert predictions contradict each other considerably, and are indistinguishable from non-expert predictions and past failed predictions.’ – Armstrong and Sotala 2012, p1\") This finding is in doubt at the time of writing, due to errors in the analysis. If it were true, this would be weak evidence against experts having relevant expertise, since if they did, this might cause a difference with the opinions of lay-people. Note that it may also not, if the laypeople go to experts for information.\n* **Predictions are about different things and often misinterpreted**Comments made around predictions of human-level AI suggest that predictors are sometimes thinking about different events as ‘AI arriving’.[2](https://aiimpacts.org/accuracy-of-ai-predictions/#easy-footnote-bottom-2-166 \"For instance, in an interview with Alexander Kruel, Pei Wang says ‘Here by “roughly as good as humans” I mean the AI will follow roughly the same principles as human in information processing, though it does not mean that the system will have the same behavior or capability as human, due to the difference in body, experience, motivation, etc.’Nils Nilson interprets the question differently: ‘Because human intelligence is so multi-faceted, your question really should be divided into each of the many components of intelligence…A while back I wrote an essay about a replacement for the Turing test. It was called the “Employment Test.” (See: http://ai.stanford.edu/~nilsson/OnlinePubs-Nils/General_Essays/AIMag26-04-HLAI.pdf) How many of the many, many jobs that humans do can be done by machines? I’ll rephrase your question to be: When will AI be able to perform around 80% of these jobs as well or better than humans perform?These researchers were asked for their predictions in a context conducive to elaboration. Had they been surveyed more briefly (as in most surveys), or chosen not to elaborate, at least one would have been misunderstood. It is an open question whether 80% of jobs being automated will roughly coincide with artificial minds using similar information processing principles to humans.\") Even when they are predictions about the same event, ‘prediction’ can mean different things. One person might ‘predict’ the year when they think human-level AI is more likely than not, while another ‘predicts’ the year that AI seems almost certain.\n\n\nThis list is not necessarily complete.\n\n\n### Purported biases\n\n\nA number of biases have been posited to affect predictions of human-level AI:\n\n\n* **[Selection biases from optimistic experts](http://aiimpacts.org/bias-from-optimistic-predictors/)** \n\nBecoming an expert is probably correlated with independent optimism about the field, and experts make most of the credible predictions. We expect this to push median estimates earlier by less than a few decades.\n* **[Biases from short-term predictions being recorded](http://aiimpacts.org/short-prediction-publication-biases/)**There are a few reasons to expect recorded public predictions to be biased toward shorter timescales. Overall these probably make public statements less than a decade more optimistic.\n* **[Maes-Garreau law](http://aiimpacts.org/the-maes-garreau-law/)**The Maes-Garreau law is a posited tendency for people to predict important technologies not long before their own likely death. It probably doesn’t afflict predictions of human-level AI substantially.\n* **Fixed period bias** \n\nThere is a stereotype that people tend to predict AI in 20-30 years. There is weak evidence of such a tendency around 20 years, though little evidence that this is due to a bias (that we know of).\n\n\n### Conclusions\n\n\nAI appears to exhibit several qualities characteristic of areas that people are not good at predicting. Individual AI predictions appear to be inaccurate by many decades in virtue of their disagreement. Other grounds for particularly distrusting AI predictions seem to offer weak evidence against them, if any. Our current guess is that AI predictions are less reliable than many kinds of prediction, though still potentially fairly informative.\n\n\nBiases toward early estimates appear to exist, as a result of optimistic people becoming experts, and optimistic predictions being more likely to be published for various reasons. These are the only plausible substantial biases we know of.\n\n", "url": "https://aiimpacts.org/accuracy-of-ai-predictions/", "title": "Accuracy of AI Predictions", "source": "aiimpacts.org", "source_type": "wordpress", "date_published": "2015-06-04T08:47:48+00:00", "paged_url": "https://aiimpacts.org/feed?paged=20", "authors": ["Katja Grace"], "id": "c1db476b63bbd0d4a97aeb4f4d6f8b2c", "summary": []} {"text": "Publication biases toward shorter predictions\n\nWe expect predictions that [human-level AI](http://aiimpacts.org/human-level-ai/ \"Human-Level AI\") will come sooner to be recorded publicly more often, for a few reasons. Public statements are probably more optimistic than surveys because of such effects. The difference appears to be less than a decade, for median predictions.\n\n\nSupport\n-------\n\n\n### Plausible biases\n\n\nBelow we outline five reasons for expecting earlier predictions to be stated and publicized more than later ones. We do not know of compelling reasons to expect longer term predictions to be publicized more, unless they are so distant as to also fit under the first bias discussed below.\n\n\n#### Bias from not stating the obvious\n\n\nIn many circumstances, people are disproportionately likely to state beliefs that they think others do not hold. For example, [“homeopathy works”](https://www.google.com/webhp?sourceid=chrome-instant&ion=1&espv=2&ie=UTF-8#q=%22homeopathy+works%22) gets more Google hits than [“homeopathy doesn’t work”](https://www.google.com/webhp?sourceid=chrome-instant&ion=1&espv=2&ie=UTF-8#q=%22homeopathy+doesn%27t+work%22), though this probably doesn’t reflect popular beliefs on the matter. Making public predictions seems likely to be a circumstance with this character. Predictions are often made in books and articles which are intended to be interesting and surprising, rather than by people whose job it is to report on AI forecasts regardless of how far away they are. Thus we expect people with unusual positions on AI timelines to be more likely to state them. This should produce a bias toward both very short and very long predictions being published.\n\n\n#### Bias from the near future being more concerning\n\n\nArtificial intelligence will arguably be hugely important, whether as a positive or negative influence on the world. Consequently, people are motivated to talk about its social implications. The degree of concern motivated by impending events tends to increase sharply with proximity to the event. Thus people who expect human-level AI in a decade will tend to be more concerned about it than people who expect human-level AI to take a century, and so will talk about it more. Similarly, publishers are probably more interested in producing books and articles making more concerning claims.\n\n\n#### Bias from ignoring reverse predictions\n\n\nIf you search for people predicting AI by a given date, you can get downwardly biased estimates by taking predictions from sources where people are asked about certain specific dates, and respond that AI will or will not have arrived by that date. If people respond ‘AI will arrive by X’ and ‘AI will not arrive by X’ as appropriate, the former can look like ‘predictions’ while the latter do not.\n\n\nThis bias affected some data in the [MIRI dataset](https://sites.google.com/site/aiimpactslibrary/ai-timelines/predictions-of-human-level-ai-dates/miri-ai-predictions-dataset), though we have tried to minimize it now. For example, [this bet](http://longbets.org/1/) (“By 2029 no computer – or “machine intelligence” – will have passed the Turing Test.”) is interpreted in the above collection as Kurzweil making a prediction, but not as Kapor making a prediction. It also contained several estimates of 70 years, taken from a group who appear to have been asked whether AI would come within 70 years, much later, or never. The ‘within 70 years’ estimates are recorded as predictions, while the others ignored, producing ’70 years’ estimates, almost regardless of the overall opinions of the group surveyed. In a population of people with a range of beliefs, this method of recording predictions would produce ‘predictions’ largely determined by which year was asked about.\n\n\n#### Bias from unavoidably ignoring reverse predictions\n\n\nThe aforementioned bias arises from an error that can be avoided in recording data, where predictions and reverse predictions are available. However similar types of bias may exist more subtly. Such bias could arise where people informally volunteer opinions in a discussion about some period in the future. People with shorter estimates who can make a positive statement might feel more as though they have something to say, while those who believe there will not be AI at that time do not. For instance, suppose ten people write books about the year 2050, and each predicts AI in a different decade in the 21st Century. Those who predict it prior to 2050 will mention it, and be registered as a prediction of before 2050. Those who predict it after 2050 will not mention it, and not be registered as making a prediction. This could also be hard to avoid if predictions reach you through a filter of others registering them as predictions.\n\n\n#### Selection bias from optimistic experts\n\n\n*Main article: **[Selection bias from optimistic experts](http://aiimpacts.org/bias-from-optimistic-predictors/)***\n\n\nSome factors that cause people to make predictions about AI are likely to correlate with expectations of human-level AI arriving sooner. Experts are better positioned to make credible predictions about their field of expertise than more distant observers are. However since people are more likely to join a field if they are more optimistic about progress there, we might expect their testimony to be biased toward optimism.\n\n\n### Measuring these biases\n\n\nThese forms of bias (except the last) seem to us as if they should be much weaker in survey data than voluntary statements, for the following reasons:\n\n\n* Surveys come with a default of answering questions, so one does not need a strong reason or social justification for doing so (e.g. having a surprising claim, or wanting to elicit concern).\n* One can assess whether a survey ignores reverse predictions, and there appears to be little risk of invisible reverse predictions.\n* Participation in surveys is mostly determined before the questions are viewed, for a large number of questions at once. This allows less opportunity for views on the question to affect participation.\n* Participation in surveys is relatively cheap, so people who care little about expressing any particular view are likely to participate for reasons of orthogonal incentives, whereas costly communications (such as writing a book) are likely to be sensible only for those with a strong interest in promoting a specific message.\n* Participation in surveys is usually anonymous, so relatively unsatisfactory for people who particularly want to associate with a specific view, further aligning the incentives of those who want to communicate with those who don’t care.\n* Much larger fractions of people participate in surveys when requested than volunteer predictions in highly publicized arenas, which lessens the possibility for selection bias.\n\n\nWe think publication biases such as those described here are reasonably likely on theoretical grounds. We are also not aware of other reasons to expect surveys and statements to differ in their optimism about AI timelines. Thus we can compare the predictions of statements and surveys to estimate the size of these biases. Survey data [appears to](http://aiimpacts.org/miri-ai-predictions-dataset/) produce median predictions of human-level AI somewhat later than similar public statements do: less than a decade, at a very rough estimate. Thus we think some combination of these biases probably exist, and introduce less than a decade of error to median estimates.\n\n\nImplications\n------------\n\n\n**[Accuracy of AI predictions](https://sites.google.com/site/aiimpactslibrary/ai-timelines/predictions-of-human-level-ai-dates/interpretation-of-ai-predictions/accuracy-of-ai-predictions):** AI predictions made in statements are probably biased toward being early, by less than a decade. This suggests both that predictions overall are probably slightly earlier than they would be otherwise, and surveys should be trusted more relative to statements (though there may be other considerations there). \n\n**Collecting data**: When collecting data about AI predictions, it is important to avoid introducing bias by recording opinions that AI is before some date while ignoring opinions that it is after that date. \n\n**[MIRI dataset](https://sites.google.com/site/aiimpactslibrary/ai-timelines/predictions-of-human-level-ai-dates/miri-ai-predictions-dataset)**: The earlier version of the MIRI dataset is somewhat biased due to ignoring reverse predictions, however this has been at least partially resolved.\n\n", "url": "https://aiimpacts.org/short-prediction-publication-biases/", "title": "Publication biases toward shorter predictions", "source": "aiimpacts.org", "source_type": "wordpress", "date_published": "2015-05-29T21:46:50+00:00", "paged_url": "https://aiimpacts.org/feed?paged=20", "authors": ["Katja Grace"], "id": "4fe7c14c5cf3095445c7ee8f96aae261", "summary": []} {"text": "Selection bias from optimistic experts\n\nExperts on AI probably systematically underestimate time to human-level AI, due to a selection bias. The same is more strongly true of AGI experts. The scale of such biases appears to be decades. Most public AI predictions are from AI and AGI researchers, so this bias is relevant to interpreting these predictions.\n\n\nDetails\n-------\n\n\n### Why we expect bias\n\n\nWe can model a person’s views on AI timelines as being influenced both by their knowledge of AI and other somewhat independent factors, such as their general optimism and their understanding of technological history. People who are initially more optimistic about progress in AI seem more likely to enter the field of AI than those who are less so. Thus we might expect experts in AI to be selected for being optimistic, for reasons independent of their expertise. Similarly, AI researchers presumably enter the subfield of AGI more if they are optimistic about human-level intelligence being feasible soon.\n\n\nThis means expert predictions should tend to be more optimistic than they would if they were made by random people who became well informed, and thus are probably overall too optimistic (setting aside any other biases we haven’t considered).\n\n\nThis reason to expect bias only applies to the extent that predictions are made based on personal judgments, rather than explicit procedures that can be verified to avoid such biases. However predictions in AI appear to be very dependent on such judgments. Thus we expect some bias toward earlier predictions from AI experts, and more so from AGI experts. How large such biases might be is unclear however.\n\n\n### Empirical evidence for bias\n\n\nAnalysis of the [MIRI dataset](http://aiimpacts.org/miri-ai-predictions-dataset/ \"MIRI AI Predictions Dataset\") supports a selection bias existing. Median people working in AGI are around two decades more optimistic than median AI researchers from outside AGI. Those in AI [are more optimistic](http://aiimpacts.org/group-differences-in-ai-predictions/ \"Group Differences in AI Predictions\") again than ‘others’, and futurists are slightly more optimistic than even AGI researchers, though these are less clear due to small and ambiguous samples. In sum, the groups do make different predictions in the directions that we would expect as a result of such bias.\n\n\nHowever it is hard to exclude expertise as an explanation for these differences, so this does not strongly imply that there are biases. There could also be biases that are not caused by selection effects, such as [wishful thinking](http://en.wikipedia.org/wiki/Wishful_thinking), [planning fallacy](http://en.wikipedia.org/wiki/Planning_fallacy), or [self-serving bias](http://en.wikipedia.org/wiki/Self-serving_bias). There may also be other plausible explanations we haven’t considered.\n\n\nSince there are several plausible reasons for the differences we see here, and few salient reasons to expect effects in the opposite direction (expertise could go either way), the size of the selection biases in question are probably at most as large as the gaps between the predictions of the groups. That is, roughly two decades between AI and AGI researchers, and another several decades between AI researchers and others. Part of this span should be a bias of the remaining group toward being too pessimistic, but in both cases the remaining groups are much larger than the selected group, so most of the bias should be in the selected group.\n\n\n### Effects of group biases on predictions\n\n\nPeople being selected into groups such as ‘AGI researchers’ based on their optimism does not in itself introduce a bias. The problem arises when people from different groups start making different numbers of predictions. In practice, they do. Among the predictions we know of, most are from AI researchers, and a large fraction of those are from AGI researchers. Of surveys [we have recorded](http://aiimpacts.org/ai-timeline-surveys/ \"AI Timeline Surveys\"), 80% target AI or AGI researchers, and around half of them target AGI researchers in particular. Statements in the [MIRI dataset](http://aiimpacts.org/miri-ai-predictions-dataset/ \"MIRI AI Predictions Dataset\") since 2000 include 13 from AGI researchers, 16 from AI researchers, 6 from futurists, and 6 from others. This suggests we should expect aggregated predictions from surveys and statements to be optimistic, by roughly decades.\n\n\n### Conclusions\n\n\nIt seems likely that AI and AGI researchers’ predictions exhibit a selection bias toward being early, based on reason to expect such a bias, the large disparity between AI and AGI researchers’ predictions (while AI researchers seem likely to be optimistic if anything), and the consistency between the distributions we see and those we would expect under the selection bias explanation for disagreement. Since AI and AGI researchers are heavily represented in prediction data, predictions are likely to be biased toward optimism, by roughly decades.\n\n\n \n\n\nRelevance\n---------\n\n\n**Accuracy of AI predictions**: many AI timeline predictions come from AI researchers and AGI researchers, and people interested in futurism. If we want to use these predictions to estimate AI timelines, it is valuable to know how biased they are, so we can correct for such biases.\n\n\n**Detecting relevant expertise**: if the difference between AI and AGI researcher predictions is not due to bias, then it suggests one group had additional information. Such information would be worth investigating.\n\n", "url": "https://aiimpacts.org/bias-from-optimistic-predictors/", "title": "Selection bias from optimistic experts", "source": "aiimpacts.org", "source_type": "wordpress", "date_published": "2015-05-29T18:50:48+00:00", "paged_url": "https://aiimpacts.org/feed?paged=20", "authors": ["Katja Grace"], "id": "c04250b1c7b1bcc983084b86f3c78e8a", "summary": []} {"text": "Why do AGI researchers expect AI so soon?\n\n*By Katja Grace, 24 May 2015*\n\n\nPeople have been predicting when human-level AI will appear for many decades. A few years ago, MIRI [made](http://lesswrong.com/lw/e79/ai_timeline_prediction_data/) a big, organized collection of such predictions, along with helpful metadata. We are grateful, and just put up a [page about this dataset](http://aiimpacts.org/miri-ai-predictions-dataset/ \"MIRI AI Predictions Dataset\"), including some analysis. Some of you saw an earlier version of on an earlier version of our site.\n\n\nThere are lots of interesting things to say about the collected predictions. One interesting thing you might say is ‘wow, the median predictor thinks human-level AI will arrive in the 2030s—that’s kind of alarmingly soon’. While this is true, another interesting thing is that different groups have fairly different predictions. This means the overall median date is especially sensitive to who is in the sample.\n\n\nIn this particular dataset, who is in the sample depends a lot on who bothers to make public predictions. And [another interesting fact](http://aiimpacts.org/ai-timeline-predictions-in-surveys-and-statements/) is that people who bother to make public predictions have shorter AI timelines than people who are surveyed more randomly. This means the predictions you see here are probably biased in the somewhat early direction. We’ll talk about that another time. For now, I’d like to show you some of the interesting [differences between groups of people](http://aiimpacts.org/group-differences-in-ai-predictions/ \"Group Differences in AI Predictions\").\n\n\nWe divided the people who made predictions into those in AI, those in [AGI](http://en.wikipedia.org/wiki/Artificial_general_intelligence), futurists and others. This was a quick and imprecise procedure mostly based on Paul’s knowledge of the fields and the people, and some Googling. Paul doesn’t think he looked at the prediction dates before categorizing, though he probably basically knew some already. For each person in the dataset, we also interpreted their statement as a loose claim about when human-level AI was less likely than not to have arrived and when it was more likely than not to have arrived.\n\n\nBelow is what some of the different groups’ predictions look like, for predictions made since 2000. At each date, the line shows what fraction of predictors in that group think AI will already have happened by then, more likely than not. Note that they may also think AI will have happened before then: statements were not necessarily about the first year on which AI would arrive.\n\n\n[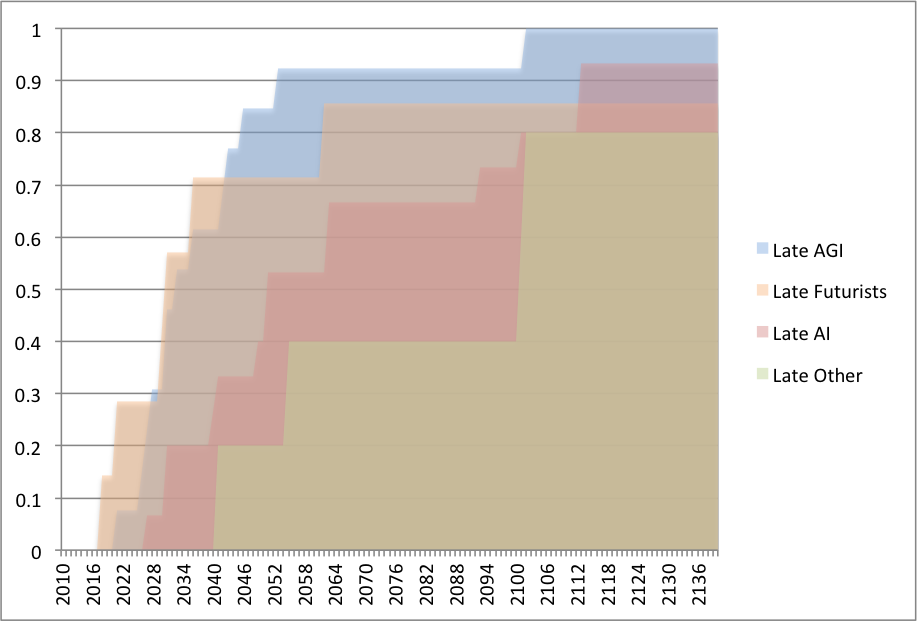](http://aiimpacts.org/wp-content/uploads/2015/05/groupsAIpredictions.png)**Figure 1:** Cumulative distributions of predictions made since 2000 by different groups of people\nThe groups’ predictions look pretty different, and mostly in ways you might expect: futurists and AGI researchers are more optimistic than other AI researchers, who are more optimistic than ‘others’. The median years given by different groups span seventy years, though this is mostly due to ‘other’, which is a small group. Medians for AI and AGI are eighteen years apart.\n\n\nThe ‘futurist’ and ‘other’ categories are twelve people together, and the line between being a futurist and merely pronouncing on the future sometimes seems blurry. It is interesting that the futurists here look very different from the the ‘others’, but I wouldn’t read that much into it. It may just be that Paul’s perception of who is a futurist depends on degree of confidence about futuristic technology.\n\n\nMost of the predictors are in the AI or AGI categories. These groups have markedly different expectations. About 85% of AGI researchers are more optimistic than the median AI researcher. This is particularly important because ‘expert predictions’ about AI usually come from some combination of AI and AGI researchers, and it looks like what the combination is may alter the median date by around two decades.\n\n\nWhy would AGI researchers be systematically more optimistic than other AI researchers? There are perhaps too many plausible explanations for the discrepancy.\n\n\nMaybe AGI researchers are—like many—overoptimistic about their own project. Planning fallacy is ubiquitous, and planning fallacy about building AGI naturally shortens overall AGI timelines.\n\n\nAnother possibility is expertise: perhaps human-level AI really will arrive soon, and the AGI researchers are close enough to the action to see this, while it takes time for the information to percolate to others. The AI researchers are also somewhat informed, so their predictions are partway between those of the AGI researchers, and those of the public.\n\n\nAnother reason is selection bias. AI researchers who are more optimistic about AGI will tend to enter the subfield of AGI more often than those who think human-level AI is a long way off. Naturally then, AGI researchers will always be more optimistic about AGI than AI researchers are, even if they are all reasonable and equally well informed. It seems hard to imagine some of the effect not being caused by this.\n\n\nIt matters which explanations are true: expertise means we should listen to AGI researchers above others. Planning fallacy and selection bias suggest we should not listen to them so much, or at least not directly. If we want to listen to them in those cases, we might want to make different adjustments to account for biases.\n\n\nHow can we tell which explanations are true? The shapes of the curves could give some evidence. What would we expect the curves to look like if the different explanations were true? Planning fallacy might look like the entire AI curve being shifted fractionally to the left to produce the AGI curve – e.g. so all of the times are halved. Selection bias would make the AGI curve look like the bottom of the AI curve, or the AI curve with its earlier parts heavily weighted. Expertise could look like dates that everyone in the know just doesn’t predict. Or the predictions might just form a narrower, more accurate, band. In fact all of these would lead to pretty similar looking graphs, and seem to roughly fit the data. So I don’t think we can infer much this way.\n\n\nDo you favor any of the hypotheses I mentioned? Or others? How do you distinguish between them?\n\n\n \n\n\n\n\n---\n\n\n*Our page about demographic differences in AI predictions is [here](http://aiimpacts.org/group-differences-in-ai-predictions/ \"Group Differences in AI Predictions\").* \n\n\n*Our page about the MIRI AI predictions dataset is [here](http://aiimpacts.org/miri-ai-predictions-dataset/ \"MIRI AI Predictions Dataset\").*\n\n", "url": "https://aiimpacts.org/why-do-agi-researchers-expect-ai-so-soon/", "title": "Why do AGI researchers expect AI so soon?", "source": "aiimpacts.org", "source_type": "wordpress", "date_published": "2015-05-25T00:03:56+00:00", "paged_url": "https://aiimpacts.org/feed?paged=20", "authors": ["Katja Grace"], "id": "978bdb641f5eff99977564b719cba206", "summary": []} {"text": "Group Differences in AI Predictions\n\n*Updated 9 November 2020*\n\n\nIn 2015 AGI researchers appeared to expect human-level AI substantially sooner than other AI researchers. The difference ranges from about five years to at least about sixty years as we move from highest percentiles of optimism to the lowest. Futurists appear to be around as optimistic as AGI researchers. Other people appear to be substantially more pessimistic than AI researchers.\n\n\nDetails\n-------\n\n\n### MIRI dataset\n\n\nWe categorized predictors in the [MIRI dataset](http://aiimpacts.org/miri-ai-predictions-dataset/ \"MIRI AI Predictions Dataset\") as AI researchers, AGI (artificial general intelligence) researchers, Futurists and Other. We also interpreted their statements into a common format, roughly corresponding to the first year in which the person appeared to be suggesting that human-level AI was more likely than not (see ‘minPY’ described [here](http://aiimpacts.org/miri-ai-predictions-dataset/ \"MIRI AI Predictions Dataset\")).\n\n\nRecent (since 2000) predictions are shown in the figure below. Those made by people working on AGI specifically tended to be decades more optimistic than those at the same percentile of optimism working in other areas of AI. The difference ranged from around five years to at least around sixty years as we move from the soonest predictions to the latest. Those who worked in AI broadly tended to be at least a decade more optimistic than ‘others’, at any percentile of optimism within their group. Futurists were about as optimistic as AGI researchers.\n\n\nNote that these predictions were made over a period of at least 12 years, rather than at the same time.\n\n\n[](http://aiimpacts.org/wp-content/uploads/2015/05/groupsAIpredictions.png)**Figure 1:**Cumulative probability of AI being predicted ([minPY](http://aiimpacts.org/miri-ai-predictions-dataset/ \"MIRI AI Predictions Dataset\")), for various groups, for predictions made after 2000. See [here](https://sites.google.com/site/aiimpactslibrary/ai-timelines/predictions-of-human-level-ai-dates/miri-ai-predictions-dataset).\n\n\nMedian predictions are shown below (these are also minPY predictions as defined on the [MIRI dataset page](http://aiimpacts.org/miri-ai-predictions-dataset/ \"MIRI AI Predictions Dataset\"), calculated from ‘cumulative distributions’ sheet in updated dataset spreadsheet also available there).\n\n\n\n\n| | | | | | |\n| --- | --- | --- | --- | --- | --- |\n| **Median AI predictions** | AGI | AI | Futurist | Other | All |\n| Early (pre-2000) (warning: noisy) | | 1988 | 2031 | 2036 | 2025 |\n| Late (since 2000) | 2033 | 2051 | 2031 | 2101 | 2042 |\n\n\n### FHI survey data\n\n\nThe [FHI survey](http://aiimpacts.org/fhi-ai-timelines-survey/ \"FHI Winter Intelligence Survey\") results suggest that people’s views are not very different if they work in computer science or other parts of academia. We have not investigated this evidence in more detail.\n\n\nImplications\n------------\n\n\n**Biases from optimistic predictors and information asymmetries:**Differences of opinion among groups who predict AI suggest that either some groups have more information, or that biases exist between predictions made by the groups (e.g. even among unbiased but noisy forecasters, if only people most optimistic about a field enter it, then the views of those in the field will be [biased toward optimism](http://aiimpacts.org/bias-from-optimistic-predictors/)) . Either of these is valuable to know about, so that we can either look into the additional information, or try to correct for the biases.\n\n", "url": "https://aiimpacts.org/group-differences-in-ai-predictions/", "title": "Group Differences in AI Predictions", "source": "aiimpacts.org", "source_type": "wordpress", "date_published": "2015-05-24T20:37:27+00:00", "paged_url": "https://aiimpacts.org/feed?paged=20", "authors": ["Katja Grace"], "id": "9fb39fb6f29a8089c467b41345e9ebd6", "summary": []} {"text": "Supporting AI Impacts\n\n\n*By Katja Grace, 21 May 2015*\n\n\nWe now have a [donations page](http://aiimpacts.org/donate/ \"Donate\"). If you like what we are doing as much as anything else you can think of to spend marginal dollars on, I encourage you to support this project! Money will go to more of the kind of thing you see, including AI Impacts’ existence.\n\n\nBriefly, I think AI Impacts is worth supporting because AI is a really big deal, improving our forecasts of AI is a neglected leg of AI preparations, and [there are](http://aiimpacts.org/possible-investigations/ \"Possible Empirical Investigations\") [cheap, tractable](http://aiimpacts.org/research-topic-hardware-software-and-ai/ \"Research topic: Hardware, software and AI\") [projects](http://aiimpacts.org/multipolar-research-projects/ \"List of multipolar research projects\") which could improve our forecasts. I hope to elaborate on these claims more quantitatively in the future.\n\n\nIf you like what we are doing enough to want to hear about it sometimes, but not enough to want to pay for it, you might want to follow us on [Facebook](https://www.facebook.com/aiimpacts?ref=aymt_homepage_panel) or [Twitter](https://twitter.com/AIImpacts) or RSSs ([blog](http://feeds.feedburner.com/AiImpactsBlog), [featured articles](http://feeds.feedburner.com/AiImpactsFeaturedArticles)). If you don’t like what we are doing even that much, and you think we could do better, [we’d always love to hear](http://aiimpacts.org/feedback/ \"Feedback\") about it.\n\n\n*(Image: [Rosario Fiore](https://www.flickr.com/photos/38703275@N06/7030753959))*\n\n", "url": "https://aiimpacts.org/supporting-ai-impacts/", "title": "Supporting AI Impacts", "source": "aiimpacts.org", "source_type": "wordpress", "date_published": "2015-05-22T05:27:11+00:00", "paged_url": "https://aiimpacts.org/feed?paged=21", "authors": ["Katja Grace"], "id": "05457151d60fa423ba2398ce37194996", "summary": []} {"text": "The Maes-Garreau Law\n\nThe Maes-Garreau law posits that people tend to predict exciting future technologies toward the end of their lifetimes. It probably does not hold for predictions of human-level AI.\n\n\nClarification\n-------------\n\n\nFrom [Wikipedia](http://en.wikipedia.org/wiki/Maes%E2%80%93Garreau_law):\n\n\n\n> The **Maes–Garreau law** is the statement that “most favorable predictions about future technology will fall within the Maes–Garreau point”, defined as “the latest possible date a prediction can come true and still remain in the lifetime of the person making it”. Specifically, it relates to predictions of a [technological singularity](http://en.wikipedia.org/wiki/Technological_singularity \"Technological singularity\") or other radical future technologies.\n> \n> \n\n\nThe law was posited by Kevin Kelly, [here](http://kk.org/thetechnium/2007/03/the-maesgarreau/).\n\n\nEvidence\n--------\n\n\nIn the MIRI dataset, age and predicted time to AI are very weakly anti-correlated, with a correlation of -0.017. That is, older people expect AI very slightly sooner than others. This suggests that if the Maes-Garreau law applies to human-level AI predictions, it is very weak, or is being masked by some other effect. [Armstrong and Sotala](http://intelligence.org/files/PredictingAI.pdf) also interpret an earlier version of the same dataset as evidence against the Maes-Garreau law substantially applying, using a different method of analysis.\n\n\nEarlier, smaller, informal analyses find evidence of the law, but in different settings. According to Rodney Brooks (according to Kevin Kelly), Pattie Maes observed this effect strongly in a survey of public predictions of human uploading:\n\n\n\n> [Maes] took as many people as she could find who had publicly predicted downloading of consciousness into silicon, and plotted the dates of their predictions, along with when they themselves would turn seventy years old. Not too surprisingly, the years matched up for each of them. Three score and ten years from their individual births, technology would be ripe for them to download their consciousnesses into a computer. Just in the nick of time! They were each, in their own minds, going to be remarkably lucky, to be in just the right place at the right time.\n> \n> \n\n\nHowever, according to Kelly, the data was not kept.\n\n\nKelly [did](http://kk.org/thetechnium/2007/03/the-maesgarreau/) another small search for predictions of the singularity, which appears to only support a very weakened version of the law: many people predict AI within their lifetime.\n\n\nThe hypothesized reason for this relationship is that people would like to believe they will personally avoid death. If this is true, we might expect the relation to apply much more strongly to predictions of events which might fairly directly save a person from death. Human uploading and the singularity are such events, while human-level AI does not appear to be. Thus it is plausible that this law does apply to some technological predictions, but not human-level AI.\n\n\nImplications\n------------\n\n\n**Evidence about wishful thinking:** the Maes-Garreau law is a relatively easy to check instance of a larger class of hypotheses to do with AI predictions being directed by wishful thinking. If wishful thinking were a large factor in AI predictions, this would undermine accuracy because it is not related to when human-level AI will appear. That the Maes-Garreau law doesn’t seem to hold is evidence against wishful thinking being a strong determinant of AI predictions. Further evidence might be obtained by observing the correlation between belief that human-level AI will be positive for society and belief that it will come soon.\n\n", "url": "https://aiimpacts.org/the-maes-garreau-law/", "title": "The Maes-Garreau Law", "source": "aiimpacts.org", "source_type": "wordpress", "date_published": "2015-05-20T11:18:50+00:00", "paged_url": "https://aiimpacts.org/feed?paged=21", "authors": ["Katja Grace"], "id": "bc9f78c0d56f1071d0e24f5a50a8eb52", "summary": []} {"text": "AI Timeline predictions in surveys and statements\n\nSurveys seem to produce median estimates of time to human-level AI which are roughly a decade later than those produced from voluntary public statements.\n\n\nDetails\n-------\n\n\nWe [compared](http://aiimpacts.org/miri-ai-predictions-dataset/ \"MIRI AI Predictions Dataset\") several surveys to predictions made by similar groups of people in the [MIRI AI predictions dataset](http://aiimpacts.org/miri-ai-predictions-dataset/ \"MIRI AI Predictions Dataset\"), and found that predictions made in surveys were roughly 0-2 decade later. This was a rough and non-rigorous comparison, and we made no effort to control for most variables.\n\n\nStuart Armstrong and Kaj Sotala make a similar comparison [here](http://lesswrong.com/r/discussion/lw/gta/selfassessment_in_expert_ai_predictions/), and also find survey data to give later predictions. However they are comparing non-survey data largely from recent decades with survey data entirely from 1973, which we think makes the groups too different in circumstance to infer much about surveys and statements in particular. Though in the MIRI dataset (that they used), very early predictions [tend to be](http://aiimpacts.org/miri-ai-predictions-dataset/ \"MIRI AI Predictions Dataset\") more optimistic than later predictions, if anything, so if they had limited themselves to predictions from similar times there would have been a larger difference (though with a very small sample of statements).\n\n\nRelevance\n---------\n\n\n**Accuracy of AI predictions**: [some biases](http://aiimpacts.org/short-prediction-publication-biases/) which probably exist in public statements about AI predictions are likely to be smaller or not apply in survey data. For instance, public statements are probably more likely to be made by people who believe they have surprising or interesting views, whereas this should much less influence answers to a survey question once someone is taking a survey. Thus comparing data from surveys and voluntary statements can tell us about the strength of such biases. Given that median survey predictions are rarely more than a decade later than similar statements, and survey predictions seem unlikely to be strongly biased in this way, median statements are probably less than a decade early as a result of this bias.\n\n", "url": "https://aiimpacts.org/ai-timeline-predictions-in-surveys-and-statements/", "title": "AI Timeline predictions in surveys and statements", "source": "aiimpacts.org", "source_type": "wordpress", "date_published": "2015-05-20T11:01:48+00:00", "paged_url": "https://aiimpacts.org/feed?paged=21", "authors": ["Katja Grace"], "id": "41f26cb2eb719e2c0c342087eea20046", "summary": []} {"text": "MIRI AI Predictions Dataset\n\nThe MIRI AI predictions dataset is a collection of public predictions about human-level AI timelines. We edited the original dataset, as described below. Our dataset is available [here](https://www.dropbox.com/s/x3737sampmb2e8i/siai-fhi_ai_predictions_KG_amended.xlsx), and the original [here](http://lesswrong.com/lw/e79/ai_timeline_prediction_data/).\n\n\nInteresting features of the dataset include:\n\n\n* The median dates at which people’s predictions suggest AI is less likely than not and more likely than not are 2033 and 2037 respectively.\n* Predictions made before 2000 and after 2000 are distributed similarly, in terms of time remaining when the prediction is made\n* Six predictions made before 1980 were probably systematically sooner than predictions made later.\n* AGI researchers appear to be more optimistic than AI researchers.\n* People predicting AI in public statements (in the MIRI dataset) predict earlier dates than demographically similar survey takers do.\n* Age and predicted time to AI are almost entirely uncorrelated: r = -.017.\n\n\nDetails\n-------\n\n\n### History of the dataset\n\n\nWe got the original MIRI dataset from [here](http://lesswrong.com/lw/e79/ai_timeline_prediction_data/). According to the accompanying post, the [Machine Intelligence Research Institute](https://aiimpacts.org/feed/intelligence.org) (MIRI) commissioned Jonathan Wang and Brian Potter to gather the data. Kaj Sotala and Stuart Armstrong analyzed and categorized it (their categories are available in both versions of the dataset). It was used in the papers [Armstrong and Sotala 2012](https://intelligence.org/files/PredictingAI.pdf) and [Armstrong and Sotala 2014](http://www.tandfonline.com/doi/full/10.1080/0952813X.2014.895105#.VLLDZorF8kM). We modified the dataset, as described below. Our version is [here.](https://www.dropbox.com/s/x3737sampmb2e8i/siai-fhi_ai_predictions_KG_amended.xlsx)\n\n\n#### Our changes to the dataset\n\n\nThese are changes we made to the dataset:\n\n\n* There were a few instances of summary results from large surveys included as single predictions – we removed these because survey medians and individual public predictions seem to us sufficiently different to warrant considering separately.\n* We removed entries which appeared to be duplications of the same data, from different sources.\n* We removed predictions made by the same individual within less than ten years.\n* We removed some data which appeared to have been collected in a biased fashion, where we could not correct the bias.\n* We removed some entries that did not seem to be predictions about general artificial intelligence\n* We may have removed some entries for other similar reasons\n* We added some predictions we knew of which were not in the data.\n* We fixed some small typographic errors.\n\n\nDeleted entries can be seen in the last sheet of our version of the dataset. Most have explanations in one of the last few columns.\n\n\nWe continue to change the dataset as we find predictions it is missing, or errors in it. The current dataset may not exactly match the descriptions on this page.\n\n\n#### How did our changes matter?\n\n\nImplications of the above changes:\n\n\n* The dataset originally had 95 predictions; our version has 65 at last count.\n* Armstrong and Sotala transformed each statement into a ‘median’ prediction. In the original dataset, the mean ‘median’ was 2040 and the median ‘median’ 2030. After our changes, the mean ‘median’ is 2046 and the median ‘median’ remains at 2030. The means are highly influenced by extreme outliers.\n* We have not evaluated Armstrong and Sotala’s findings in the updated dataset. One reason is that their findings are mostly qualitative. For instance, it is a matter of judgment whether there is still ‘a visible difference’ between expert and non-expert performance. Our judgment may differ from those authors anyway, so it would be unclear whether the change in data changed their findings. We address some of the same questions by different methods.\n\n\n#### minPY and maxIY predictions\n\n\nPeople say many slightly different things about when human-level AI will arrive. We interpreted predictions into a common format: one or both of a claim about when human-level AI would be less likely than not, and a claim about when human-level AI would be more likely than not. Most people didn’t explicitly use such language, so we interpreted things roughly, as closely as we could. For instance, if someone said ‘AI will not be here by 2080’ we would interpret this as AI being less likely to exist than not by that date.\n\n\nThroughout this page, we use ‘minimum probable year’ (minPY) to refer to the minimum time when a person is interpreted as stating that AI is more likely than not. We use ‘maximum improbable year’ (maxIY) to refer to the maximum time when a person is interpreted as stating that AI is less likely than not. To be clear, these are not necessarily the earliest and latest times that a person holds the requisite belief – just the earliest and latest times that is implied by their statement. For instance, if a person says ‘I disagree that we will have human-level AI in 2050’, then we interpret this as a maxIY prediction of 2050, though they may well also believe AI is less likely than not in 2065 also. We would not interpret this statement as implying any minPY. We interpreted predictions like ‘AI will arrive in about 2045’ as 2045 being the date at which AI would become more likely than not, so both minPY and a maxIY of 2045.\n\n\nThis is different to the ‘median’ interpretation Armstrong and Sotala provided. Which is not necessarily to disagree with their measure: as [Armstrong](http://lesswrong.com/lw/e79/ai_timeline_prediction_data/) points out, it is useful to have independent interpretations of the predictions. Both our measure and theirs could mislead in different circumstances. People who say ‘AI will come in about 100 years’ and ‘AI will come within about 100 years’ probably don’t mean to point to estimates 50 years apart (as they might be seen to in Armstrong and Sotala’s measure). On the other hand, if a person says ‘AI will obviously exist before 3000AD’ we will record it as ‘AI is more likely than not from 3000AD’ and it may be easy to forget that in the context this was far from the earliest date at which they thought AI was more likely than not.\n\n\n\n\n| | | | | |\n| --- | --- | --- | --- | --- |\n| | Original A&S ‘median’ | Updated A&S ‘median’ | minPY | maxIY |\n| Mean | 2040 | 2046 | 2067 | 2067 |\n| Median | 2030 | 2030 | 2037 | 2033 |\n\n\n***Table 1:** Summary of mean and median AI predictions under different interpretations*\n\n\nAs shown in Table 1, our median dates are a few years later than Armstrong & Sotala’s original or updated dates, and only four years from one another.\n\n\n#### Categories used in our analysis\n\n\n##### Timing\n\n\n‘Early’ throughout refers to before 2000. ‘Late’ refers to 2000 onwards. We split the predictions in this way because often we are interested in recent predictions, and 2000 is a relatively natural recent cutoff. We chose this date without conscious attention to the data beyond the fact that there have been plenty of predictions since 2000.\n\n\n##### Expertise\n\n\nWe categorized people as ‘AGI’, ‘AI’, ‘futurist’ and ‘other’ as best we could, according to their apparent research areas and activities. These are ambiguous categories, but the ends to which we put such categorization do not require that they be very precise.\n\n\n### Findings\n\n\n#### Basic statistics\n\n\nThe median minPY is 2037 and median maxIY is 2033 (see ‘Basic statistics’ sheet). The mean minPY is 2067, which is the same as the mean maxIY (see ‘Basic statistics’ sheet). These means are fairly meaningless, as they are influenced greatly by a few extreme outliers. Figure 1 shows the distribution of most of the predictions.\n\n\n[](http://aiimpacts.wpengine.com/wp-content/uploads/2014/12/AI-and-no-AI-Predictions-1.png)**Figure 1:**minPY (‘AI after’) and maxIY (‘No AI till’) predictions(from ‘Basic statistics’ sheet)\n\n\nThe following figures shows the fraction of predictors over time who claimed that human-level AI is more likely to have arrived by that time than not (i.e. minPY predictions). The first is for all predictions, and the second for predictions since 2000. The first graph is hard to meaningfully interpret, because the predictions were made in very different volumes at very different times. For instance, the small bump on the left is from a small number of early predictions. However it gives a rough picture of the data.\n\n\n[](http://aiimpacts.wpengine.com/wp-content/uploads/2014/12/Cumulative-AI-predictions-1.png)**Figure 2**: Fraction of all minPY predictions which say AI will have arrived, over time (From ‘Cumulative distributions’ sheet).\n\n\n[](http://aiimpacts.wpengine.com/wp-content/uploads/2014/12/predictions-since-2000-cdf-1.png)**Figure 3**: Fraction of late minPY predictions (made since 2000) which say AI will have arrived, over time (From ‘Cumulative distributions’ sheet).\n\n\nRemember that these are dates from which people claimed something like AI being more likely than not. Such dates are influenced not only by what people believe, but also by what they are asked. If a person believes that AI is more likely than not by 2020, and they are asked ‘will there be AI in 2060’ they will respond ‘yes’ and this will be recorded as a prediction of AI being more likely than not after 2060. The graph is thus an upper bound for when people predict AI is more likely than not. That is, the graph of when people really predict AI with 50 percent confidence keeps somewhere to the left of the one in figures 2 and 3.\n\n\n#### Similarity of predictions over time\n\n\nIn general, early and late predictions are distributed fairly similarly over the years following them. For minPY predictions, the correlation between the date of a prediction and number of years until AI is predicted from that time is 0.13 (see ‘Basic statistics’ sheet). Figure 5 shows the cumulative probability of AI being predicted over time, by late and early predictors. At a glance, they are surprisingly similar. The largest difference between the fraction of early and of late people who predict AI by any given distance in the future is about 15% (see ‘Predictions over time 2’ sheet). A difference this large is fairly likely by chance. However most of the predictions were made within twenty years of one another, so it is not surprising if they are similar.\n\n\nThe six very early predictions do seem to be unusually optimistic. They are all below the median 30 years, which would have a 1.6% probability of occurring by chance.\n\n\nFigures 4-7 illustrate the same data in different formats.\n\n\n[](http://aiimpacts.wpengine.com/wp-content/uploads/2014/12/Time-to-AI-more-likely-than-not-1.png)**Figure 4:**Time left until minPY predictions, by date when they were made. (From ‘Basic statistics’ sheet)\n\n\n[](http://aiimpacts.wpengine.com/wp-content/uploads/2014/12/time-to-predictions-2-1.png)**Figure 5:**Cumulative probability of AI being predicted (minPY) different distances out for early and late predictors (From ‘Predictions over time 2’ sheet)\n\n\n[](http://aiimpacts.wpengine.com/wp-content/uploads/2014/12/time-to-predictions-bins-1.png)**Figure 6:** Fraction of minPY predictions at different distances in the future, for early and late predictors (From ‘Predictions over time’ sheet)\n\n\n[](http://aiimpacts.wpengine.com/wp-content/uploads/2014/12/Early-vs-Late-CDF-1.png)**Figure 7:** Cumulative probability of AI being predicted by a given date, for early and late predictors (minPY). (From ‘Cumulative distributions’ sheet)\n\n\n#### Groups of participants\n\n\n##### Associations with expertise and enthusiasm\n\n\n###### Summary\n\n\nAGI people in this dataset are generally substantially more optimistic than AI people. Among the small number of futurists and others, futurists were optimistic about timing, and others were pessimistic.\n\n\n###### Details\n\n\nWe classified the predictors as AGI researchers, (other) AI researchers, Futurists and Other, and calculated CDFs of their minPY predictions, both for early and late predictors. The figures below show a selection of these. Recall that ‘early’ and ‘late’ correspond to before and after 2000.\n\n\nAs we can see in figure 8, Late AGI predictors are substantially more optimistic than late AI predictors: for almost any date this century, at least 20% more AGI people predict AI by then. The median late AI researcher minPY is 18 years later than the median AGI researcher minPY. We haven’t checked whether this is partly caused by predictions by AGI researchers having been made earlier.\n\n\nThere were only 6 late futurists, and 6 late ‘other’ (compared to 13 and 16 late AGI and late AI respectively), so the data for these groups is fairly noisy. Roughly, late futurists in the sample were more optimistic than anyone, while late ‘other’ were more pessimistic than anyone.\n\n\nThere were no early AGI people, and only three early ‘other’. Among seven early AI and eight early futurists, the AI people predicted AI much earlier (70% of early AI people predict AI before any early futurists do), but this seems to be at least partly explained by the early AI people being concentrated very early, and people predicting AI similar distances in the future throughout time.\n\n\n[](http://aiimpacts.wpengine.com/wp-content/uploads/2014/12/AI-vs-AGD-CDF-1.png)**Figure 8:**Cumulative probability of AI being predicted over time, for late AI and late AGI predictors.(See ‘Cumulative distributions’ sheet)\n\n\n[](http://aiimpacts.org/wp-content/uploads/2015/05/groupsAIpredictions.png)**Figure 9:**Cumulative probability of AI being predicted over time, for all late groups. (See ‘Cumulative distributions’ sheet)\n\n\n\n\n| | | | | | |\n| --- | --- | --- | --- | --- | --- |\n| ****Median******minPY predictions** | AGI | AI | Futurist | Other | All |\n| Early (warning: noisy) | – | 1988 | 2031 | 2036 | 2024 |\n| Late | 2033 | 2051 | 2030 | 2101 | 2042 |\n\n\n***Table 2:** Median minPY predictions for all groups, late and early. There were no early AGI predictors.*\n\n\n##### Statement makers and survey takers\n\n\n###### Summary\n\n\nSurveys seem to produce later median estimates than similar individuals making public statements do. We compared some of the [surveys](http://aiimpacts.org/ai-timeline-surveys/ \"AI Timeline Surveys\") we know of to the demographically similar predictors in the MIRI dataset. We expected these to differ because predictors in the MIRI dataset are mostly choosing to making public statements, while survey takers are being asked, relatively anonymously, for their opinions. Surveys seem to produce median dates on the order of a decade later than statements made by similar groups.\n\n\n###### Details\n\n\nWe expect surveys and voluntary statements to be subject to different selection biases. In particular, we expect surveys to represent a more even sample of opinion, while voluntary statements to be more strongly concentrated among people with exciting things to say or strong agendas. To learn about the difference between these groups, and thus the extent of any such bias, we below compare median predictions made in surveys to median predictions made by people from similar groups in voluntary statements.\n\n\nNote that this is rough: categorizing people is hard, and we have not investigated the participants in these surveys more than cursorily. There are very few ‘other’ predictors in the MIRI dataset. The results in this section are intended to provide a ballpark estimate only.\n\n\nAlso note that while both sets of predictions are minPYs, the survey dates are often the actual median year that a person expects AI, whereas the statements could often be later years which the person happens to be talking about.\n\n\n\n\n| | | | | |\n| --- | --- | --- | --- | --- |\n| Survey | Primary participants | Median minPY prediction in comparable statements in the MIRI data | Median in survey | Difference |\n| Kruel (AI researchers) | AI | 2051 | 2062 | +11 |\n| Kruel (AGI researchers) | AGI | 2033 | 2031 | -2 |\n| AGI-09 | AGI | 2033 | 2040 | +7 |\n| FHI | AGI/other | 2033-2062 | 2050 | in range |\n| Klein | Other/futurist | 2030-2062 | 2050 | in range |\n| AI@50 | AI/Other | 2051-2062 | 2056 | in range |\n| Bainbridge | Other | 2062 | 2085 | +23 |\n\n\n***Table 3**: median predictions in surveys and statements from demographically similar groups.*\n\n\nNote that the [Kruel interviews](http://aiimpacts.org/kruel-ai-survey/ \"Kruel AI Interviews\") are somewhere between statements and surveys, and are included in both data.\n\n\nIt appears that the surveys give somewhat later dates than similar groups of people making statements voluntarily. Around half of the surveys give later answers than expected, and the other half are roughly as expected. The difference seems to be on the order of a decade. This is what one might naively expect in the presence of a bias from people advertising their more surprising views.\n\n\n##### Relation of predictions and lifespan\n\n\nAge and predicted time to AI are very weakly anti-correlated: r = -.017 (see Basic statistics sheet, “correlation of age and time to prediction”). This is evidence against a posited bias to predict AI within your existing lifespan, known as the [Maes-Garreau Law](http://en.wikipedia.org/wiki/Maes%E2%80%93Garreau_law).\n\n", "url": "https://aiimpacts.org/miri-ai-predictions-dataset/", "title": "MIRI AI Predictions Dataset", "source": "aiimpacts.org", "source_type": "wordpress", "date_published": "2015-05-20T10:18:11+00:00", "paged_url": "https://aiimpacts.org/feed?paged=21", "authors": ["Katja Grace"], "id": "0000269c2aee8ac9aa5e3683cd538745", "summary": []} {"text": "A new approach to predicting brain-computer parity\n\n*By Katja Grace, 7 May 2015*\n\n\nHow large does a computer need to be before it is ‘as powerful’ as the human brain?\n\n\nThis is a difficult question, which [people have answered](http://aiimpacts.org/preliminary-prices-for-human-level-hardware/ \"Preliminary prices for human-level hardware\") before, with much uncertainty.\n\n\nWe have a new answer! (Longer description [here](http://aiimpacts.org/brain-performance-in-teps/ \"Brain performance in TEPS\"); summary in the rest of this post.) This answer is based on ‘traversed edges per second’ ([TEPS](http://en.wikipedia.org/wiki/Traversed_edges_per_second)), a metric which emphasizes communication within a computer, instead of computing operations (like FLOPS). That is, TEPS measures how fast information can move around.\n\n\nCommunication can be a substantial bottleneck for big computers, slowing them down in spite of their powerful computing capacity. It seems plausible that communication is also a bottleneck for the brain, which is both a big computer, and one that spends lots of resources on communication. This is one reason to measure the brain in terms of TEPS: if communication is a bottleneck, then it is especially important to know when computers will achieve similar performance to the brain there, not just on easier aspects of being a successful computer.\n\n\nThe TEPS benchmark [asks the computer](http://www.graph500.org/specifications) to simulate a graph, and then to search through it. The question is how many edges in the graph the computer can follow per second. We can’t ask the brain to run the TEPS benchmark, but the brain is already a graph of neurons, and we can measure edges being traversed in it (action potentials communicating between neurons). So we can count how many edges are traversed in the brain per second, and compare this to existing computer hardware.\n\n\nThe brain seems to have around [1.8-3.2 x 10^14](http://aiimpacts.org/scale-of-the-human-brain/ \"Scale of the Human Brain\") synapses. We’d like to know how often these synapses convey spikes, but this has been too hard to discover. So we use neuron firing frequency as a proxy. We [previously calculated](http://aiimpacts.org/rate-of-neuron-firing/ \"Neuron firing rates in humans\") that each neuron spikes around 0.1-2 times per second. Together with the number of synapses, this suggests the brain performs at around 0.18 – 6.4 \\* 1014 TEPS. This assumes many things, and is hazy in many ways, some of which are detailed in our longer [page on the topic](http://aiimpacts.org/brain-performance-in-teps/ \"Brain performance in TEPS\"). The estimate could be tightened on many fronts with more work.\n\n\nThe [Sequoia supercomputer](http://en.wikipedia.org/wiki/IBM_Sequoia) is currently the [best computer in the world](http://www.graph500.org/results_nov_2014) on the TEPS benchmark. Its record is 2.3 \\*1013 TEPS. So the human brain seems to be somewhere between as powerful and thirty times as powerful as the best supercomputer, in terms of TEPS.\n\n\nAt current prices for TEPS, the brain’s performance should cost roughly $4,700 – $170,000/hour. Our previous [fairly wild guess](http://aiimpacts.org/cost-of-teps/ \"The cost of TEPS\") was that TEPS prices should improve by a factor of ten every four years. If this is true, it should take seven to fourteen years for a computer which costs $100/hour to be competitive with the human brain. At that point, if having human-level hardware in terms of TEPS [were enough](http://aiimpacts.org/how-ai-timelines-are-estimated/ \"How AI timelines are estimated\") to have [human-level AI](http://aiimpacts.org/human-level-ai/ \"Human-Level AI\"), human-level AI should be replacing well paid humans.\n\n\n[Moravec’s and Kurzweil’s](http://aiimpacts.org/preliminary-prices-for-human-level-hardware/ \"Preliminary prices for human-level hardware\") estimates of computation in the brain suggest human-equivalent hardware should cost $100/hour either some time in the past or in about four years respectively, so our TEPS estimate is actually late relative to those. However they are all pretty close together. Sandberg and Bostrom’s estimates of hardware required to emulate a brain [span from around then to around thirty years later](http://aiimpacts.org/preliminary-prices-for-human-level-hardware/ \"Preliminary prices for human-level hardware\"), though note that emulating is different from replicating functionally. Altogether ‘human-level’ hardware seems likely to be upon us soon, if it isn’t already. The estimate from TEPS points to the near future even more strongly.\n\n\n*(Featured image by [MartinGrandjean](https://aiimpacts.org/feed/By%20Martin Grandjean http:/en.wikipedia.org/wiki/Data_visualization#/media/File:Social_Network_Analysis_Visualization.png))*\n\n", "url": "https://aiimpacts.org/tepsbrainestimate/", "title": "A new approach to predicting brain-computer parity", "source": "aiimpacts.org", "source_type": "wordpress", "date_published": "2015-05-08T00:36:48+00:00", "paged_url": "https://aiimpacts.org/feed?paged=21", "authors": ["Katja Grace"], "id": "b727bde0871485691d1a2c361c66ea6d", "summary": []} {"text": "Brain performance in TEPS\n\nTraversed Edges Per Second (TEPS) is a benchmark for measuring a computer’s ability to communicate information internally. Given several assumptions, we can also estimate the human brain’s communication performance in terms of TEPS, and use this to meaningfully compare brains to computers. We estimate that (given these assumptions) the human brain performs around 0.18 – 6.4 \\* 1014 TEPS. This is within an order of magnitude more than existing supercomputers.\n\n\nAt current prices for TEPS, we estimate that it costs around $4,700 – $170,000/hour to perform at the level of the brain. Our best guess is that ‘human-level’ TEPS performance will cost less than $100/hour in seven to fourteen years, though this is highly uncertain.\n\n\nMotivation: why measure the brain in TEPS?\n------------------------------------------\n\n\n### **Why measure communication?**\n\n\nPerformance benchmarks such as floating point operations per second (FLOPS) and millions of instructions per second (MIPS) mostly measure how fast a computer can perform individual operations. However a computer also needs to move information around between the various components performing operations.[1](https://aiimpacts.org/brain-performance-in-teps/#easy-footnote-bottom-1-510 \"“According to Richard Murphy, a Principal Member of the Technical Staff at Sandia, “The Graph500’s goal is to promote awareness of complex data problems.” He goes on to explain, “Traditional HPC benchmarks – HPL being the preeminent – focus more on compute performance. Current technology trends have led to tremendous imbalance between the computer’s ability to calculate and to move data around, and in some sense produced a less powerful system as a result. Because “big data” problems tend to be more data movement and less computation oriented, the benchmark was created to draw awareness to the problem.”…And yet another perspective comes from Intel’s John Gustafson, a Director at Intel Labs in Santa Clara, CA, “The answer is simple: Graph 500 stresses the performance bottleneck for modern supercomputers. The Top 500 stresses double precision floating-point, which vendors have made so fast that it has become almost completely irrelevant at predicting performance for the full range of applications. Graph 500 is communication-intensive, which is exactly what we need to improve the most. Make it a benchmark to win, and vendors will work harder at relieving the bottleneck of communication.”” – Marvyn, The Case for the Graph 500 – Really Fast or Really Productive? Pick One\") This communication takes time, space and wiring, and so can substantially affect overall performance of a computer, especially on data intensive applications. Consequently when comparing computers it is useful to have performance metrics that emphasize communication as well as ones that emphasize computation. When comparing computers to the brain, there are further reasons to be interested in communication performance, as we shall see below.\n\n\n#### Communication is a plausible bottleneck for the brain\n\n\nIn modern high performance computing, communication between and within processors and memory is often a significant cost.[2](https://aiimpacts.org/brain-performance-in-teps/#easy-footnote-bottom-2-510 \"“Unfortunately, due to a lack of locality, graph applications are often memory-bound on shared-memory systems or communication-bound on clusters.” – Beamer et al, Graph Algorithm Platform\") [3](https://aiimpacts.org/brain-performance-in-teps/#easy-footnote-bottom-3-510 \"“While traditional performance benchmarks for high-performance computers measure the speed of arithmetic operations, memory access time is a more useful performance gauge for many large problems today. The Graph 500 benchmark has been developed to measure a computer’s performance in memory retrieval…Results are explained in detail in terms of the machine architecture, which demonstrates that the Graph 500 benchmark indeed provides a measure of memory access as the chief bottleneck for many applications.” Angel et al (2012), The Graph 500 Benchmark on a Medium-Size Distributed-Memory Cluster with High-Performance Interconnect\") [4](https://aiimpacts.org/brain-performance-in-teps/#easy-footnote-bottom-4-510 \"“The Graph 500 was created to chart how well the world’s largest computers handle such data intensive workloads…In a nutshell, the Graph 500 benchmark looks at “how fast [a system] can trace through random memory addresses,” Bader said. With data intensive workloads, “the bottleneck in the machine is often your memory bandwidth rather than your peak floating point processing rate,” he added.” Jackson (2012) World’s most powerful big data machines charted on Graph 500\") [5](https://aiimpacts.org/brain-performance-in-teps/#easy-footnote-bottom-5-510 \"“Making transistors — the tiny on-off switches of silicon chips — smaller and smaller has enabled the computer revolution and the $1 trillion-plus electronics industry. But if some smart scientist doesn’t figure out how to make copper wires better, progress could grind to a halt. In fact, the copper interconnection between transistors on a chip is now a bigger challenge than making the transistors smaller.” Takahashi (2012) Copper wires might be the bottleneck in the way of Moore’s Law\") Our impression is that in many applications it is more expensive than performing individual bit operations, making operations per second a less relevant measure of computing performance.\n\n\nWe should expect computers to become increasingly bottlenecked on communication as they grow larger, for theoretical reasons. If you scale up a computer, it requires linearly more processors, but superlinearly more connections for those processors to communicate with one another quickly. And empirically, this is what happens: the computers which prompted the creation of the TEPS benchmark were large supercomputers.\n\n\nIt’s hard to estimate the relative importance of computation and communication in the brain. But there are some indications that communication is an important expense for the human brain as well. A substantial part of the brain’s energy is used to transmit action potentials along axons rather than to do non-trivial computation.[6](https://aiimpacts.org/brain-performance-in-teps/#easy-footnote-bottom-6-510 \"See Lennie (2003), table 1. Spikes and resting potentials appear to make up around 40% of energy use in the brain. Around 30% of energy in spikes is spent on axons, and we suspect more of the energy on resting potentials is spent on axons. Thus we estimate that at least 10% of energy in the brain is used on communication. We don’t know a lot about the other components of energy use in this chart, so the fraction could be much higher.\") Our impression is also that the parts of the brain responsible for communication (e.g. axons) comprise a substantial fraction of the brain’s mass. That substantial resources are spent on communication suggests that communication is high value on the margin for the brain. Otherwise, resources would likely have been directed elsewhere during our evolutionary history.\n\n\nToday, our impression is that networks are typically implemented on single machines because communication between processors is otherwise very expensive. But the power of individual processors is not increasing as rapidly as costs are falling, and even today it would be economical to use thousands of machines if doing so could yield human-level AI. So it seems quite plausible that communication will become a very large bottleneck as neural networks scale further.\n\n\nIn sum, we suspect communication is a bottleneck for the brain for three reasons: the brain is a large computer, similar computing tasks tend to be bottlenecked in this way, and the brain uses substantial resources on communication.\n\n\nIf communication is a bottleneck for the brain, this suggests that it will also be a bottleneck for computers with similar performance to the brain. It does not strongly imply this: a different kind of architecture might be bottlenecked by different factors.\n\n\n#### Cost-effectiveness of measuring communication costs\n\n\nIt is much easier to estimate communication within the brain than to estimate computation. This is because action potentials seem to be responsible for most of the long-distance communication[7](https://aiimpacts.org/brain-performance-in-teps/#easy-footnote-bottom-7-510 \"“To achieve long distance, rapid communication, neurons have evolved special abilities for sending electrical signals (action potentials) along axons. This mechanism, called conduction, is how the cell body of a neuron communicates with its own terminals via the axon. Communication between neurons is achieved at synapses by the process of neurotransmission.” – Stufflebeam (2008), Neurons, Synapses, Action Potentials and Neurotransmission\"), and their information content is relatively easy to quantify. It is much less clear how many ‘operations’ are being done in the brain, because we don’t know in detail how the brain represents the computations it is doing.\n\n\nAnother issue that makes computing performance relatively hard to evaluate is the potential for custom hardware. If someone wants to do a lot of similar computations, it is possible to design custom hardware which computes much faster than a generic computer. This could happen with AI, making timing estimates based on generic computers too late. Communication may also be improved by appropriate hardware, but we expect the performance gains to be substantially smaller. We have not investigated this question.\n\n\nMeasuring the brain in terms of communication is especially valuable because it is a relatively independent complement to estimates of the brain’s performance based on computation. [Moravec](http://www.scientificamerican.com/article/rise-of-the-robots/), [Kurzweil](http://en.wikipedia.org/wiki/The_Singularity_Is_Near) and [Sandberg and Bostrom](http://www.fhi.ox.ac.uk/brain-emulation-roadmap-report.pdf) have all estimated the brain’s computing performance, and used this to deduce AI timelines. We don’t know of estimates of the total communication within the brain, or the cost of programs with similar communication requirements on modern computers. These an important and complementary aspect of the cost of ‘human-level’ computing hardware.\n\n\n### **TEPS**\n\n\n[Traversed edges per second](http://en.wikipedia.org/wiki/Traversed_edges_per_second) (TEPS) is a metric that was recently developed to measure communication costs, which were seen as neglected in high performance computing.[8](https://aiimpacts.org/brain-performance-in-teps/#easy-footnote-bottom-8-510 \"“According to Richard Murphy, a Principal Member of the Technical Staff at Sandia, “The Graph500’s goal is to promote awareness of complex data problems.” He goes on to explain, “Traditional HPC benchmarks – HPL being the preeminent – focus more on compute performance. Current technology trends have led to tremendous imbalance between the computer’s ability to calculate and to move data around, and in some sense produced a less powerful system as a result. Because “big data” problems tend to be more data movement and less computation oriented, the benchmark was created to draw awareness to the problem.”- Marvyn, The Case for the Graph 500 – Really Fast or Really Productive? Pick One
\n“The Graph 500 was created to chart how well the world’s largest computers handle such data intensive workloads…In a nutshell, the Graph 500 benchmark looks at “how fast [a system] can trace through random memory addresses,” Bader said. With data intensive workloads, “the bottleneck in the machine is often your memory bandwidth rather than your peak floating point processing rate,” he added.” Jackson (2012) World’s most powerful big data machines charted on Graph 500
\n“While traditional performance benchmarks for high-performance computers measure the speed of arithmetic operations, memory access time is a more useful performance gauge for many large problems today. The Graph 500 benchmark has been developed to measure a computer’s performance in memory retrieval…Results are explained in detail in terms of the machine architecture, which demonstrates that the Graph 500 benchmark indeed provides a measure of memory access as the chief bottleneck for many applications.” Angel et al (2012), The Graph 500 Benchmark on a Medium-Size Distributed-Memory Cluster with High-Performance Interconnect\") The TEPS benchmark measures the time required to perform a [breadth-first search](http://en.wikipedia.org/wiki/Breadth-first_search) on a large random graph, requiring propagating information across every edge of the graph (either by accessing memory locations associated with different nodes, or communicating between different processors associated with different nodes).[9](https://aiimpacts.org/brain-performance-in-teps/#easy-footnote-bottom-9-510 \"From Graph 500 specifications page:
\nThe benchmark performs the following steps:
\n- \n
- Generate the edge list. \n
- Construct a graph from the edge list (timed, kernel 1). \n
- Randomly sample 64 unique search keys with degree at least one, not counting self-loops. \n
- For each search key:\n
- \n
- Compute the parent array (timed, kernel 2). \n
- Validate that the parent array is a correct BFS [breadth first search] search tree for the given search tree. \n
\n - Compute and output performance information. \n
\") You can read about the benchmark in more detail at the [Graph 500 site](http://www.graph500.org/specifications).\n\n\n### **TEPS as a meaningful way to compare brains and computers**\n\n\n#### Basic outline of how to measure a brain in TEPS\n\n\nThough a brain cannot run the TEPS benchmark, we can roughly assess the brain’s communication ability in terms of TEPS. The brain is a large network of neurons, so we can ask how many edges between the neurons (synapses) are traversed (transmit signals) every second. This is equivalent to TEPS performance in a computer in the sense that the brain is sending messages along edges in a graph. However it differs in other senses. For instance, a computer with a certain TEPS performance can represent many different graphs and transmit signals in them, whereas we at least do not know how to use the brain so flexibly. This calculation also makes various assumptions, to be discussed shortly.\n\n\nOne important interpretation of the brain’s TEPS performance calculated in this way is as a lower bound on communication ability needed to simulate a brain on a computer to a level of detail that included neural connections and firing. The computer running the simulation would need to be traversing this many edges per second in the graph that represented the brain’s network of neurons.\n\n\n#### Assumptions\n\n\n##### Most relevant communication is between neurons\n\n\nThe brain could be simulated at many levels of detail. For instance, in the brain, there is both communication between neurons and communication within neurons. We are considering only communication between neurons. This means we might underestimate communication taking place in the brain.\n\n\nOur impression is that essentially all long-distance communication in the brain takes place between neurons, and that such long-distance communication is a substantial fraction of the brain’s communication. The reasons for expecting communication to be a bottleneck—that the brain spends much matter and energy on it; that it is a large cost in large computers; and that algorithms which seem similar to the brain tend to suffer greatly from communication costs—also suggest that long distance communication alone is a substantial bottleneck.\n\n\n##### Traversing an edge is relevantly similar to spiking\n\n\nWe are assuming that a computer traversing an edge in a graph (as in the TEPS benchmark) is sufficient to functionally replicate a neuron spiking. This might not be true, for instance if the neuron spike sends more information than the edge traversal. This might happen if there were more perceptibly different times each second at which the neuron could send a signal. We could usefully refine the current estimate by measuring the information contained in neuron spikes and traversed edges.[10](https://aiimpacts.org/brain-performance-in-teps/#easy-footnote-bottom-10-510 \"One author personally expects this to make a difference of less than about a factor of two. He would be surprised if action potentials transferred a lot more information than edge traversals in the TEPS benchmark. Also, in general, increasing time resolution only increases the information contained in a signal logarithmically. That is, if neurons can send signals at twice as many different times, this only adds one bit of information to their message. However we have not investigated this topic.\")\n\n\n##### Distributions of edges traversed don’t make a material difference\n\n\nThe distribution of edges traversed in the brain is presumably quite different from the one used in the TEPS benchmark. We are ignoring this, assuming that it doesn’t make a large difference to the number of edges that can be traversed. This might not be true, if for instance the ‘short’ connections in the brain are used more often. We know of no particular reason to expect this, but it would be a good thing to check in future.\n\n\n##### Graph characteristics are relevantly similar\n\n\nGraphs vary in how many nodes they contain, how many connections exist between nodes, and how the connections are distributed. If these parameters are quite different for the brain and the computers tested on the TEPS benchmark, we should be more wary interpreting computer TEPS performance as equivalent to what the brain does. For instance, if the brain consisted of a very large number of nodes with very few connections, and computers could perform at a certain level on much smaller graphs with many connections, then even if the computer could traverse as many edges per second, it may not be able to carry out the edge traversals that the brain is doing.\n\n\nHowever graphs with different numbers of nodes are more comparable than they might seem. Ten connected nodes with ten links each can be treated as one node with around ninety links. The links connecting the ten nodes are a small fraction of those acting as outgoing links, so whether the central ‘node’ is really ten connected nodes should make little difference to a computer’s ability to deal with the graph. The most important parameters are the number of edges and the number of times they are traversed.\n\n\nWe can compare the characteristics of brains and graphs in the TEPS benchmark. The TEPS benchmark uses graphs with up to 2 \\* 1012nodes,[11](https://aiimpacts.org/brain-performance-in-teps/#easy-footnote-bottom-11-510 \"According to the Graph 500, 2014 list sorted by problem scale, ‘Problem scale’ refers to base two logarithm of the number of graph vertices, and the largest problem scale is 41 (for Sequoia). 241 = 2.2 * 1012\") while the human brain has around [1011 nodes (neurons)](http://aiimpacts.org/scale-of-the-human-brain/ \"Scale of the Human Brain\"). Thus the human brain is around twenty times smaller (in terms of nodes) than the largest graphs used in the TEPS benchmark.\n\n\nThe brain contains many more links than the TEPS benchmark graphs. TEPS graphs appear to have average degree 32 (that is, each node has 32 links on average),[12](https://aiimpacts.org/brain-performance-in-teps/#easy-footnote-bottom-12-510 \"This page (section 3.4) at the Graph 500 site suggests that ‘edgefactor’ is 16 for the parameter settings they use, and that ‘edgefactor’ is half of degree. Note that our count for the ‘degree’ of a neuron also reflects both incoming and outgoing synapses.\") while the brain apparently has average degree around 3,600 – 6,400.[13](https://aiimpacts.org/brain-performance-in-teps/#easy-footnote-bottom-13-510 \"The brain has 1.8-3.2 x 10¹⁴ synapses and 1011 neurons, implying each neuron is connected to an average of 1.8-3.2 x 10¹⁴ * 2/ 1011 synapses, which is 3,600 – 6,400\")\n\n\nThe distribution of connections in the brain and the TEPS benchmark are probably different. Both are [small-world](http://en.wikipedia.org/wiki/Small-world_network) distributions, with some highly connected nodes and some sparsely connected nodes, however we haven’t compared them in depth. The TEPS graphs are produced randomly, which should be a particularly difficult case for traversing edges in them (according to our understanding). If the brain has more local connections, traversing edges in it should be somewhat easier.\n\n\nWe expect the distribution of connections to make a small difference. In general, the time required to do a [breadth first search](http://en.wikipedia.org/wiki/Breadth-first_search) depends linearly on the number of edges, and doesn’t depend on degree. The TEPS benchmark is essentially a breadth first search, so we should expect it basically have this character. However in a physical computer, degree probably matters somewhat. We expect that in practice that the cost scales with edges \\* log(edges), because the difficulty of traversing each edge should scale with log(edges) as edges become more complex to specify. A graph with more local connections and fewer long-distance connections is much like a smaller graph, so that too should not change difficulty much.\n\n\nHow many TEPS does the brain perform?\n-------------------------------------\n\n\nWe can calculate TEPS performed by the brain as follows:\n\n\n**TEPS = synapse-spikes/second in the brain**\n\n\n**= Number of synapses in the brain \\* Average spikes/second in synapses**\n\n\n≈ **Number of synapses in the brain \\* Average spikes/second in neurons**\n\n\n**= [1.8-3.2 x 10^14](http://aiimpacts.org/scale-of-the-human-brain/ \"Scale of the Human Brain\") \\* [0.1-2](http://aiimpacts.org/rate-of-neuron-firing/ \"Neuron firing rates in humans\")**\n\n\n**= 0.18 – 6.4 \\* 10^14**\n\n\nThat is, the brain performs at around 18-640 trillion TEPS.\n\n\nNote that the average firing rate of neurons is not necessarily equal to the average firing rate in synapses, even though each spike involves both a neuron and synapses. Neurons have many synapses, so if neurons that fire faster tend to have more or less synapses than slower neurons, the average rates will diverge. We are assuming here that average rates are similar. This could be investigated further.\n\n\nFor comparison, the highest TEPS performance by a computer is 2.3 \\* 10^13 TEPS (23 trillion TEPS)[14](https://aiimpacts.org/brain-performance-in-teps/#easy-footnote-bottom-14-510 \"According to the Graph 500 November 2014 rankings, Sequoia at Lawrence Livermore National Laboratory can perform at 23,751 GTEPS.\"), which according to the above figures is within the plausible range of brains (at the very lower end of the range).\n\n\nImplications\n------------\n\n\nThat the brain performs at around 18-640 trillion TEPS means that if communication is in fact a major bottleneck for brains, and also for computer hardware functionally replicating brains, then existing hardware can probably already perform at the level of a brain, or at least at one thirtieth of that level.\n\n\n### **Cost of ‘human-level’ TEPS performance**\n\n\nWe can also calculate the price of a machine equivalent to a brain in TEPS performance, given current prices for TEPS:\n\n\n**Price of brain-equivalence = TEPS performance of brain \\* price of TEPS**\n\n\n= **TEPS performance of brain/billion \\* price of GTEPS**\n\n\n**= 0.18 – 6.4 \\* 10^14/10^9 \\* [$0.26/hour](http://aiimpacts.org/cost-of-teps/ \"The cost of TEPS\")**\n\n\n**= $0.047 – 1.7 \\* 10^5/hour**\n\n\n**= $4,700 – $170,000/hour**\n\n\nFor comparison, supercomputers seem to cost around $2,000-40,000/hour to run, if we amortize their costs across three years.[15](https://aiimpacts.org/brain-performance-in-teps/#easy-footnote-bottom-15-510 \"“The K Computer in Japan, for example, cost more than $1 billion to build and $10 million to operate each year. Livermore told us it spent roughly $250 million on Sequoia.” – Ars Technica, 2012. This makes the K computer over $38,000/hour.
\n“In other UK supercomputer news today Daresbury Laboratory in Cheshire has become home to the UK’s most powerful supercomputer…The cost of this system appears to be 10 times (£37.5 million) the above mentioned grant to develop the Emerald GPU supercomputer.” – Hexus, 2012. This places Blue Joule at around $2,100/hour to run. We evaluated the costs of several other supercomputers, and they fell roughly in this range.\") So the lower end of this range is within what people pay for computing applications (naturally, since the brain appears to be around as powerful as the largest supercomputers, in terms of TEPS). The lower end of the range is still about 1.5 orders of magnitude more than what people regularly pay for labor. Though the highest paid CEOs appear to make at least $12k/hour.[16](https://aiimpacts.org/brain-performance-in-teps/#easy-footnote-bottom-16-510 \"According to Forbes, seven CEOs earn more than $50M per year. If we assume they work 80 hour weeks and take no holidays, this is around $12k/hour \")\n\n\n### **Timespan for ‘human-level’ TEPS to arrive**\n\n\n[Our best guess](http://aiimpacts.org/cost-of-teps/ \"The cost of TEPS\") is that TEPS/$ grows by a factor of ten every four years, roughly. Thus for computer hardware to compete on TEPS with a human who costs $100/hour should take about seven to thirteen years.[17](https://aiimpacts.org/brain-performance-in-teps/#easy-footnote-bottom-17-510 \"4*log(47) – 4*log(1,700)\") We are [fairly unsure](http://aiimpacts.org/cost-of-teps/ \"The cost of TEPS\") of the growth rate of TEPS however.\n\n\n\n\n---\n\n\n \n\n", "url": "https://aiimpacts.org/brain-performance-in-teps/", "title": "Brain performance in TEPS", "source": "aiimpacts.org", "source_type": "wordpress", "date_published": "2015-05-07T00:15:21+00:00", "paged_url": "https://aiimpacts.org/feed?paged=21", "authors": ["Katja Grace"], "id": "139ed809b7628d283cf366b771186f97", "summary": []} {"text": "Glial Signaling\n\nThe presence of glial cells may increase the capacity for signaling in the brain by a small factor, but is unlikely to qualitatively change the nature or extent of signaling in the brain.\n\n\nSupport\n-------\n\n\n### Number of glial cells\n\n\n[Azevado et al.](http://www.google.com/url?q=http%3A%2F%2Fwww.ncbi.nlm.nih.gov%2Fpubmed%2F19226510&sa=D&sntz=1&usg=AFrqEzcqwJNvttCpOXugbm4aGXwFzs1lvQ) physically count the number of cells in a human brain and find about 10¹¹ each of neurons and glial cells, suggesting that the number of glia is quite similar to the number of neurons.\n\n\nReferences to much larger numbers of glial cells appear to be common, but we could not track down the empirical research supporting these claims. For example the Wikipedia article on neuroglia [states](http://en.wikipedia.org/wiki/Neuroglia) “In general, neuroglial cells are smaller than neurons and outnumber them by five to ten times,” and an article about glia in Scientific American [opens](http://www.scientificamerican.com/article/the-root-of-thought-what/) “Nearly 90 percent of the brain is composed of glial cells, not neurons.” An [informal blog post](http://www.google.com/url?q=http%3A%2F%2Fneurocritic.blogspot.com%2F2009%2F09%2Ffact-or-fiction-there-ten-times-more.html&sa=D&sntz=1&usg=AFrqEzcOOa6NqYQuGpT_HmadO5ZAbFT9Mw) suggests that the factor of ten figure may be a popular myth, although that post also draws on Azevado et al. so should not be considered independent support.\n\n\n### Nature of glial signaling\n\n\n[Sandberg and Bostrom](http://www.google.com/url?q=http%3A%2F%2Fwww.fhi.ox.ac.uk%2Fbrain-emulation-roadmap-report.pdf&sa=D&sntz=1&usg=AFrqEzdz0Nu_-YYgvpIUCCdkCpuWTPVRMw) write: “…the time constants for glial calcium dynamics is generally far slower than the dynamics of action potentials (on the order of seconds or more), suggesting that the time resolution would not have to be as fine” (p. 36). This suggests that the computational role of glial cells is not too great.\n\n\n[Newman and Zahs 1998](http://www.jneurosci.org/content/18/11/4022.full.pdf) mechanically stimulate glial cells in a rat retina, and find that this stimulation results in slow-moving waves of increased calcium concentration.[1](https://aiimpacts.org/glial-signaling/#easy-footnote-bottom-1-145 \"“The resulting Ca2+ waves, traveling through astrocytes and Muller cells, were similar to those observed previously in the isolated retina (Newman and Zahs, 1997), although the propagation velocities were somewhat slower: 13.8 + 0.4 micrometers/sec (57) compared with 23.1 micrometers/sec in the isolated retina (where the bathing solution was supplemented with glutamate and ATP). In the eyecup, the largest Ca2+ waves attained a diameter of about 400 micrometers.” – Newman and Zahs 1998 \") These calcium waves had an effect on neuron activity (see figure 4 in their paper, which also provides some indication concerning the characteristic timescale). For reference, these speeds are about a million times slower than [action potential propagation](http://en.wikipedia.org/wiki/Conduction_velocity) (neuron firing). These figures support Sandberg and Bostrom’s claims, and as far as we are aware they are consistent with the broader literature on calcium dynamics.\n\n\n[Astrocytes](http://en.wikipedia.org/wiki/Astrocyte)—a type of glial cell—take in information from action potentials (from neurons).[2](https://aiimpacts.org/glial-signaling/#easy-footnote-bottom-2-145 \"“Instead of integrating membrane depolarization and hyperpolarization into action potential output, like neurons do, astrocytes sense and integrate information mainly through the generation of intracellular calcium (Ca2+) signals (Figure 1). It is now well-established that astrocytes are able to sense transmitters released by neurons and other glial cells (either astrocytes or microglia)” – Min, Santello, and Nevian, 2012\") There is [some evidence](http://www.nature.com/neuro/journal/v11/n4/full/nn0408-379.html) that a small fraction of glia can generate action potentials, though such cells are “estimated to represent 5–10% of the cells” and so unlikely to substantially change calculations based on neurons.\n\n\nIt seems possible that further study or a more comprehensive survey of the literature would reveal other high-bandwidth signaling between glial cells, or that timescale-based estimates for the bandwidth of calcium signaling are too low, but at the moment we have little reason to suspect this.\n\n\n### Energy of glial signaling\n\n\nIf glia were performing substantially more computation than neurons, we would weakly expect them to consume more (or at least comparable) energy for a number of reasons:\n\n\n* The energy demands of the brain are very significant. If glia could perform comparable computation with much lower energy, we would expect them to predominate in terms of volume, whereas this does not seem to be the case.\n* It would be surprising if different computational elements in the brain exhibited radically different efficiency.\n\n\nHowever, the majority of energy in the brain is used to maintain resting potentials and propagate action potentials, for example a popularization in Scientific American [summarizes](http://www.scientificamerican.com/article/why-does-the-brain-need-s/) “two thirds of the brain’s energy budget is used to help neurons or nerve cells “fire” or send signals.”\n\n\nAlthough we can imagine many possible designs on which glia would perform most of the information transfer in the brain while neurons provided particular kinds of special-purpose communication at great expense, this does not seem likely given our current understanding. This provides further mild evidence that the computational role of glial cells is unlikely to substantially exceed the role of neurons.\n\n", "url": "https://aiimpacts.org/glial-signaling/", "title": "Glial Signaling", "source": "aiimpacts.org", "source_type": "wordpress", "date_published": "2015-04-16T23:29:27+00:00", "paged_url": "https://aiimpacts.org/feed?paged=21", "authors": ["Katja Grace"], "id": "b51432bde55affa9f86b3ebf9bde3b62", "summary": []} {"text": "Scale of the Human Brain\n\nThe brain has about 10¹¹ neurons and 1.8-3.2 x 10¹⁴ synapses. These probably account for the majority of computationally interesting behavior.\n\n\nSupport\n-------\n\n\n#### Number of neurons in the brain\n\n\nThe number of neurons in the brain is about 10¹¹. For instance, [Azevado et al](http://www.ncbi.nlm.nih.gov/pubmed/19226510) physically counted them and found 0.6-1 \\* 10¹¹. [Eric Chudler](http://faculty.washington.edu/chudler/facts.html) has collected estimates from a range of textbooks, which estimate 1-2 x 10¹⁰ of these (10%-30%) are in the cerebral cortex.[1](https://aiimpacts.org/scale-of-the-human-brain/#easy-footnote-bottom-1-143 \"Total number of neurons in cerebral cortex = 10 billion (from G.M. Shepherd, The Synaptic Organization of the Brain, 1998, p. 6). However, C. Koch lists the total number of neurons in the cerebral cortex at 20 billion (Biophysics of Computation. Information Processing in Single Neurons, New York: Oxford Univ. Press, 1999, page 87). \")\n\n\n#### Number of synapses in the brain\n\n\nThe number of synapses in the brain is known much less precisely, but is probably about 10¹⁴. For instance [Human-memory.net](http://www.human-memory.net/brain_neurons.html) reports 10¹⁴-10¹⁵ (100 – 1000 trillion) synapses in the brain, with no citation or explanation. Wikipedia says the brain contains 100 billion neurons, with 7,000 synaptic connections each, for 7 x 10¹⁴ synapses in total, but this seems possibly in error.[2](https://aiimpacts.org/scale-of-the-human-brain/#easy-footnote-bottom-2-143 \"“The human brain has a huge number of synapses. Each of the 1011 (one hundred billion) neurons has on average 7,000 synaptic connections to other neurons. It has been estimated that the brain of a three-year-old child has about 10¹⁵ synapses (1 quadrillion). This number declines with age, stabilizing by adulthood. Estimates vary for an adult, ranging from 10¹⁴ to 5 x 10¹⁴ synapses (100 to 500 trillion).” Wikipedia accessed April 13 ’15, citing “Do we have brain to spare?“. Neurology 64 (12): 2004–5. We have not accessed most of the Drachman paper, but it does at least say “Within the liter and a half of human brain, stereologic studies estimate that there are approximately 20 billion neocortical neurons, with an average of 7,000 synaptic connections each”. This suggests that the Wikipedia page errs in attributing the 7,000 synaptic connections per neuron to the brain at large instead of the neocortex.\")\n\n\n##### Number of synapses in the neocortex\n\n\nOne way to estimate of the number of synapses in the brain is to extrapolate from the number in the neocortex. According to stereologic studies that we have not investigated, there are around 1.4 x 10¹⁴ synapses in the neocortex.[3](https://aiimpacts.org/scale-of-the-human-brain/#easy-footnote-bottom-3-143 \"“Within the liter and a half of human brain, stereologic studies estimate that there are approximately 20 billion neocortical neurons, with an average of 7,000 synaptic connections each”.”Do we have brain to spare?“. Neurology 64 (12): 2004–5. \") This is roughly consistent with [Eric Chudler’s summary of textbooks](http://faculty.washington.edu/chudler/facts.html), which gives estimates between 0.6-2.4 x 10¹⁴ for the number of synapses in the cerebral cortex.[4](https://aiimpacts.org/scale-of-the-human-brain/#easy-footnote-bottom-4-143 \"“Number of synapses in cortex = 0.15 quadrillion (Pakkenberg et al., 1997; 2003)… [the ‘cortex’ probably refers either the cerebral cortex or the neocortex, which is part of and thus should be smaller than the cerebral cortex.]
\n…Total number of synapses in cerebral cortex = 60 trillion (yes, trillion) (from G.M. Shepherd, The Synaptic Organization of the Brain, 1998, p. 6). However, C. Koch lists the total synapses in the cerebral cortex at 240 trillion (Biophysics of Computation. Information Processing in Single Neurons, New York: Oxford Univ. Press, 1999, page 87).” – Chudler, Brain facts and figures\")\n\n\nWe are not aware of convincing estimates for synaptic density outside of the cerebral cortex, and our impression is that widely reported estimates of 10¹⁴ are derived from the assumption that the neocortex contains the great bulk of synapses in the brain. This seems plausible given the large volume of the neocortex, despite the fact that it contains a minority of the brain’s neurons. By volume, around 80% of the human brain is neocortex.[5](https://aiimpacts.org/scale-of-the-human-brain/#easy-footnote-bottom-5-143 \"Dunbar references anatomical measurements from 1981 and writes “With a neocortical volume of 1006.5 cc and a total brain volume of 1251.8 cc (Stephan et al. 1981), the neocortex ratio for humans is CR = 4.1.” (p. 682).\") The neocortex also consumes around 44% of the brain’s total energy, which may be another reasonable indicator of the fraction of synapses in contains.[6](https://aiimpacts.org/scale-of-the-human-brain/#easy-footnote-bottom-6-143 \"“Thus, neocortex accounts for 44% of the brain’s overall consumption.” Lennie, 2003 (p. 495)\") So our guess is that the number of synapses in the entire brain is somewhere between 1.3 and 2.3 times the number in the cerebral cortex. From above, the cerebral cortex contains around 1.4 x 10¹⁴ synapses, so this gives us 1.8-3.2 x 10¹⁴ total synapses.\n\n\n##### Number of synapses per neuron\n\n\nThe number of synapses per neuron varies considerably. [According to Wikipedia](http://en.wikipedia.org/wiki/Cerebellum_granule_cell#cite_note-SOB-1), the majority of neurons are cerebellum granule cells, which have only a handful of synapses, while the statistics above suggest that the average neuron has around 1,000 synapses. Purkinje cells have up to 200,000 synapses.[7](https://aiimpacts.org/scale-of-the-human-brain/#easy-footnote-bottom-7-143 \"“Number of synapses made on a Purkinje cell = up to 200,000” – Chudler, Brain facts and figures\")\n\n\n#### Number of glial cells in the brain\n\n\n*Main article: [Glial signaling](http://aiimpacts.org/glial-signaling/ \"Glial Signaling\")*\n\n\n[Azevado et al](http://www.ncbi.nlm.nih.gov/pubmed/19226510) aforementioned investigation finds about 10¹¹ glial cells (the same as the number of neurons).\n\n\n#### Relevance of cells other than neurons to computations in the brain\n\n\n*Main article: [Glial signaling](http://aiimpacts.org/glial-signaling/ \"Glial Signaling\")*\n\n\nIt seems that the timescales of glial dynamics are substantially longer than for neuron dynamics. [Sandberg and Bostrom](http://www.fhi.ox.ac.uk/brain-emulation-roadmap-report.pdf) write: “However, the time constants for glial calcium dynamics is generally far slower than the dynamics of action potentials (on the order of seconds or more), suggesting that the time resolution would not have to be as fine” (p. 36). This suggests that the computational role of glial cells is not too great. References to much larger numbers of glial cells appear to be common, but we were unable to track down any empirical research supporting these claims. An [informal blog post](http://neurocritic.blogspot.com/2009/09/fact-or-fiction-there-ten-times-more.html) suggests that a common claim that there are ten times as many glial cells as neurons may be a popular myth.\n\n\nWe are not aware of serious suggestions that cells other than neurons or glia play a computationally significant role in the functioning of the brain.\n\n\n\n\n---\n\n\n \n\n", "url": "https://aiimpacts.org/scale-of-the-human-brain/", "title": "Scale of the Human Brain", "source": "aiimpacts.org", "source_type": "wordpress", "date_published": "2015-04-16T23:00:46+00:00", "paged_url": "https://aiimpacts.org/feed?paged=21", "authors": ["Katja Grace"], "id": "1d8f488f6bfe2410ecced86cf5f2ee0b", "summary": []} {"text": "Neuron firing rates in humans\n\nOur best guess is that an average neuron in the human brain transmits a spike about 0.1-2 times per second.\n\n\nSupport\n-------\n\n\n### Bias from neurons with sparse activity\n\n\nWhen researchers measure neural activity, they can fail to see neurons which rarely fire during the experiment (those with ‘sparse’ activity).[1](https://aiimpacts.org/rate-of-neuron-firing/#easy-footnote-bottom-1-142 \"Table 1 of Shoham et al. reports on a variety of investigations of sparsity in neural behavior, most of which suggest that more than 90% of neurons are sufficiently silent that they are not easily detectable. Summarizing their own results, they say “Table 1 suggests that such proportions may vary widely among different brain regions and preparations, a notion which is consistent with hierarchical, increasingly sparse neural coding schemes. Conservative estimates may, however, be possible by considering those parameters of the neuron–electrode interface that affect the detection of unit signals…suggesting a silent fraction of at least 90%.” (p. 782).Experimenters recording from a rat cortex find “Both electrical and optical recordings consistently revealed that individual neurons as well as populations of neurons display sparse spontaneous activity. Single neurons displayed low AP rates of <0.1 Hz, in agreement with previous in vivo studies.” (Kerr et al 2005)\") Preferentially recording more active neurons means overestimating average rates of firing. The size of the bias seems to be around a factor of ten: it appears that around 90% of neurons are ‘silent’, so unlikely to be detected in these kinds of experiments. This suggests that many estimates should be scaled down by around a factor of around ten.\n\n\n### **Assorted estimates**\n\n\n#### **Informal estimates**\n\n\nInformal websites and articles commonly report neurons as firing between <1 and 200 times per second.[2](https://aiimpacts.org/rate-of-neuron-firing/#easy-footnote-bottom-2-142 \"‘But generally, the range for a “typical” neuron is probably from <1 Hz (1 spike per second) to ~200 Hz (200 spikes per second).’ -‘Astra Bryant, Ask a neuroscientist! – what is the synaptic firing rate of the human brain?’
\n\n\n\n“A typical neuron fires 5 – 50 times every second.” – www.human-memory.net
\n\n\n\n“The brain can’t handle neurons firing all the time. Neurons fire around 10x per second and already the brain is consuming 20% of the body’s energy at 2% of the body’s weight.” – Paul King, computational neuroscientist, on Quora”Modern computer chips handle data at the mind-blowing rate of some 10^13 bits per second. Neurons, by comparison, fire at a rate of around 100 times per second or so. And yet the brain outperforms the best computers in numerous tasks.” – MIT Technology Review\") These sources lack references and are not very consistent, so we do not put much stock in them.\n\n\n#### **Estimates of rate of firing in human neocortex**\n\n\nBased on the energy budget of the brain, it [appears](http://aiimpacts.org/metabolic-estimates-of-rate-of-cortical-firing/) that the average cortical neuron fires around 0.16 times per second. It seems unlikely that the average cortical neuron spikes much more than once per second.\n\n\nThe neocortex is a large part of the brain. It accounts for around 80% of the brain’s volume[3](https://aiimpacts.org/rate-of-neuron-firing/#easy-footnote-bottom-3-142 \"Dunbar references anatomical measurements from 1981 and writes “With a neocortical volume of 1006.5 cc and a total brain volume of 1251.8 cc (Stephan et al. 1981), the neocortex ratio for humans is CR = 4.1.” (p. 682).\"), and uses 44% of its energy[4](https://aiimpacts.org/rate-of-neuron-firing/#easy-footnote-bottom-4-142 \"“Using the best estimate, in the normal awake state, cortex accounts for 44% of whole brain energy consumption in 200 ms, the brain’s normal energy consumption supports a strong (solid horizontal line, intercept on ordinate).” – Lennie 2003\"). It appears to hold at least a third of the brain’s synapses if not many more[5](https://aiimpacts.org/rate-of-neuron-firing/#easy-footnote-bottom-5-142 \"\n\n\n\n
“The average total number of synapses in the neocortex of five young male brains was 164 x 10(12) (CV = 0.17).” Tang et al, 2001
\n\n\n\n“Number of synapses in cortex = 0.15 quadrillion (Pakkenberg et al., 1997; 2003)” – Eric Chudler
\n\n\n\n“The human brain has a huge number of synapses. Each of the 10^11 (one hundred billion) neurons has on average 7,000 synaptic connections to other neurons. It has been estimated that the brain of a three-year-old child has about 10^15 synapses (1 quadrillion). This number declines with age, stabilizing by adulthood. Estimates vary for an adult, ranging from 10^14 to 5 x 10^14 synapses (100 to 500 trillion).” Wikipedia accessed April 13 ’15, citing Drachman, D (2005). “Do we have brain to spare?”. Neurology 64 (12): 2004–5. We have not accessed most of the Drachman paper, but it does at least say “Within the liter and a half of human brain, stereologic studies estimate that there are approximately 20 billion neocortical neurons, with an average of 7,000 synaptic connections each”. It seems improbable that the average number of synapses per neuron in the brain is the same as that in the neocortex, weakly suggesting the Wikipedia contributor made an error.
\n\n\n\nThese figures suggest that the neocortex accounts for between a third and most of synapses.\"). Thus we might use rates of firing of cortical neurons as a reasonable proxy for normal rates of neuron firing in the brain. We can also do a finer calculation.\n\n\nWe might roughly expect energy used by the brain to scale in proportion both to the spiking rate of neurons and to volume. This is because the energy required for every neuron to experience a spike scales up in proportion to the surface area of the neurons involved[6](https://aiimpacts.org/rate-of-neuron-firing/#easy-footnote-bottom-6-142 \"“The cost of propagating an action potential in an unmyelinated axon is proportional to its surface area.” – Lennie, 2003\"), which we expect to be roughly proportional to volume.\n\n\nSo we can calculate:\n\n\n**energy(cortex) = volume(cortex) \\* spike\\_rate(cortex) \\* c**\n\n\n**energy(brain) = volume(brain) \\* spike\\_rate(brain) \\* c**\n\n\nFor *c* a constant.\n\n\nThus,\n\n\n**energy(cortex)/energy(brain) = volume(cortex) \\* spike\\_rate(cortex)/volume(brain) \\* spike\\_rate(brain)**\n\n\nFrom figures given above then, we can estimate:\n\n\n**0.44 = 0.8 \\* 0.16/spike\\_rate(brain)**\n\n\n**spike\\_rate(brain) = 0.8 \\* 0.16 /0.44 = 0.29**\n\n\nOr for a high estimate:\n\n\n**0.44 = 0.8 \\* 1/spike\\_rate(brain)**\n\n\n**spike\\_rate(brain) = 0.8 \\* 1 /0.44 = 1.82**\n\n\nSo based on this rough extrapolation from neocortical firing rates, we expect average firing rates across the brain to be around 0.29 per second, and probably less than 1.82 per second. This has been a very rough calculation however, and we do not have great confidence in these numbers.\n\n\n#### **Estimates of rate of firing in non-human visual cortex**\n\n\n[A study](http://www.ncbi.nlm.nih.gov/pmc/articles/PMC1688734/pdf/9447735.pdf) of macaque and cat visual cortex found rates of neural firing averaging 3-4 spikes per second for cats in different conditions, and 14-18 spikes per second for macaques. A past study found 9 spikes per second for cats.[7](https://aiimpacts.org/rate-of-neuron-firing/#easy-footnote-bottom-7-142 \"“spikes were recorded while a given video sequence representative of natural scenes was played. Data were collected from three cats, and two macaques. The cats were anaesthetized and the macaques were awake and free viewing. Only visually responsive cells were used… For V1 of the anaesthetized cats, the firing rates for the video-stimulated neurons were low (mean = 3.96Hz, s.d. = 3.61Hz). This was lower than has been previously reported (Legendy & Salcman 1985) for the unanaesthetized cat (mean = 8.9 Hz, s.d. = 7.0 Hz), but was significantly higher than when the cells were stimulated with high contrast white noise (mean = 2.45Hz, s.d. = 2.18 Hz). It is proposed that the low average rates were partly due to the effect of the anaesthetic (which could be tested by systematically varying its level). For the macaque IT cells, generally in the upper bank of the superior temporal sulcus at sites similar to those in (Rolls & Tovee 1995), the average rate was higher for both video stimulation (mean = ˆ18 Hz, s.d.ˆ =10.3 Hz), and blank screen viewing (meanˆ = 14 Hz, s.d.ˆ= 8.3 Hz.)” Baddeley et al 1997 (p. 1776)\") It is hard to know how these estimates depend on the region being imaged and on the animal being studied, which significantly complicates extracting conclusions from these results. Furthermore, these studies appear to be subject to the bias discussed above, from only sampling visually responsive cells. Thus they probably overestimate overall neural activity by something like a factor of ten. This suggests figures in the 0.3-1.8 range, consistent with estimates from the neocortex. Note that the visual cortex [is part of](http://en.wikipedia.org/wiki/Neocortex) the neocortex, so this increases our confidence in our estimates for that, without reducing our uncertainty about the rest of the brain.\n\n\n### **Maximum neural firing rates**\n\n\nThe *‘refractory period’* for a neuron is the time after it fires during which it either can’t fire again (*‘absolute refractory period’*) or needs an especially large stimulus to fire again (*‘relative refractory period’*). According to [physiologyweb.com](http://www.physiologyweb.com/lecture_notes/neuronal_action_potential/neuronal_action_potential_refractory_periods.html), absolute refractory periods tend to be 1-2ms and relative refractory periods tend to be 3-4ms.[8](https://aiimpacts.org/rate-of-neuron-firing/#easy-footnote-bottom-8-142 \"Therefore, it takes about 3-4 ms for all Na+ channels to come out of inactivation in order to be ready for activation (opening) again. The period from the initiation of the action potential to immediately after the peak is referred to as the absolute refractory period (ARP) (see Figs. 1 and 2). This is the time during which another stimulus given to the neuron (no matter how strong) will not lead to a second action potential. Thus, because Na+ channels are inactivated during this time, additional depolarizing stimuli do not lead to new action potentials. The absolute refractory period takes about 1-2 ms…
\n\n\n\n…During the absolute refractory period, a second stimulus (no matter how strong) will not excite the neuron. During the relative refractory period, a stronger than normal stimulus is needed to elicit neuronal excitation.After the absolute refractory period, Na+channels begin to recover from inactivation and if strong enough stimuli are given to the neuron, it may respond again by generating action potentials. However, during this time, the stimuli given must be stronger than was originally needed when the neuron was at rest. This situation will continue until all Na+ channels have come out of inactivation. The period during which a stronger than normal stimulus is needed in order to elicit an action potential is referred to as the relative refractory period (RRP).\") This implies than neurons are generally not capable of firing at more than 250-1000 Hz. This is suggestive, however the site does not say anything about the distribution of maximum firing rates for different types of neurons, so the mean firing rate could in principle be much higher.\n\n\n**Conclusions**\n---------------\n\n\nInformal estimates place neural firing rates in the <1-200Hz range. Estimates from energy use in the neocortex suggests a firing rate of 0.16Hz in the neocortex, which suggests around 0.29Hz in the entire brain, and probably less than 1.8Hz, though we are not very confident in our estimation methodology here. We saw animal visual cortex firing rates in the 3-18Hz range, but these are probably an order of magnitude too high due to bias from recording active neurons, suggesting real figures of 0.3-1.8 Hz, which is consistent with the estimates from the neocortex previously discussed. Neuron refractory periods (recovery times) suggest 1000Hz is around as fast as a normal neuron can possibly fire. Combined with the observation that 90% of neurons rarely fire, this suggests 100Hz as a high upper bound on the average firing rate. However this does not tell us about unusual neurons, of which there might be many.\n\n\nSo we have two relatively weak lines of reasoning suggesting average firing rates of around 0.1Hz-2Hz. These estimates are low compared to the range of informal claims. However the informal claims appear to be unreliable, especially given that two are higher than our upper bound on neural firing rates (though these are also unreliable). 0.1-2Hz is also low compared to these upper bounds, as it should be. Thus our best guess is that neurons fire at 0.1-2Hz on average.\n\n\nNotes\n-----\n\n", "url": "https://aiimpacts.org/rate-of-neuron-firing/", "title": "Neuron firing rates in humans", "source": "aiimpacts.org", "source_type": "wordpress", "date_published": "2015-04-14T18:57:50+00:00", "paged_url": "https://aiimpacts.org/feed?paged=21", "authors": ["Katja Grace"], "id": "610a1b9056ad77a849d59b693ab99fb7", "summary": []} {"text": "Metabolic Estimates of Rate of Cortical Firing\n\nCortical neurons are estimated to spike around 0.16 times per second, based on the amount of energy consumed by the human neocortex.[1](https://aiimpacts.org/metabolic-estimates-of-rate-of-cortical-firing/#easy-footnote-bottom-1-144 \"The article alternates between ‘cortex’ and ‘neocortex’ in a way that suggests they refer to the same, though we are not sure that this is common usage. For instance, on page 494 the article refers to a table entitled ‘Basic statistics of the human neocortex’ to learn about the ‘cortex’.\") They seem unlikely to spike much more than once per second on average, based on this analysis.\n\n\nSupport\n-------\n\n\n### Energy spent on spiking\n\n\n[Lennie 2003](http://www.bcs.rochester.edu/people/plennie/pdfs/Lennie03a.pdf) estimates the rate of neuron firing in the cortex based on estimates for energy spent on Na/K ion pumps during spikes, and the energy required by Na/K ion pumps per spike.\n\n\nLennie produces estimates for energy consumed in three parts:\n\n\n* **Estimates for adenosine triphosphate (ATP) molecules consumed by the neocortex**: According to brain scans, glucose is metabolized at a rate of about 0.40 micro mol/g/min. Each glucose molecule yields around 30 molecules of ATP. This suggests that the entire cortex consumes 3.4 \\* 10²¹ molecules of ATP per minute.[2](https://aiimpacts.org/metabolic-estimates-of-rate-of-cortical-firing/#easy-footnote-bottom-2-144 \"“Positron emission tomography (PET) and Magnetic Resonance Spectroscopy (MRS) measurements of glucose metabolism in human cortex show overall resting consumption of about 0.40 micro mol/g/min [10–12]. Assuming a yield of 30 ATP per molecule of glucose [13], this would give rise to 12 micro mol ATP/g/min. With 1 cm3 of cortex weighing 1 g [14], from Table 1, the cortical mass is 475 g, resulting in a gross consumption of 3.4 * 10²¹ molecules of ATP per minute.” – Lennie 2003 (p494) \") Note that ATP’s function is as energy source, so this is a measure of how much energy the neocortex uses.\n* **Estimates for the fraction of this ATP used to maintain ion balances**: If you inactivate Na/K ion pumps with the drug ouabain, this reduces energy consumption by 50%, suggesting that these ion pumps use about half of the cortex’s energy. [3](https://aiimpacts.org/metabolic-estimates-of-rate-of-cortical-firing/#easy-footnote-bottom-3-144 \"“The principal cost of restoring and maintaining ionic balances can be estimated from the decrease in energy consumption brought about by inactivating the Na/K pump with ouabain or an equivalent agent. Doing this reduces overall energy consumption by about 50%.”- Lennie 2003\") This gives us 1.7 \\* 10²¹ molecules of ATP per minute being used to maintain ion balances.\n* **Estimates for the fraction of ion balancing ATP used in spikes**: Maintaining resting potentials (not part of spiking) in all neurons costs 1.3 x 10²¹ ATP molecules per minute. This leaves 3.9 \\* 10²⁰ ATP per minute for spiking.[4](https://aiimpacts.org/metabolic-estimates-of-rate-of-cortical-firing/#easy-footnote-bottom-4-144 \"“the cost of maintaining resting potentials in all neurons and glia is 1.3 * 10²¹ ATP molecules per minute, leaving 3.9 * 10²⁰ per minute to support ionic movements associated with spikes,” i.e. that about 23% of energy is used for spiking.- Lennie 2003\")\n\n\nHowever, other authors report higher fractions of cortical energy are spent on spiking. [Laughlin 2001](http://uploads.tombertalan.com/13fall2013/501Aneu501A/hw/hw6/others/Laughlin-2001-CurrOpinNeuro.pdf) writes that spiking accounts for 80% of total energy consumption in mammalian cortex.[5](https://aiimpacts.org/metabolic-estimates-of-rate-of-cortical-firing/#easy-footnote-bottom-5-144 \"“For a mammalian brain… recent studies in NMR spectroscopy, which associate energy usage with neural function by following the turnover of identified metabolites and neurotransmitters, suggest that signaling accounts for 80% of the total consumption in cortex…Maintaining resting potentials and counteracting leakage from organelles accounts for less than 15% of the total consumption.”(p. 475)\") Other work by Laughlin and Attwell, which is a primary source for Lennie’s estimates, [reports](http://apps.webofknowledge.com/InboundService.do?UT=000171432300001&IsProductCode=Yes&mode=FullRecord&SID=2BGqCCCtS2EraP7OEQa&product=WOS&smartRedirect=yes&SrcApp=literatum&DestFail=http%3A%2F%2Fwww.webofknowledge.com%3FDestApp%3DCEL%26DestParams%3D%253Faction%253Dretrieve%2526mode%253DFullRecord%2526product%253DCEL%2526UT%253D000171432300001%2526customersID%253Datyponcel%26e%3D3WVyiuw2sBSOd7GLNSrxGn0O4OxdNDA5mYe7CY7nD5EW1pzAsO6Um4lIk4sEfDmD%26SrcApp%3Dliteratum%26SrcAuth%3Datyponcel&Init=Yes&action=retrieve&customersID=atyponcel&Func=Frame&SrcAuth=atyponcel) that spiking consumes around 47% of energy.[6](https://aiimpacts.org/metabolic-estimates-of-rate-of-cortical-firing/#easy-footnote-bottom-6-144 \"“Action potentials and postsynaptic effects of glutamate are predicted to consume much of the energy (47% and 34%, respectively).”\")\n\n\nOur understanding is that the difference can be attributed to differences between the rodent brain and the human brain, and the scaling estimates from one to the other. We are not particularly confident in this methodology.\n\n\n### Energy per spike\n\n\nAccording to Lenny, each spike consumes around 2.4 \\* 10⁹ molecules of ATP.[7](https://aiimpacts.org/metabolic-estimates-of-rate-of-cortical-firing/#easy-footnote-bottom-7-144 \"“A spike consumes 2.4 109 molecules of ATP.” – Lennie 2003 (p494)\") This estimate is produced by scaling up estimates for the rat brain.[8](https://aiimpacts.org/metabolic-estimates-of-rate-of-cortical-firing/#easy-footnote-bottom-8-144 \"“Neurons in human neocortex are larger than those in rat and receive and make more synapses, but they are not otherwise known to differ in their basic structure or organization. Thus, with appropriate scaling of parameters for the larger neurons, Attwell and Laughlin’s analysis can be used to estimate the energy consumed by a pyramidal neuron in human neocortex.”\") The estimates for the rat brain were inferred from ‘anatomic and physiologic data’, which we have not scrutinized.[9](https://aiimpacts.org/metabolic-estimates-of-rate-of-cortical-firing/#easy-footnote-bottom-9-144 \"“Anatomic and physiologic data are used to analyze the energy expenditure on different components of excitatory signaling in the grey matter of rodent brain…
\n…Thus, the minimum Na+ influx to initiate the action potential and propagate it is 2.88 × 10⁸ Na+ (if dendrite depolarization were due to entry of Ca2 + instead of Na+ , with each Ca2 + extruded in exchange for 3 Na+ , this figure would increase by 6.8%). A realistic estimate of the Na+ entry needed is obtained by quadrupling this to take account of simultaneous activation of Na+ and K+ channels (Hodgkin, 1975), resulting in 11.5 × 10⁸ Na+ which have to be pumped out again, requir- ing 3.84 × 10⁸ ATP molecules to be hydrolyzed (Figs. 1B, 2, and 3). This 4-fold increase is validated by calculations by A. Roth and M. Hausser (as in Vetter et al., 2001), based on cell morphology and ionic current properties, which give ATP values of 3.3 × 10⁸ for a cortical pyramidal cell with a myelinated axon, and 5.4 × 10⁸ for a hippocampal pyramidal cell with an unmyelinated axon, similar to the estimate made above.” Attwell and Laughlin 2001 (pdf download)\") We are not particularly confident in this scaling methodology. These estimates appear to be produced by counting ion channels and applying detailed knowledge of the mechanics of ion channels (which consume a roughly fixed amount of ATP per transported molecule).\n\n\n### Spikes per neuron per second\n\n\nWe saw above that the cortex uses 3.9 \\* 10²⁰ ATP/minute for spiking, and that each spike consumes around 2.4 \\* 10⁹ molecules of ATP. So the cortex overall has around 2.7 \\* 10⁹ spikes per second. There are 1.9 \\*10¹⁰ neurons in the cortex, so together we can calculate that these neurons produce around 0.16 spikes per second on average.[10](https://aiimpacts.org/metabolic-estimates-of-rate-of-cortical-firing/#easy-footnote-bottom-10-144 \"“From the previous section, reversing the Na+ and K+ fluxes moved by a single spike consumes 2.2 * 10⁹ ATP molecules. Given this, and 1.9 * 10¹⁰cortical neurons, the ATP available for the Na/K pump would support an average discharge rate of 0.16 spikes/s/neuron.” – Lennie 2003 (p494). That is, 3.9*10²⁰ ATP/minute/(60 seconds/ minute * 2.2* 10⁹ ATP/spike * 1.9 * 10¹⁰ neurons = 0.16 spikes/neuronsecond). Note that Lenny uses 2.2* 10⁹ ATP/spike here though he earlier said 2.4* 10⁹ ATP/spike. This inconsistency appears to be an error, but a small one).\")\n\n\nEven assuming that essentially all of the energy in the brain is spent on signaling, this would introduce a bias of only a factor of 8 in Lennie’s estimates. On page S1 Lennie presents an analysis of other possible sources of error, and overall it seems unlikely to us that the estimate is too low by more than an order of magnitude or so.\n\n\n \n\n\n\n\n---\n\n\n \n\n", "url": "https://aiimpacts.org/metabolic-estimates-of-rate-of-cortical-firing/", "title": "Metabolic Estimates of Rate of Cortical Firing", "source": "aiimpacts.org", "source_type": "wordpress", "date_published": "2015-04-10T17:47:11+00:00", "paged_url": "https://aiimpacts.org/feed?paged=21", "authors": ["Katja Grace"], "id": "31881881d4fbad5f5e6d979c0d1c8766", "summary": []} {"text": "Preliminary prices for human-level hardware\n\n*By Katja Grace, 4 April 2015*\n\n\nComputer hardware has been getting cheap now for about [seventy five years](http://aiimpacts.org/trends-in-the-cost-of-computing/ \"Trends in the cost of computing\"). Relatedly, large computing projects can afford to be [increasingly large](http://en.wikipedia.org/wiki/TOP500#/media/File:Supercomputers-history.svg). If you think the human brain is something like a really impressive computer[1](https://aiimpacts.org/preliminary-prices-for-human-level-hardware/#easy-footnote-bottom-1-490 \"The extent and nature of the brain’s resemblance to a really impressive computer is an important question that we hope to discuss another time. For now, we shall see what this assumption implies, and whether it is worth resolving more nebulous problems for.\"), then a natural question is ‘what happens when big projects can afford to use as much computation as the brain?’\n\n\nOne possibility is that we get something like human-level AI then and there. Maybe the brain just uses easy algorithmic ideas, and as soon as someone gets enough hardware together and tries a bit on the brain-like software, the creation will be about as good as a human brain.\n\n\nAnother possibility is that sufficient hardware to simulate a brain is basically irrelevant. On this story, the brain has big algorithmic secrets we don’t know about, and it would take unimaginable warehouses of hardware to replace these insights with brute force computation.\n\n\nMost possibilities lie somewhere between these two, where hardware and software are both somewhat helpful. In these cases, knowing when we will have enough hardware to run a brain isn’t everything, but is informative. For more discussion of how to model this situation, see our [older post](http://aiimpacts.org/how-ai-timelines-are-estimated/ \"How AI timelines are estimated\").\n\n\nThere doesn’t seem to be consensus on how important hardware is. But given the range of possibilities, whenever ‘human-level hardware’ arrives seems like a disproportionately likely time for human-level AI to arrive.\n\n\nFor this reason, we want to know when this human-level hardware point is. Which means we want to know the price of hardware, how fast that price is falling, how much hardware you need to do what the human brain does, and how much anyone is likely to pay for that. Ideally, we would like a few relatively independent estimates of several of these things.\n\n\nWe’ve just been checking [the](http://aiimpacts.org/cost-of-teps/ \"The cost of TEPS\") [prices](http://aiimpacts.org/current-flops-prices/ \"Current FLOPS prices\"), and [price trends](http://aiimpacts.org/trends-in-the-cost-of-computing/ \"Trends in the cost of computing\"), so this seems like a good time to pause and see what they imply when combined with some existing estimates of the brain’s computational requirements. Later we will explore these estimates in more detail, and hopefully add at least one based on measuring [TEPS](http://aiimpacts.org/cost-of-teps/ \"The cost of TEPS\").\n\n\n[Moravec](http://www.scientificamerican.com/article/rise-of-the-robots/) estimates that the brain performs around 100 million MIPS.[2](https://aiimpacts.org/preliminary-prices-for-human-level-hardware/#easy-footnote-bottom-2-490 \"” it would take, in round numbers, 100 million MIPS (100 trillion instructions per second) to emulate the 1,500-gram human brain.” – Moravec, 2009\") MIPS are not directly comparable to MFLOPS (millions of FLOPS), and [have deficiencies](http://www.econ.yale.edu/~nordhaus/homepage/prog_083001a.pdf) as a measure, but the empirical relationship in computers is something like MFLOPS = 2.3 x MIPS0.89, according to [Sandberg and Bostrom](http://www.fhi.ox.ac.uk/brain-emulation-roadmap-report.pdf) (2008).[3](https://aiimpacts.org/preliminary-prices-for-human-level-hardware/#easy-footnote-bottom-3-490 \"See p89. It actually says FLOPS not MFLOPS, but this appears to be an error, given the graph.\") This suggests Moravec’s estimate coincides with around 3.0 x 10¹³ FLOPS. Given that an order of magnitude increase in computing power per dollar [corresponds to](http://aiimpacts.org/trends-in-the-cost-of-computing/) about four years of time, knowing that MFLOPS and MIPS are roughly comparable is plenty of precision.\n\n\nWe [estimated](http://aiimpacts.org/current-flops-prices/ \"Current FLOPS prices\") FLOPShours cost around $10-13 each. Thus if we want to run a brain, putting these figures together, it would cost us around $3/hour!\n\n\nThat is, if Moravec’s estimate was right, and my conversion of it to FLOPS was basically right, and [our prices](http://aiimpacts.org/current-flops-prices/ \"Current FLOPS prices\") were right, and hardware mattered a lot more than software, we would already be in the robot revolution.[4](https://aiimpacts.org/preliminary-prices-for-human-level-hardware/#easy-footnote-bottom-4-490 \"Humans who cost $100/hour would have become more expensive than the equivalent hardware in about 2009: an hour is currently factor of 30 cheaper than $100, or 1.5 factors of ten, which corresponds to about six years of progress in hardware price performance.\") How informative!\n\n\nOur prices are pretty consistent with the latest extrapolation in Moravec’s [1997 graph](http://www.transhumanist.com/volume1/moravec.htm) (see Figure 1).[5](https://aiimpacts.org/preliminary-prices-for-human-level-hardware/#easy-footnote-bottom-5-490 \"In 2015, it appears to be at around 2.3 million MIPS/$1000, which is around 1M MFLOPS/$1000 according to Sandberg and Bostrom’s conversion, which is $1 per GFLOP. Our estimate was $3/GFLOP.\") However his graph doesn’t reach human-equivalence until around 2020, and he predicts such computers appear around then.[6](https://aiimpacts.org/preliminary-prices-for-human-level-hardware/#easy-footnote-bottom-6-490 \"‘At the present rate, computers suitable for humanlike robots will appear in the 2020s.’ –Moravec\") This difference from our reading of his figures is because his graph is of what can be bought with $1,000, whereas we expect someone would build an AI by the time it cost around $1M at the latest.[7](https://aiimpacts.org/preliminary-prices-for-human-level-hardware/#easy-footnote-bottom-7-490 \"A computer that lasts for three years and runs a human replacement who can work for around $50/hour should be worth around $1M.\") So our threshold of ‘affordable’ is three orders of magnitude more expensive than his, and thus a bit over a decade earlier. This seems to be a disagreement about at what price it becomes economically viable to replace a human, but we do not understand his position[8](https://aiimpacts.org/preliminary-prices-for-human-level-hardware/#easy-footnote-bottom-8-490 \"‘By our estimate, today’s very biggest supercomputers are within a factor of a hundred of having the power to mimic a human mind. Their successors a decade hence will be more than powerful enough. Yet, it is unlikely that machines costing tens of millions of dollars will be wasted doing what any human can do, when they could instead be solving urgent physical and mathematical problems nothing else can touch. Machines with human-like performance will make economic sense only when they cost less than humans, say when their “brains” cost about $1,000. When will that day arrive?’ – Moravec\") well. A ‘brain’ that costs $1000, and runs for a few years, lets say doing useful work for only 40h/week, is costing $0.16/hour! Yet it can earn at least several hundred times more than that. There are other costs to laboring than having a virtual brain, but not that many.\n\n\n[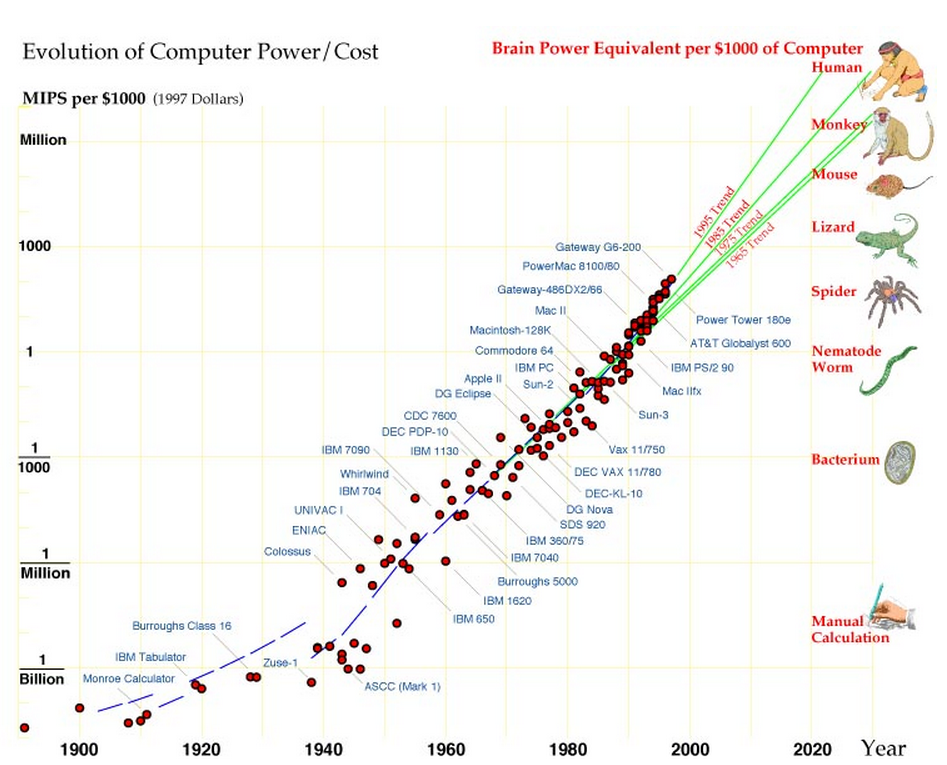](http://aiimpacts.org/wp-content/uploads/2015/04/moravecevolutionofcpc-copy.png)**Figure 1**: The growth of cheap MIPS, from [Moravec](http://www.transhumanist.com/volume1/moravec.htm).\nIncidentally, by 2009, [Moravec](http://www.scientificamerican.com/article/rise-of-the-robots/) lengthened his prediction to 20-30 years to ‘close the gap’, seemingly due to cost reductions abating since 1990.[9](https://aiimpacts.org/preliminary-prices-for-human-level-hardware/#easy-footnote-bottom-9-490 \"“Since 1990 cost and size reductions have abated, but power has risen to about 10,000 MIPS for a home computer. At the present pace, only about 20 or 30 years will be needed to close the gap…It suggests that robot intelligence will surpass our own well before 2050.”- Moravec, 2009\") We don’t know of evidence of this slowing however, and as mentioned, it seems recent hardware prices are in line with his earlier estimates.\n\n\nMoravec’s is not the only estimate of computation done by the brain. [Sandberg and Bostrom](http://www.fhi.ox.ac.uk/brain-emulation-roadmap-report.pdf) (2008) project the processing required to emulate a human brain at different levels of detail.[10](https://aiimpacts.org/preliminary-prices-for-human-level-hardware/#easy-footnote-bottom-10-490 \"From Sandberg and Bostrom, table 9: Processing demands (emulation only, human brain)(p80):
\n- \n
- spiking neural network: 10¹⁸ FLOPS (Earliest year, $1 million: commodity computer estimate: 2042, supercomputer estimate: 2019) \n
- electrophysiology: 10²² FLOPS (Earliest year, $1 million: commodity computer estimate: 2068, supercomputer estimate: 2033) \n
- metabolome: 10²⁵ FLOPS (Earliest year, $1 million: commodity computer estimate: 2087, supercomputer estimate: 2044) \n
Titan also uses 13% of its hardware costs in energy over three years. Titan cost about $4000 dollars per hour amortized over 3 years, and consumes about 10M watts, at a cost of $500 per hour (assuming $0.05 per kWh), which is also 13% of its hardware cost.\")\n\n\n### FLOPS measurements\n\n\nWe are interested in empirical performance figures from benchmark tests, but often the only data we could find was for theoretical maximums. We try to use figures for [LINPACK](http://en.wikipedia.org/wiki/LINPACK_benchmarks) and sometimes for [DGEMM](http://matthewrocklin.com/blog/work/2012/10/29/Matrix-Computations/) benchmarks, depending on which are available. [LINPACK relies heavily on DGEMM](http://en.wikipedia.org/wiki/Basic_Linear_Algebra_Subprograms), suggesting DGEMM is fairly comparable.[2](https://aiimpacts.org/current-flops-prices/#easy-footnote-bottom-2-477 \"For instance, this presentation (page ‘Results on a single node’) reports Linpack performance of 95% and 89% of DGEMM performance for their hardware in two tests.\")\n\n\nPrices\n------\n\n\n### Graphics processing units (GPUs) and Xeon Phi machines\n\n\nWe collected performance and price figures from Wikipedia[3](https://aiimpacts.org/current-flops-prices/#easy-footnote-bottom-3-477 \"Wikipedia pages: Xeon Phi, List of Nvidia Graphics Processing Units, List of AMD Graphics Processing Units
\nOther sources are visible in the last column of our dataset (see ‘Wikipedia GeForce, Radeon, Phi simplified’ sheet)\"), which are available [here](https://docs.google.com/spreadsheets/d/1yqX2cENwkOxC26wV_sBOvV0NxHzzfmL6tU7StzrFXRc/edit?usp=sharing) (see ‘Wikipedia GeForce, Radeon, Phi simplified’). These are theoretical performance figures, which we understand to generally be between somewhat optimistic and ten times too high. So this data suggests real prices of around $0.03-$0.3/GFLOPS. We collected both single and double precision figures, but the cheapest were similar.\n\n\nNote that GPUs are typically significantly restricted in the kinds of applications they can run efficiently; this performance is achieved for highly regular computations that can be carried out in parallel throughout a GPU (of the sort that are required for rendering scenes, but which have also proved useful in scientific computing). Xeon Phi units are similar to GPUs, and have broader application,[4](https://aiimpacts.org/current-flops-prices/#easy-footnote-bottom-4-477 \"“Since it was originally based on an earlier GPU design by Intel, it shares application areas with GPUs.[citation needed] The main difference between Xeon Phi and a GPGPU like Nvidia Tesla is that Xeon Phi, with an x86-compatible core, can, with less modification, run software that was originally targeted at a standard x86 CPU.” – Wikipedia\") but in this dataset were not among the cheapest machines.\n\n\n### Central processing units (CPUs)\n\n\nWe looked at a small number of popular CPUs on Geekbench from the past five years, and found the cheapest to be around $0.71/GFLOPS.[5](https://aiimpacts.org/current-flops-prices/#easy-footnote-bottom-5-477 \"See ‘Geekbench 4 History’ tab\") However there appear to be 5x disparities between different versions of Geekbench, so we do not trust these numbers a great deal (these figures are from the version we have seen to give relatively high performance figures, and thus low implied prices).\n\n\nWe did not investigate these numbers in great depth, or search far for cheaper CPUs, because CPUs seem to be expensive relative to GPUs, and this minimal investigation, plus our previous investigation in 2015, support this.\n\n\n### Computing as service\n\n\nAnother way to purchase FLOPS is via virtual computers.\n\n\nAmazon [Elastic Cloud Compute](http://en.wikipedia.org/wiki/Amazon_Elastic_Compute_Cloud) (EC2) is a major seller of virtual computing. Based on their [current pricing](https://aws.amazon.com/ec2/pricing/), as of October 5th, 2017, renting a [c4.8xlarge](https://aws.amazon.com/ec2/instance-types/) instance [costs](https://aws.amazon.com/ec2/pricing/) $0.621 per hour (if you purchase it for three years, and pay upfront).\n\n\nAccording to [a Geekbench report](http://browser.primatelabs.com/geekbench3/1694602) from 2015, a c4.8xlarge instance [delivers](http://browser.primatelabs.com/geekbench3/1694602) around 97.5 GFLOPS.[6](https://aiimpacts.org/current-flops-prices/#easy-footnote-bottom-6-477 \" Geekbench Browser allows users to measure performance in FLOPS using a variety of tasks. 97.5 is the multi-core DGEMM score a user reported for c4.8xlarge. We use a multi-core score because the cost cited is for purchasing all of the cores. On other tasks, Geekbench reports scores from 46 to 199 GFLOPS.\") We do not know if ‘c4.8xlarge’ referred to the same computing hardware in 2015, and we do know that the current version of Geekbench gives substantially different answers to the one in use here. However we estimate that the hardware should be less than twice as good as it was, and Geekbench seems unlikely to underestimate performance by more than an order of magnitude.\n\n\nThis implies that a GFLOPShour costs $6.3 x 10⁻³ , or optimistically as little as $3.2 x 10⁻⁴ . This is much higher than a GPU, at $3.4 x 10⁻⁶ for a GFLOPShour, if we suppose the hardware is used over around three years. Amazon is probably not the cheapest provider of cloud computing, however the difference seems to be something like a factor of two,[7](https://aiimpacts.org/current-flops-prices/#easy-footnote-bottom-7-477 \"We wrote in 2015: “Other sources of virtual computing seem to be similarly priced. An informal comparison of computing providers suggests that on a set of “real-world java benchmarks” three providers are quite closely comparable, with all between just above Amazon’s price and just under half Amazon’s price for completing the benchmarks, across different instance sizes. This analysis also suggests Amazon is a relatively costly provider…”\") which is not enough to make cloud computing competitive with GPUs.\n\n\nIn sum, virtual computing appears to cost two to three orders of magnitude more than GPUs. This high price is presumably partly because there are non-hardware costs which we have not accounted for in the prices of buying hardware, but are naturally included in the cost of renting it. However it is unlikely that these additional costs make up a factor of one hundred to one thousand, so cloud computing does not seem competitive.\n\n\n### Supercomputing\n\n\nA top supercomputer can perform a GFLOPS for around $3, in 2017. (See *[Price performance trend in top supercomputers](http://aiimpacts.org/price-performance-trend-in-top-supercomputers/))*\n\n\n### Tensor processing units (TPUs)\n\n\n[Tensor processing units](https://en.wikipedia.org/wiki/Tensor_processing_unit) appear to perform a GFLOPS for around $1, in February 2018. However it is unclear how this GFLOPS is measured, which makes it somewhat harder to compare (e.g. whether it is single precision or double precision). Such a high price is also at odds with rumors we have heard that TPUs are an especially cheap source of computing, so possibly TPUs are more efficient for a particular set of applications other than the ones where most of these machines have been measured.\n\n\nFurther considerations\n----------------------\n\n\nIn 2015, we estimated GPUs to cost around $3/GFLOPS, i.e. 10-100 times more than we would currently estimate. We do not believe that there has been nearly that much improvement in the past two years, so this discrepancy must be due to error and noise. We remain uncertain about the source of all of the difference, so until we resolve that question, it is plausible that our current GPU estimate errs. If so, the price should still be no higher than $3/GFLOPS (our previous estimate, and our current estimate for supercomputer prices).\n\n\nSummary\n-------\n\n\nThe lowest estimated GFLOPS prices we know of are $0.03-$3/GFLOPS, for GPUs and TPUs.\n\n\nThis is a summary of all of the prices we found:\n\n\n\n\n\n| Type of computer | Source | Type of performance | Current price ($/GFLOPS) | Comments |\n| --- | --- | --- | --- | --- |\n| GPUs and Xeon Phi (single precision) | Wikipedia | Theoretical peak | .03-0.3 | $0.03/GFLOPS is given, but is underestimate |\n| GPUs and Xeon Phi (double precision) | Wikipedia | Theoretical peak | 0.3-0.8 | Upward sloping; probably not optimized for (in GPUs) |\n| Cloud | Amazon EC2 and Geekbench | Empirical | 158 | Expensive so less relevant; shallow investigation |\n| Supercomputing | Top500 and misc prices | Empirical | 2.94 | Expensive, so less relevant; shallow investigation |\n| CPUs | Geekbench and misc prices | Empirical | 0.71 | Unreliable, 5x disagreements between Geekbench versions |\n| TPUs | Google Cloud Platform Blog | Unclear | 0.95 | |\n\n\n\n\n\nNotes\n-----\n\n", "url": "https://aiimpacts.org/current-flops-prices/", "title": "Current FLOPS prices", "source": "aiimpacts.org", "source_type": "wordpress", "date_published": "2015-04-02T05:16:13+00:00", "paged_url": "https://aiimpacts.org/feed?paged=22", "authors": ["Katja Grace"], "id": "b1551f6d6071b2e788319e84e7ae723e", "summary": []}
{"text": "The cost of TEPS\n\nA billion [Traversed Edges Per Second](http://en.wikipedia.org/wiki/Traversed_edges_per_second) (a [G](http://en.wikipedia.org/wiki/Giga-)TEPS) can be bought for around $0.26/hour via a powerful supercomputer, including hardware and energy costs only. We do not know if GTEPS can be bought more cheaply elsewhere.\n\n\nWe estimate that available TEPS/$ grows by a factor of ten every four years, based the relationship between TEPS and FLOPS. TEPS have not been measured enough to see long-term trends directly.\n\n\nBackground\n----------\n\n\nTraversed edges per second ([TEPS](http://en.wikipedia.org/wiki/Traversed_edges_per_second)) is a measure of computer performance, similar to [FLOPS](http://en.wikipedia.org/wiki/FLOPS) or [MIPS](http://en.wikipedia.org/wiki/Instructions_per_second#Millions_of_instructions_per_second). Relative to these other metrics, TEPS emphasizes the communication capabilities of machines: the ability to move data around inside the computer. Communication is especially important in very large machines, such as supercomputers, so TEPS is particularly useful in evaluating these machines.\n\n\nThe [Graph 500](http://www.graph500.org/results_nov_2013) is a list of computers which have been evaluated according to this metric. It is [intended](http://www.graph500.org/) to complement the [Top 500](http://www.top500.org/lists/2014/11/), which is a list of the most powerful 500 computers, measured in FLOPS. The Graph 500 began in 2010, and so far has measured 183 machines, though many of these are not supercomputers, and would presumably not rank among the best 500 TEPS scores if more supercomputers computers were measured.\n\n\nThe TEPS benchmark is defined as the number of graph edges traversed per second during a breadth-first search of a very large graph. The scale of the graph is tuned to grow with the size of the hardware. See the [Graph500 benchmarks page](http://www.graph500.org/specifications) for further details.\n\n\n### The brain in TEPS\n\n\nWe are interested in TEPS in part because we would like to estimate the brain’s capacity in terms of TEPS, as an input to forecasting AI timelines. One virtue of this is that it will be a relatively independent measure of how much hardware the human brain is equivalent to, which we can then compare to other estimates. It is also easier to measure information transfer in the brain than computation, making this a more accurate estimate. We also expect that at the scale of the brain, communication is a significant bottleneck (much as it is for a supercomputer), making TEPS a particularly relevant benchmark. The brain’s contents support this theory: much of its mass and energy appears to be used on moving information around.\n\n\nCurrent TEPS available per dollar\n---------------------------------\n\n\nWe estimate that a TEPS can currently be produced for around $0.26 per hour in a supercomputer.\n\n\n### Our estimate\n\n\nTable 1 shows our calculation, and sources for price figures.\n\n\nWe recorded the TEPS scores for the top eight computers in the [Graph 500](http://www.graph500.org/results_nov_2014) (i.e. the best TEPS-producing computers known). We searched for price estimates for these computers, and found five of them. We assume these prices are for hardware alone, though this was not generally specified. The prices are generally from second-hand sources, and so we doubt they are particularly reliable.\n\n\n#### Energy costs\n\n\nWe took energy use figures for the five remaining computers from the [Top 500](http://www.top500.org/list/2014/11/) list. Energy use on the Graph 500 and Top 500 benchmarks are probably somewhat different, especially because computers are often scaled down for the Graph 500 benchmark. See ‘Bias from scaling down’ below for discussion of this problem. There is a Green Graph 500 list, which gives energy figures for some of the supercomputers doing similar problems to those in the Graph 500, but the computers are run at different scales there to in the Graph 500 (presumably to get better energy ratings), so the energy figures given there are also not directly applicable.\n\n\nThe cost of electricity varies by location. We are interested in how cheaply one can produce TEPS, so we suppose computation is located somewhere where power is cheap, charged at industrial rates. Prevailing energy prices in the US [are around](http://www.eia.gov/electricity/monthly/epm_table_grapher.cfm?t=epmt_5_6_a) $0.20 / kilowatt hour, but in some parts of Canada [it seems](http://en.wikipedia.org/wiki/Electricity_sector_in_Canada#Rates) industrial users pay less than $0.05 / kilowatt hour. This is also low relative to [industrial energy prices](http://www.statista.com/statistics/263262/industrial-sector-electricity-prices-in-selected-european-countries/) in various European nations (though these nations too may have small localities with cheaper power). Thus we take $0.05 to be a cheap but feasible price for energy.\n\n\n#### Bias from scaling down\n\n\nNote that our method likely overestimates necessary hardware and energy costs, as many computers [do not use all of their cores](http://spectrum.ieee.org/computing/hardware/better-benchmarking-for-supercomputers) in the Graph 500 benchmark (this can be verified by comparing to cores used in the Top 500 list compiled at the same time). This means that one could get better TEPS/$ prices by just not building parts of existing computers. It also means that the energy used in the Graph 500 benchmarking (not listed) was probably less than that used in the Top 500 benchmarking.\n\n\nWe correct for this by scaling down prices according to cores used. This is probably not a perfect adjustment: the costs of building and running a supercomputer are unlikely to be linear in the number of cores it has. However this seems a reasonable approximation, and better than making no adjustment.\n\n\nThis change makes the data more consistent. The apparently more expensive sources of TEPS were using smaller fractions of their cores (if we assume they used all cores in the Graph 500), and the very expensive Tianhe-2 was using only 6% of its cores. Scaled according to the fraction of cores used in Graph 500, Tianhe-2 produces TEPShours at a similar price to Sequoia. The two apparently cheapest sources of TEPShours (Sequoia and Mira) appear to have been using all of their cores. Figure 1 shows the costs of TEPShours on the different supercomputers, next to the costs when scaled down according to the fraction of cores that were used in the Graph 500 benchmark.\n\n\n[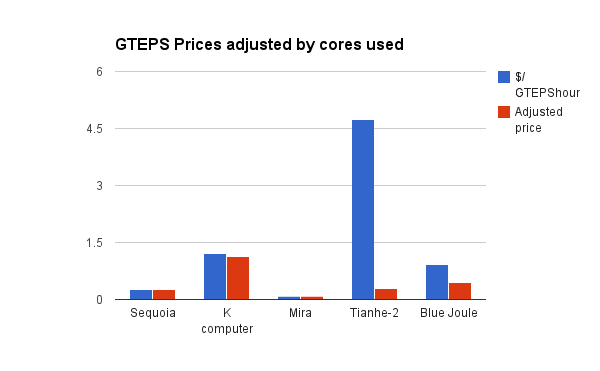](http://aiimpacts.org/wp-content/uploads/2015/03/image-7.png)**Figure 1**: Cost of TEPShours using five supercomputers, and cost naively adjusted for fraction of cores used in the benchmark test.\n\n\n#### Other costs\n\n\nSupercomputers have many costs besides hardware and energy, such as property, staff and software. Figures for these are hard to find. [This presentation](http://www.efiscal.eu/files/presentations/amsterdam/Snell_IS360_TCO_presentation.pdf) suggests the total cost of a large supercomputerover several years can be more than five times the upfront hardware cost. However these figures seem surprisingly high, and we suspect they are not applicable to the problem we are interested in: running AI. High property costs are probably because supercomputers tend to be built in college campuses. Strong AI software is presumably more expensive than what is presently bought, but we do not want to price this into the estimate. Because the figures in the presentation are the only ones we have found, and appear to be inaccurate, we will not further investigate the more inclusive costs of producing TEPShours here, and focus on upfront hardware costs and ongoing energy costs.\n\n\n#### Supercomputer lifespans\n\n\nWe assume a supercomputer lasts for five years. This was the age of [Roadrunner](http://en.wikipedia.org/wiki/IBM_Roadrunner) when decommissioned in 2013, and is consistent with the ages of the computers whose prices we are calculating here — they were all built between 2011 and 2013. [ASCI Red](http://en.wikipedia.org/wiki/ASCI_Red) lasted for nine years, but was apparently considered ‘[supercomputing’s high-water mark in longevity](http://www.upi.com/Science_News/2006/06/29/Worlds-first-supercomputer-decommissioned/UPI-60321151628137/)‘. We did not find other examples of large decommissioned supercomputers with known lifespans.\n\n\n#### Calculation\n\n\nFrom all of this, we calculate the price of a GTEPShour in each of these systems, as shown in table 1.\n\n\n\n\n\n\n\n\n\n\n\n\n\n\n| Name | GTeps | Estimated Price (million) | Hardware cost/hour (5 year life) | Energy (kW) | Hourly energy cost (at 5c/kWh) | Total $/hour\n(including hardware and energy) | $/GTEPShours\n(including hardware and energy) | $/GTEPShours scaled by cores used | Cost sources |\n| DOE/NNSA/LLNL Sequoia (IBM – BlueGene/Q, Power BQC 16C 1.60 GHz) | 23751 | $250 | $5,704 | 7,890.00 | $394.50 | 6,098.36 | $0.26 | $0.26 | [1](https://aiimpacts.org/cost-of-teps/#easy-footnote-bottom-1-457 \"“Livermore told us it spent roughly $250 million on Sequoia.” http://arstechnica.com/information-technology/2012/06/with-16-petaflops-and-1-6m-cores-doe-supercomputer-is-worlds-fastest/\") |\n| K computer (Fujitsu – Custom supercomputer) | 19585.2 | $1,000 | $22,815 | 12,659.89 | $632.99 | 23,448.42 | $1.20 | $1.13 | [2](https://aiimpacts.org/cost-of-teps/#easy-footnote-bottom-2-457 \"“The K Computer in Japan, for example, cost more than $1 billion to build and $10 million to operate each year.” http://arstechnica.com/information-technology/2012/06/with-16-petaflops-and-1-6m-cores-doe-supercomputer-is-worlds-fastest/ (note that our estimated energy expenses come to around $5M, which seems consistent with this).\") |\n| DOE/SC/Argonne National Laboratory Mira (IBM – BlueGene/Q, Power BQC 16C 1.60 GHz) | 14982 | $50 | $1,141 | 3,945.00 | $197.25 | 1,338.02 | $0.09 | $0.09 | [3](https://aiimpacts.org/cost-of-teps/#easy-footnote-bottom-3-457 \"“Mira is expected to cost roughly $50 million, according to reports.” https://www.alcf.anl.gov/articles/mira-worlds-fastest-supercomputer”IBM did not reveal the price for Mira, though it did say Argonne had purchased it with funds from a US$180 million grant.” http://www.pcworld.com/article/218951/us_commissions_beefy_ibm_supercomputer.html,\") |\n| Tianhe-2 (MilkyWay-2) (National University of Defense Technology – MPP) | 2061.48 | $390 | $8,898 | 17,808.00 | $890.40 | 9,788.42 | $4.75 | $0.30 | [4](https://aiimpacts.org/cost-of-teps/#easy-footnote-bottom-4-457 \"“Cost: 2.4 billion Yuan or 3 billion Hong Kong dollars (390 million US Dollars)” http://www.crizmo.com/worlds-top-10-supercomputers-with-their-cost-speed-and-usage.html \") |\n| Blue Joule (IBM – BlueGene/Q, Power BQC 16C 1.60 GHz) | 1427 | $55.3 | $1,262 | 657.00 | $32.85 | 1,294.54 | $0.91 | $0.46 | [5](https://aiimpacts.org/cost-of-teps/#easy-footnote-bottom-5-457 \"“Blue Joule…The cost of this system appears to be 10 times (£37.5 million) the above mentioned grant to develop the Emerald GPU supercomputer.” http://hexus.net/business/news/enterprise/41937-uks-powerful-gpu-supercomputer-booted/ Note that £37.5M = $55.3M \") |\n\n\n***Table 1**: Calculation of costs of a TEPS over one hour in five supercomputers.*\n\n\n#### Sequoia as representative of cheap TEPShours\n\n\nMira and then Sequoia produce the cheapest TEPShours of the supercomputers investigated here, and are also the only ones which used all of their cores in the benchmark, making their costs less ambiguous. Mira’s costs are ambiguous nonetheless, because the $50M price estimate we have was projected by an unknown source, ahead of time. Mira is also known to have been bought using some part of a $180M grant. If Mira cost most of that, it would be more expensive than Sequoia. Sequoia’s price was given by the laboratory that bought it, after the fact, so is more likely to be reliable.\n\n\nThus while Sequoia does not appear to be the cheapest source of TEPS, it does appear to be the second cheapest, and its estimate seems substantially more reliable. Sequoia is also a likely candidate to be especially cheap, since it is ranked first in the Graph 500, and is the largest of the IBM [Blue Gene/Q](http://en.wikipedia.org/wiki/Blue_Gene)s, which dominate the top of the Graph 500 list. This somewhat supports the validity of its apparent good price performance here.\n\n\nSequoia is also not much cheaper than the more expensive supercomputers in our list, once they are scaled down according to the number of cores they used on the benchmark (see Table 1), further supporting this price estimate.\n\n\nThus we estimate that GTEPShours can be produced for around $0.26 on current supercomputers. This corresponds to around $11,000/GTEP to buy the hardware alone.\n\n\n#### Price of TEPShours in lower performance computing\n\n\nWe have only looked at the price of TEPS in top supercomputers. While these produce the most TEPS, they might not be the part of the range which produces TEPS most cheaply. However because we are interested in the application to AI, and thus to systems roughly as large as the brain, price performance near the top of the range is particularly relevant to us. Even if a laptop could produce a TEPS more cheaply than Sequoia, it produces too few of them to run a brain efficiently. Nonetheless, we plan to investigate TEPS/$ in lower performing computers in future.\n\n\nFor now, we checked the efficiency of an iPad 3, since one was listed near the bottom of the Graph 500. These are sold for [$349.99](http://www.amazon.com/Apple-MC705LL-Wi-Fi-Black-Generation/dp/B00746LVOM/ref=sr_1_1?ie=UTF8&qid=1426895358&sr=8-1&keywords=3rd+generation+ipad), and apparently produce 0.0304 GTEPS. Over five years, this comes out at exactly the same price as the Sequoia: $0.26/GTEPShour. This suggests both that cheaper computers may be more efficient than large supercomputers (the iPad is not known for its cheap computing power) and that the differences in price are probably not large across the performance spectrum.\n\n\nTrends in TEPS available per dollar\n-----------------------------------\n\n\nThe long-term trend of TEPS is not well known, as the benchmark is new. This makes it hard to calculate a TEPS/$ trend. Figure 2 is from a powerpoint *[Announcing the 9th Graph500 List!](http://www.graph500.org/sites/default/files/files/bof/Graph500-BoF-SC14-v1.pdf)* from the [Top 500 website](http://www.graph500.org/bof). One thing it shows is top performance in the Graph 500 list since the list began in 2010. Top performance grew very fast (3.5 orders of magnitude in two years), before completely flattening, then growing slowly. The powerpoint attributes this pattern to ‘maturation of the benchmark’, suggesting that the steep slope was probably not reflective of real progress.\n\n\nOne reason to expect this pattern is that during the period of fast growth, pre-existing high performance computers were being tested for the first time. This appears to account for some of it. However we note that in June 2012, Sequoia (which tops the list at present) and Mira (#3) had both already been tested, and merely had lower performance than they do now, suggesting at least one other factor is at play. One possibility is that in the early years of using the benchmark, people develop good software for the problem, or in other ways adjust how they use particular computers on the benchmark.\n\n\n[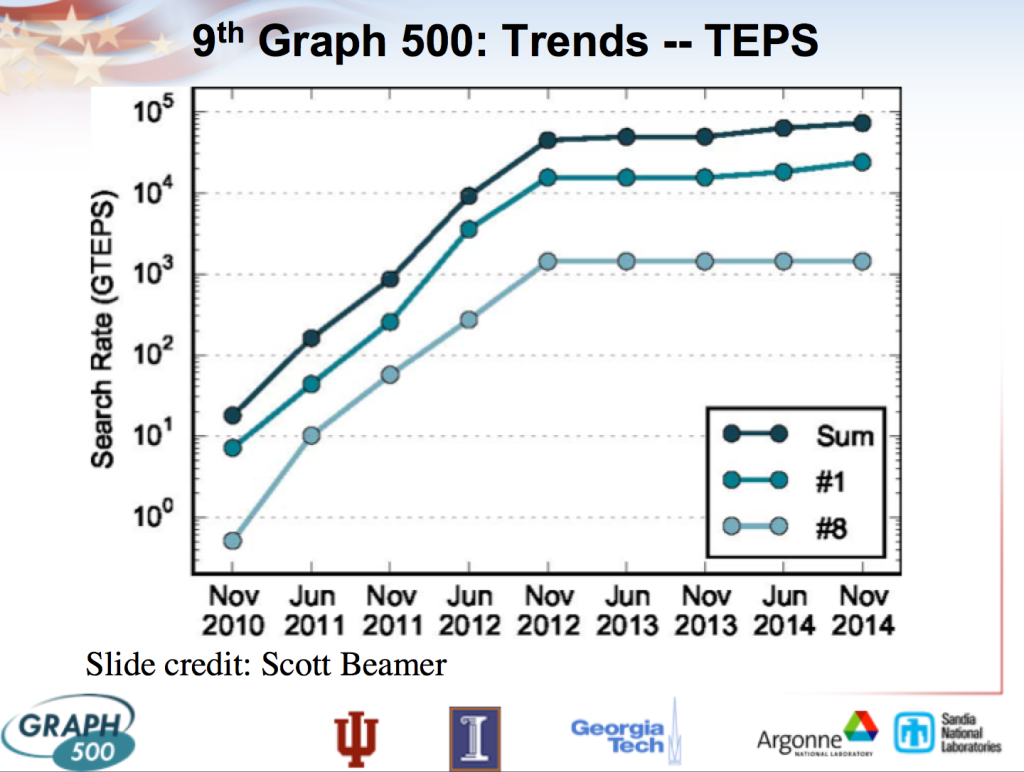](http://aiimpacts.org/wp-content/uploads/2015/03/teps-trend-top-500-copy.png)**Figure 2**: Performance of the top supercomputer on Graph 500 each year since it has existed (along with the 8th best, and an unspecified sum).\n\n\n \n\n\n### Relationship between TEPS and FLOPS\n\n\nThe top eight computers in the Graph 500 are also in the [Top 500](http://en.wikipedia.org/wiki/TOP500), so we can compare their TEPS and FLOPS ratings. Because many computers did not use all of their cores in the Graph 500, we scale down the FLOPS measured in the Top 500 by the fraction of cores used in the Graph 500 relative to the Top 500 (this is discussed further in ‘Bias from scaling down’ above). We have not checked thoroughly whether FLOPS scales linearly with cores, but this appears to be a reasonable approximation, based on the first page of the Top 500 list.\n\n\nThe supercomputers measured here consistently achieve around 1-2 GTEPS per scaled TFLOPS (see Figure 3). The median ratio is 1.9 GTEPS/TFLOP, the mean is 1.7 GTEPS/TFLOP, and the variance 0.14 GTEPS/TFLOP. Figure 4 shows GTEPS and TFLOPS plotted against one another.\n\n\nThe ratio of GTEPS to TFLOPS may vary across the range of computing power. Our figures may may also be slightly biased by selecting machines from the top of the Graph 500 to check against the Top 500. However the current comparison gives us a rough sense, and the figures are consistent.\n\n\n[This presentation](http://on-demand.gputechconf.com/gtc/2013/presentations/S3089-Breadth-First-Search-Multiple-GPUs.pdf) (slide 23) reports that a Kepler GPU produces 109 TEPS, as compared to 1012 FLOPS reported [here](http://en.community.dell.com/techcenter/high-performance-computing/b/weblog/archive/2013/11/25/accelerating-high-performance-linpack-hpl-with-kepler-k20x-gpus.aspx) (assuming that both are top end models), suggesting a similar ratio holds for less powerful computers.\n\n\n[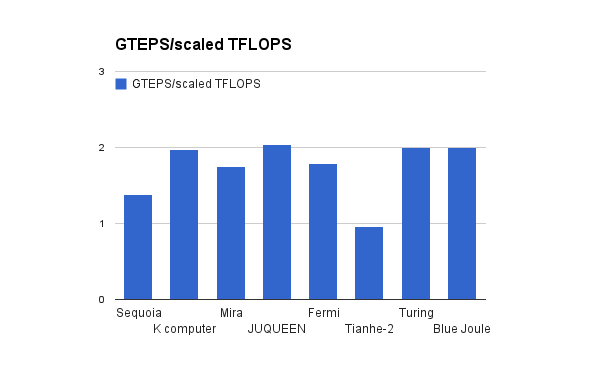](http://aiimpacts.org/wp-content/uploads/2015/03/image-10.png)Figure 3: GTEPS/scaled TFLOPS, based on Graph 500 and Top 500.\n\n\n[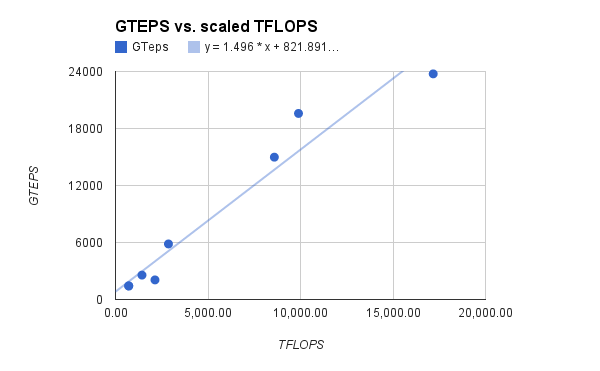](http://aiimpacts.org/wp-content/uploads/2015/03/image-9.png)Figure 4: GTEPS and scaled TFLOPS achieved by the top 8 machines on Graph 500. See text for scaling description.\n\n\n#### \n\n\n#### Projecting TEPS based on FLOPS\n\n\nSince the conversion rate between FLOPS and TEPS is approximately consistent, we can project growth in TEPS/$ based on the better understood growth of FLOPS/$. In the last quarter of a century, FLOPS/$ [has grown](http://aiimpacts.org/trends-in-the-cost-of-computing/ \"Trends in the cost of computing\") by a factor of ten roughly every four years. This suggests that TEPS/$ also grows by a factor of ten every four years.\n\n\n \n\n\n\n\n---\n\n\n \n\n", "url": "https://aiimpacts.org/cost-of-teps/", "title": "The cost of TEPS", "source": "aiimpacts.org", "source_type": "wordpress", "date_published": "2015-03-21T22:53:27+00:00", "paged_url": "https://aiimpacts.org/feed?paged=22", "authors": ["Katja Grace"], "id": "0b17c3949dece94592f4e310dc1b9817", "summary": []}
{"text": "Allen, The Singularity Isn’t Near\n\n[The Singularity Isn’t Near](http://www.technologyreview.com/view/425733/paul-allen-the-singularity-isnt-near/) is an article in [MIT Technology Review](http://www.technologyreview.com/) by [Paul Allen](http://en.wikipedia.org/wiki/Paul_Allen) which argues that a singularity brought about by super-human-level AI will not arrive by 2045 (as is [predicted](https://sites.google.com/site/aiimpactslibrary/ai-timelines/predictions-of-human-level-ai-dates/published-analyses-of-time-to-human-level-ai/kurzweil-the-singularity-is-near) by Kurzweil).\n\n\nThe summarized argument\n-----------------------\n\n\nWe will not have human-level AI by 2045:\n\n\n1. To reach human-level AI, we need software as well as hardware.\n\n\n2. To get this software, we need one of the following:\n\n\n* a detailed scientific understanding of the brain\n* a way to ‘duplicate’ brains\n* creation of something equivalent to a brain from scratch\n\n\n3. A detailed scientific understanding of the brain is unlikely by 2045:\n\n\n1. To have enough understanding by 2045, we would need a massive acceleration of scientific progress:\n\t1. We are just scraping the surface of understanding the foundations of human cognition.\n2. A massive acceleration of progress in brain science is unlikely\n\t1. Science progresses irregularly:\n\t\t1. e.g. The discovery of long-term potentiation, the columnar organization of cortical areas, neuroplasticity.\n\t2. Science doesn’t seem to be exponentially accelerating\n\t3. There is a ‘complexity break’: the more we understand, the more complicated the next level to understand is\n\n\n4. ‘Duplicating’ brains is unlikely by 2045:\n\n\n1. Even if we have good scans of brains, we need good understanding of how the parts behave to complete the model\n2. We have little such understanding\n3. Such understanding is not exponentially increasing\n\n\n5. Creation of something equivalent to a brain from scratch is unlikely by 2045:\n\n\n1. Artificial intelligence research appears to be far from providing this\n2. Artificial intelligence research is unlikely to improve fast:\n\t1. Artificial intelligence research does not appear to be exponentially improving\n\t2. The ‘complexity break’ (see above) also operates here\n\t3. This is the kind of area where progress is not a reliable exponential\n\n\nComments\n--------\n\n\nThe controversial parts of this argument appear to be the parallel claims that progress is insufficiently fast (or accelerating) to reach an adequate understanding of the brain or of artificial intelligence algorithms by 2045. Allen’s argument does not present enough support to evaluate them from this alone. Others with at least as much expertise disagree with these claims, so they appear to be open questions.\n\n\nTo evaluate them, it appears we would need more comparable measures of accomplishments and rates of progress in brain science and AI. With only the qualitative style of Allen’s claims, it is hard to know whether progress being slow, and needing to go far, implies that it won’t get to a specific place by a specific date.\n\n", "url": "https://aiimpacts.org/allen-the-singularity-isnt-near/", "title": "Allen, The Singularity Isn’t Near", "source": "aiimpacts.org", "source_type": "wordpress", "date_published": "2015-03-13T09:04:48+00:00", "paged_url": "https://aiimpacts.org/feed?paged=22", "authors": ["Katja Grace"], "id": "885ad51a944fa484b8e2df670bfa7578", "summary": []}
{"text": "Kurzweil, The Singularity is Near\n\n[The Singularity Is Near](http://en.wikipedia.org/wiki/The_Singularity_Is_Near) is a book by [Ray Kurzweil](http://en.wikipedia.org/wiki/Ray_Kurzweil). It argues that a [technological singularity](http://en.wikipedia.org/wiki/Technological_singularity) will occur in around 2045. This appears to be largely based on extrapolation from hardware in combination with a guess for how much machine computation is needed to produce a large disruption to human society. The book relatedly claims that a machine will be able to pass a Turing test by 2029.\n\n\nDetails\n-------\n\n\n### Calculation of the date of the singularity\n\n\nThe following is our reconstruction of an argument Kurzweil makes in the book, for expecting the Singularity in 2045.\n\n\n1. In the early 2030s one thousand dollars’ worth of computation will buy about 10¹⁷ computations per second (p119)\n2. Today we spend more than $10¹¹/year on computation, which will conservatively rise to $10¹²/year by 2030 (p119-20).\n3. Therefore in the early 2030s we will be producing about 10²⁶-10²⁹ computations per second of nonbiological computation per year, and by the mid 2040s, we will produce 10²⁶ cps with $1000 (p120)\n4. The sum of all living biological human intelligence operates at around 10²⁶ computations per second (p113)\n5. Thus in the early 2030s we will produce new computing power roughly equivalent to the capacity of all living biological human intelligence, every year. In the mid 2040s the total computing capacity we produce each year will be a billion times more powerful than all of human intelligence today. (p120)\n6. Non-biological intelligence will be better than our own brains because machines have some added advantages, such as accuracy and ability to run at peak capacity. (p120)\n7. The early 2030s will not be a singularity, because its events do not yet correspond to a sufficiently profound expansion of our intelligence. (p120)\n8. In the 1940s, when the computing capacity we produce each year is a billion times more powerful than all human intelligence today, these events will represent a profound and disruptive transformation in human capability, i.e. a singularity. (p120)\n\n\n### Relevance of software\n\n\nWhile he doesn’t mention it in the prediction explained above, Kurzweil appears elsewhere to agree that substantial software progress is needed alongside hardware progress for human-level intelligence. He says, “The hardware computational capacity is necessary but not sufficient. Understanding the organization and content of these resources—the software of intelligence—is even more critical and is the objective of the brain reverse-engineering undertaking.” (p126).\n\n\nHis argument that the necessary understanding for producing human-level software will come in time with the hardware appears to be as follows:\n\n\n1. Understanding of the brain is reasonably good; researchers rapidly turn data from studies into effective working models (p147)\n2. Understanding of the brain is growing exponentially:\n\t1. Our ability to observe the brain is growing exponentially: ‘Scanning and sensing tools are doubling their overall spatial and temporal resolution each year’. (p163)\n\t2. ‘Databases of brain-scanning information and model building are also doubling in size about once per year.’ (p163)\n\t3. Our ability to model the brain follows closely behind our acquisition of the requisite tools and data (p163) and so is also growing exponentially in some sense.\n\n\n### Human-level AI\n\n\nAccording to Kurzweil, ‘With both the hardware and software needed to fully emulate human intelligence, we can expect computers to pass the Turing test, indicating intelligence indistinguishable from that of biological humans, by the end of the 2020s.’\n\n\nThe claims that hardware and software will be human-level by 2029 appear to share their justification with the above claims about the timing of the Singularity.\n\n\nKurzweil [bet](http://longbets.org/1/) that by 2029 a computer would pass the turing test, and wrote an article explaining his optimism about the bet [here](https://web.archive.org/web/20110720061136/http://www.kurzweilai.net/a-wager-on-the-turing-test-why-i-think-i-will-win).\n\n\nComments\n--------\n\n\nIf the ‘singularity’ is meant to refer to some particular event, it is unclear why this event would occur when the hardware produced is a billion times more powerful than all human intelligence today. This number might make some sense as an upper bound on when something disruptive should have happened. However it is unclear why the events predicted in the early 2030s would not cause a profound and disruptive transformation, while those in the mid 2040s would.\n\n\nKurzweil’s calculation of the date of the Singularity appears to have other minor gaps:\n\n\n1. The argument is about flows of hardware, where it wants to make a conclusion in terms of stocks of hardware. Kurzweil wants to compare total biological and non-biological computation. However he calculates the computing hardware produced per year, instead of the total available that year, or the computation done in that year. These numbers are probably fairly similar in practice, if we suppose that hardware lasts a small number of years.\n2. That non-biological machines appear to have some advantages over humans does not imply that some given non-biological machines have advantages overall.\n3. The argument suggests software will develop ‘fast’ in some sense, but this isn’t actually compared to hardware progress or measured in years, so it is unclear whether it would be developed in time.\n\n\nA key disagreement with other commentators appears to be over the rate of progress of understanding relevant to producing software. In particular, Kurzweil believes that such understanding is growing exponentially, and that it will be be sufficient for producing machines as intelligent as humans in line with the hardware. [Allen](http://aiimpacts.org/allen-the-singularity-isnt-near/ \"Allen, The Singularity Isn’t Near\"), for instance, has argued with this. Resolving this disagreement would require better measures of neuroscience progress, as well as a better understanding of its relevance.\n\n", "url": "https://aiimpacts.org/kurzweil-the-singularity-is-near/", "title": "Kurzweil, The Singularity is Near", "source": "aiimpacts.org", "source_type": "wordpress", "date_published": "2015-03-12T12:15:11+00:00", "paged_url": "https://aiimpacts.org/feed?paged=22", "authors": ["Katja Grace"], "id": "fe9d5f4bf49f72f44d51ae69548f2287", "summary": []}
{"text": "Wikipedia history of GFLOPS costs\n\nThis is a list from [Wikipedia](http://en.wikipedia.org/wiki/FLOPS#Hardware_costs), showing hardware configurations that authors claim perform efficiently, along with their prices per GFLOPS at different times in recent history.\n\n\nIn it, prices generally fall at around an order of magnitude every five years, and have continued to do so recently.\n\n\nNotes\n-----\n\n\nThis list is from November 5 2017 ([archive version](https://web.archive.org/web/20171105094854/https://en.wikipedia.org/wiki/FLOPS)). It is not necessarily credible. We had trouble verifying at least one datapoint, of the few we tried. Performance numbers appear to be a mixture of theoretical peak performance and empirical performance. It is not clear to what extent one should expect the included systems to be especially cost-effective, or why these particular systems were chosen.\n\n\nThe last point is in October 2017, and appears to be roughly in line with the rest of the trend. The last order of magnitude took around 4.5 years. The overall rate in the figure appears to be very roughly an order of magnitude every five years.\n\n\nList\n----\n\n\n\n\n| Date | Approximate cost per GFLOPS | Approximate cost per GFLOPS inflation adjusted to 2013 US dollars[[54]](https://web.archive.org/web/20171105094854/https://en.wikipedia.org/wiki/FLOPS#cite_note-54) | Platform providing the lowest cost per GFLOPS | Comments |\n| --- | --- | --- | --- | --- |\n| 1961 | US$18,672,000,000 ($18.7 billion) | US$145.5 billion | About 2400 [IBM 7030 Stretch](https://web.archive.org/web/20171105094854/https://en.wikipedia.org/wiki/IBM_7030_Stretch \"IBM 7030 Stretch\") supercomputers costing $7.78 million each | The [IBM 7030 Stretch](https://web.archive.org/web/20171105094854/https://en.wikipedia.org/wiki/IBM_7030_Stretch \"IBM 7030 Stretch\") performs one floating-point multiply every 2.4 microseconds.[[55]](https://web.archive.org/web/20171105094854/https://en.wikipedia.org/wiki/FLOPS#cite_note-55) |\n| 1984 | $18,750,000 | $42,780,000 | [Cray X-MP](https://web.archive.org/web/20171105094854/https://en.wikipedia.org/wiki/Cray_X-MP \"Cray X-MP\")/48 | $15,000,000 / 0.8 GFLOPS |\n| 1997 | $30,000 | $42,000 | Two 16-processor [Beowulf](https://web.archive.org/web/20171105094854/https://en.wikipedia.org/wiki/Beowulf_(computing) \"Beowulf (computing)\")clusters with [Pentium Pro](https://web.archive.org/web/20171105094854/https://en.wikipedia.org/wiki/Pentium_Pro \"Pentium Pro\")microprocessors[[56]](https://web.archive.org/web/20171105094854/https://en.wikipedia.org/wiki/FLOPS#cite_note-56) | |\n| April 2000 | $1,000 | $1,300 | [Bunyip Beowulf cluster](https://web.archive.org/web/20171105094854/https://en.wikipedia.org/wiki/Beowulf_(computing) \"Beowulf (computing)\") | Bunyip was the first sub-US$1/MFLOPS computing technology. It won the Gordon Bell Prize in 2000. |\n| May 2000 | $640 | $836 | [KLAT2](https://web.archive.org/web/20171105094854/https://en.wikipedia.org/wiki/Kentucky_Linux_Athlon_Testbed \"Kentucky Linux Athlon Testbed\") | KLAT2 was the first computing technology which scaled to large applications while staying under US-$1/MFLOPS.[[57]](https://web.archive.org/web/20171105094854/https://en.wikipedia.org/wiki/FLOPS#cite_note-57) |\n| August 2003 | $82 | $100 | KASY0 | KASY0 was the first sub-US$100/GFLOPS computing technology.[[58]](https://web.archive.org/web/20171105094854/https://en.wikipedia.org/wiki/FLOPS#cite_note-58) |\n| August 2007 | $48 | $52 | Microwulf | As of August 2007, this 26.25 GFLOPS “personal” Beowulf cluster can be built for $1256.[[59]](https://web.archive.org/web/20171105094854/https://en.wikipedia.org/wiki/FLOPS#cite_note-59) |\n| March 2011 | $1.80 | $1.80 | HPU4Science | This $30,000 cluster was built using only commercially available “gamer” grade hardware.[[60]](https://web.archive.org/web/20171105094854/https://en.wikipedia.org/wiki/FLOPS#cite_note-60) |\n| August 2012 | $0.75 | $0.73 | Quad AMD Radeon 7970 GHz System | A quad [AMD](https://web.archive.org/web/20171105094854/https://en.wikipedia.org/wiki/AMD \"AMD\") [Radeon 7970](https://web.archive.org/web/20171105094854/https://en.wikipedia.org/wiki/Radeon_HD_7000_Series \"Radeon HD 7000 Series\") desktop computer reaching 16 TFLOPS of single-precision, 4 TFLOPS of double-precision computing performance. Total system cost was $3000; Built using only commercially available hardware.[[61]](https://web.archive.org/web/20171105094854/https://en.wikipedia.org/wiki/FLOPS#cite_note-61) |\n| June 2013 | $0.22 | $0.22 | Sony PlayStation 4 | The Sony [PlayStation 4](https://web.archive.org/web/20171105094854/https://en.wikipedia.org/wiki/PlayStation_4 \"PlayStation 4\") is listed as having a peak performance of 1.84 TFLOPS, at a price of $400[[62]](https://web.archive.org/web/20171105094854/https://en.wikipedia.org/wiki/FLOPS#cite_note-62) |\n| November 2013 | $0.16 | $0.16 | AMD Sempron 145 & GeForce GTX 760 System | Built using commercially available parts, a system using one AMD [Sempron](https://web.archive.org/web/20171105094854/https://en.wikipedia.org/wiki/Sempron \"Sempron\") 145 and three [Nvidia](https://web.archive.org/web/20171105094854/https://en.wikipedia.org/wiki/Nvidia \"Nvidia\") [GeForce GTX 760](https://web.archive.org/web/20171105094854/https://en.wikipedia.org/wiki/GeForce_700_series \"GeForce 700 series\") reaches a total of 6.771 TFLOPS for a total cost of $1090.66.[[63]](https://web.archive.org/web/20171105094854/https://en.wikipedia.org/wiki/FLOPS#cite_note-63) |\n| December 2013 | $0.12 | $0.12 | Pentium G550 & Radeon R9 290 System | Built using commercially available parts. [Intel](https://web.archive.org/web/20171105094854/https://en.wikipedia.org/wiki/Intel \"Intel\") [Pentium G550](https://web.archive.org/web/20171105094854/https://en.wikipedia.org/wiki/Sandy_Bridge \"Sandy Bridge\") and AMD [Radeon R9 290](https://web.archive.org/web/20171105094854/https://en.wikipedia.org/wiki/AMD_Radeon_Rx_200_series \"AMD Radeon Rx 200 series\") tops out at 4.848 TFLOPS grand total of US$681.84.[[64]](https://web.archive.org/web/20171105094854/https://en.wikipedia.org/wiki/FLOPS#cite_note-64) |\n| January 2015 | $0.08 | $0.08 | Celeron G1830 & Radeon R9 295X2 System | Built using commercially available parts. Intel [Celeron G1830](https://web.archive.org/web/20171105094854/https://en.wikipedia.org/wiki/Haswell_(microarchitecture) \"Haswell (microarchitecture)\") and AMD [Radeon R9 295X2](https://web.archive.org/web/20171105094854/https://en.wikipedia.org/wiki/AMD_Radeon_Rx_200_series \"AMD Radeon Rx 200 series\")tops out at over 11.5 TFLOPS at a grand total of US$902.57.[[65]](https://web.archive.org/web/20171105094854/https://en.wikipedia.org/wiki/FLOPS#cite_note-65)[[66]](https://web.archive.org/web/20171105094854/https://en.wikipedia.org/wiki/FLOPS#cite_note-66) |\n| June 2017 | $0.06 | $0.06 | AMD Ryzen 7 1700 & AMD Radeon Vega Frontier Edition | Built using commercially available parts. AMD Ryzen 7 1700 CPU combined with AMD Radeon Vega FE cards in CrossFire tops out at over 50 TFLOPS at just under US$3,000for the complete system.[[67]](https://web.archive.org/web/20171105094854/https://en.wikipedia.org/wiki/FLOPS#cite_note-67) |\n| October 2017 | $0.03 | $0.03 | Intel Celeron G3930 & AMD RX Vega 64 | Built using commercially available parts. Three [AMD RX Vega 64](https://web.archive.org/web/20171105094854/https://en.wikipedia.org/wiki/AMD_RX_Vega_series \"AMD RX Vega series\") graphics cards provide just over 75 TFLOPS half precision (38 TFLOPS SP or 2.6 TFLOPS DP when combined with the CPU) at ~$2,050 for the complete system.[[68]](https://web.archive.org/web/20171105094854/https://en.wikipedia.org/wiki/FLOPS#cite_note-68) |\n\n\n \n\n\nThe following is a figure we made, of the above list.\n\n\n\nFurther discussion\n------------------\n\n\n*[Trends in the cost of computing](http://aiimpacts.org/trends-in-the-cost-of-computing/ \"Trends in the cost of computing\")*\n\n", "url": "https://aiimpacts.org/wikipedia-history-of-gflops-costs/", "title": "Wikipedia history of GFLOPS costs", "source": "aiimpacts.org", "source_type": "wordpress", "date_published": "2015-03-11T01:58:46+00:00", "paged_url": "https://aiimpacts.org/feed?paged=22", "authors": ["Katja Grace"], "id": "51fc25dec47233d56032c257f08a9d32", "summary": []}
{"text": "Trends in the cost of computing\n\n*Posted 10 Mar 2015*\n\n\nComputing power available per dollar has probably increased by a factor of ten roughly every four years over the last quarter of a century (measured in FLOPS or MIPS).\n\n\nOver the past 6-8 years, the rate has been slower: around an order of magnitude every 10-16 years, measured in single precision theoretical peak FLOPS or Passmark’s benchmark scores.\n\n\nSince the 1940s, MIPS/$ have grown by a factor of ten roughly every five years, and FLOPS/$ roughly every 7.7 years.\n\n\nEvidence\n--------\n\n\n### Nordhaus\n\n\n[Nordhaus (2001)](https://web.archive.org/web/20160222082744/http://www.econ.yale.edu/~nordhaus/homepage/prog_083001a.pdf) analyzes the cost of computing over the past century and a half, and produces Figure 1 (though the scale on the vertical axis appears to be off by many orders of magnitude). Much of his data comes from Moravec’s *[Mind Children](http://books.google.com/books/about/Mind_Children.html?id=56mb7XuSx3QC)*(an updated version of the data is [here](https://web.archive.org/web/20161112110101/http://www.transhumanist.com:80/volume1/moravec.htm)). He converts all data points to ‘million standard operations per second’ (MSOPS), where a standard operation is a weighted mixture of multiplications and additions. He says it is approximately equivalent to 1 MIPS under the Dhrystone metric.\n\n\nHe calculates that performance improved at an average rate of 55% per year since 1940. That is, an order of magnitude roughly every five years. However he finds that the average growth rate in different decades differed markedly, with growth since 1980 (until writing in 2001) at around 80% per year, and growth in the 60s and 70s at less than 30% (see figure 2). This would correspond to improving by an order of magnitude every four years in the 80s and 90s.\n\n\n[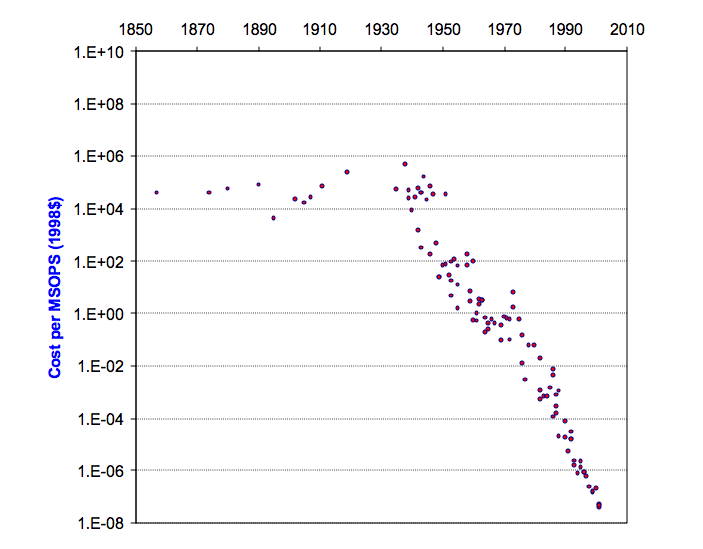](http://aiimpacts.org/wp-content/uploads/2015/03/nordhauscomp-copy.png)**Figure 1:** “The progress of computing measured in cost per million standardized operations per second (MSOPS) deflated by the consumer price index.” **Note that the vertical axis appears to be mislabeled—the scale is around seven orders of magnitude different from other sources, such as [Moravec](https://web.archive.org/web/20161112110101/http://www.transhumanist.com:80/volume1/moravec.htm).** (From Figure 1, [Nordhaus, 2001](https://web.archive.org/web/20160222082744/http://www.econ.yale.edu/~nordhaus/homepage/prog_083001a.pdf), p38)\n\n\n[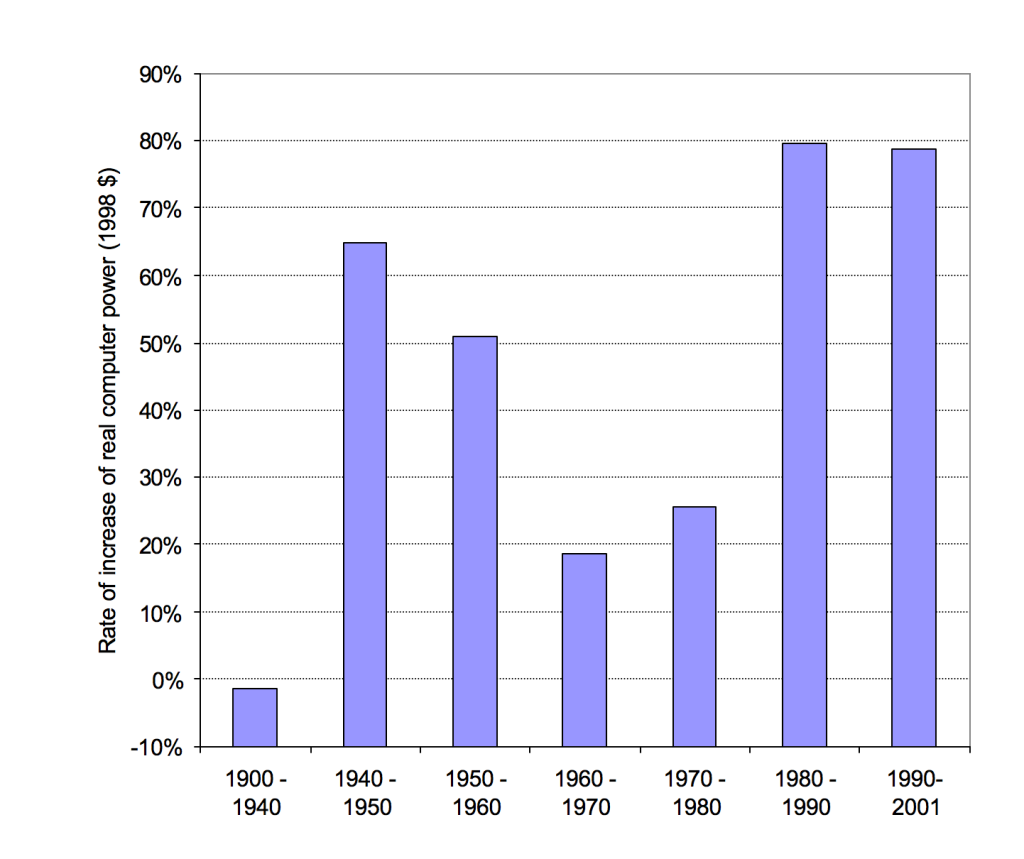](http://aiimpacts.org/wp-content/uploads/2015/03/nordhausdecades-copy.png)**Figure 2:** From Nordhaus p42,”Rate of Growth of Computer Power by Epoch…Real computer power is the inverse of the decline of real computation costs…”\n\n\n### Sandberg and Bostrom\n\n\n[Sandberg and Bostrom (2008)](http://www.fhi.ox.ac.uk/brain-emulation-roadmap-report.pdf) investigate hardware performance trends in their Whole Brain Emulation Roadmap (Appendix B). They plot price performance in MIPS/$ and FLOPS/$, as shown in Figures 3 and 4. They find MIPS/$ grows by a factor of ten every 5.6 years (with a [bootstrap](http://en.wikipedia.org/wiki/Bootstrapping_%28statistics%29) 95% confidence interval of 5.3-5.9), and FLOPs/$ grows by a factor of ten every 7.7 years (with a bootstrap confidence interval of 6.5‐9.2 years).\n\n\nThey find that growth in MIPS/$ slowed in the 70s and 80s, then accelerated again (most recently gaining an order of magnitude every 3.5 years), which is close to what Nordhaus found.\n\n\nSandberg and Bostrom’s data is from John McCallum’s [CPU price performance dataset,](http://www.jcmit.com/cpu-performance.htm) which does not appear to draw directly from Moravec’s data.\n\n\n[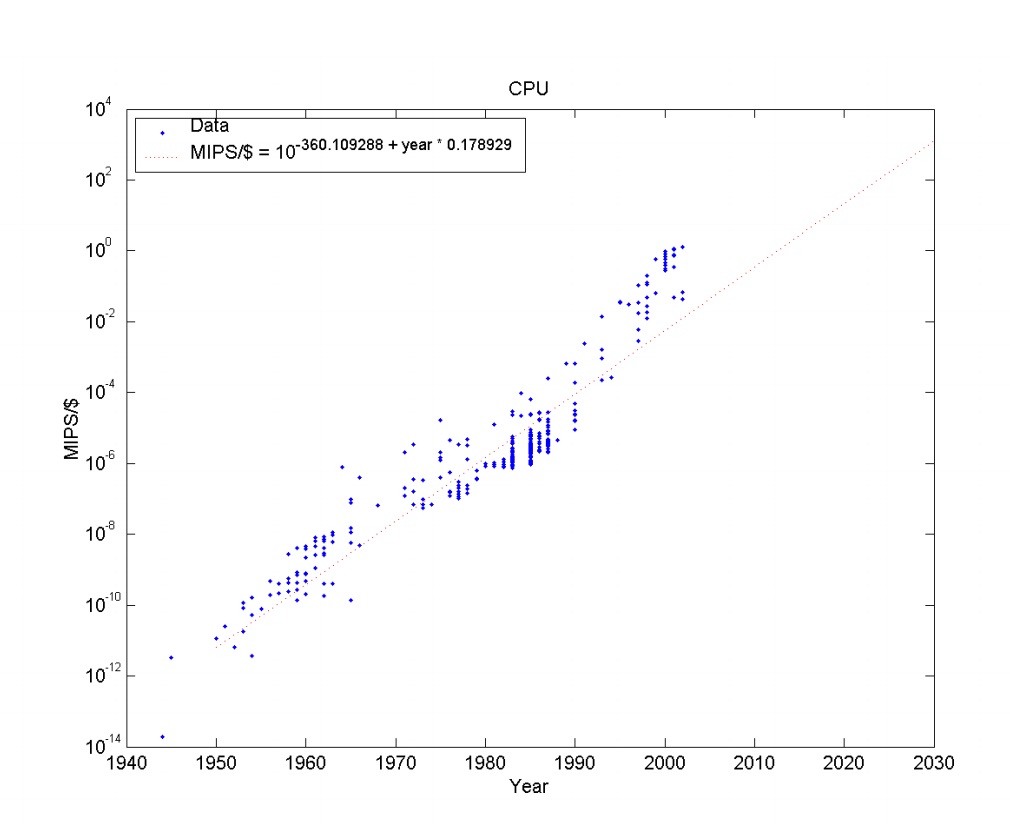](http://aiimpacts.org/wp-content/uploads/2015/03/wberm-mips-copy.jpg)**Figure 3:** Processing power available per dollar over time, measured in MIPS and 2007 US dollars.\n\n\n[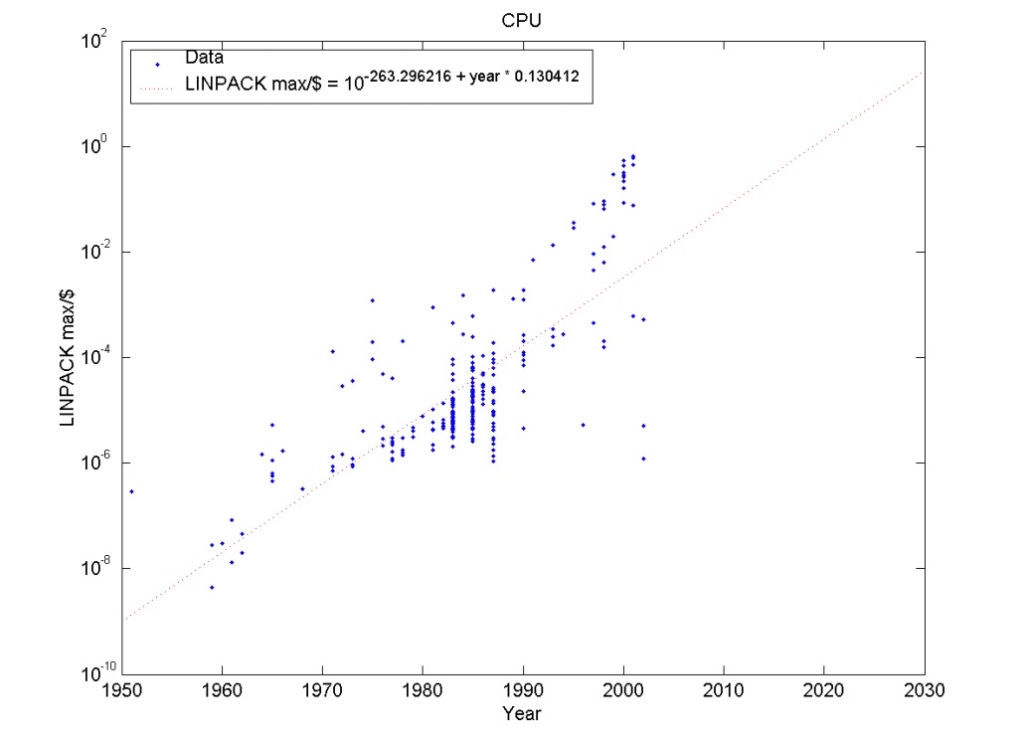](http://aiimpacts.org/wp-content/uploads/2015/03/wberm-flops-copy.jpg)**Figure 4:** Processing power available per dollar over time, measured in FLOPS using the LINPACK benchmark and in 2007 US dollars\n\n\n### Rieber and Muehlhauser\n\n\nMuehlhauser and Rieber (2014) [extended](https://intelligence.org/2014/05/12/exponential-and-non-exponential/#footnote_7_11027) [Koh and Magee’s](http://web.mit.edu/cmagee/www/documents/15-koh_magee-tfsc_functional_approach_studying_technological_progress_vol73p1061-1083_2006.pdf) data on MIPS available per dollar to 2014 (data [not currently] available [here](https://docs.google.com/spreadsheets/d/1qPBpgqxHsqQgcLLXJ5H-4yto9SPQinR4H0f9p5Dh4g4/edit#gid=952780094)). Koh and Magee’s data largely comes from Moravec (like Nordhaus’ above), though they too extended it some. Muehlhauser and Rieber produced Figure 5.\n\n\nIn this data, performance since 1940 appears to be growing by a factor of ten roughly every 5 years (14.2 orders of magnitude in 74 years). In the first fourteen years of this century, log(MIPS/$) grew from roughly -0.7 to 2.8, which corresponds to one order of magnitude every four years (or 77% growth per year).\n\n\n[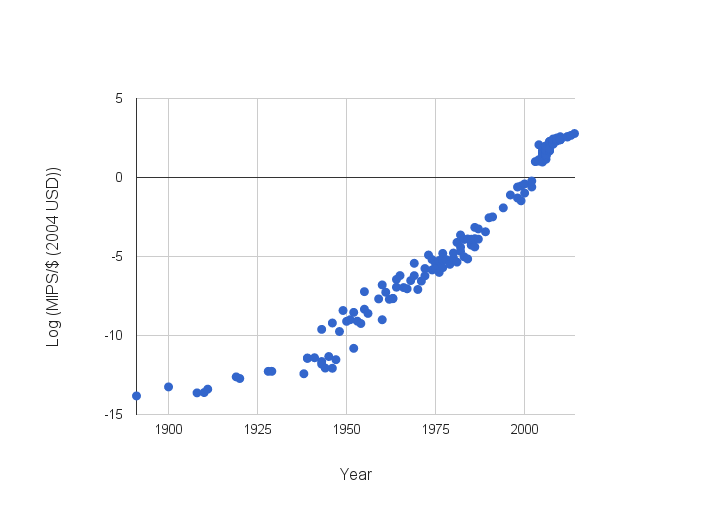](http://aiimpacts.org/wp-content/uploads/2015/03/image-5.png)**Figure 5:** Rieber and Muehlhauser’s MIPS/$ data (modified to fix typo).\n\n\n### Wikipedia\n\n\n[Wikipedia](http://en.wikipedia.org/wiki/FLOPS#Hardware_costs) has a small list of hardware configurations that authors claim produce gigaFLOPS efficiently, along with their prices at different times in recent history. Their data does not appear to cite other sources mentioned above.\n\n\n[Here](http://aiimpacts.org/wikipedia-history-of-gflops-costs/) is their table, as of March 2 2015. Figure 6 shows inflation adjusted costs of gigaFLOPS over time, taken from the table. The examples in the table were apparently selected as follows:\n\n\n\n> The “cost per GFLOPS” is the cost for a set of hardware that would theoretically operate at one billion floating-point operations per second. During the era when no single computing platform was able to achieve one GFLOPS, this table lists the total cost for multiple instances of a fast computing platform which speed sums to one GFLOPS. Otherwise, the least expensive computing platform able to achieve one GFLOPS is listed.\n> \n> \n\n\nWe find this table dubious. It lacks many citations, and the citations it has frequently lack detail. For instance, the claims that the collections of hardware specified produce a GFLOPS are often unsubstantiated. We spent around thirty minutes trying to substantiate the 2015 figure, to no avail. The figure is more than an order of magnitude cheaper than [current FLOPS prices](http://aiimpacts.org/current-flops-prices/ \"Current FLOPS prices\") we found.\n\n\nIn this data, the price of a gigaFLOPS falls by an order of magnitude roughly every four years (14 orders of magnitude in 54 years is 3.9 years per order of magnitude). Since 1997, each order of magnitude only took three years (5.7 orders of magnitude in 18 years). Note that there is very little data before 1997.\n\n\n[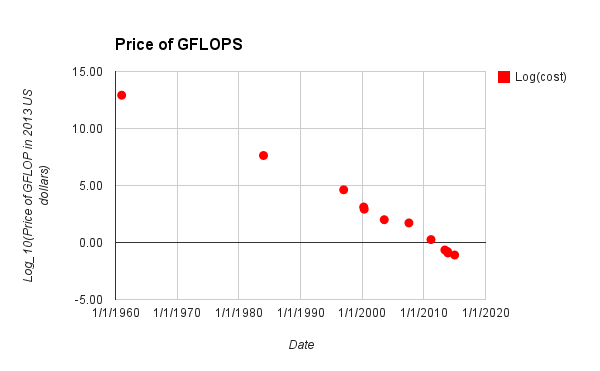](http://aiimpacts.org/wp-content/uploads/2014/12/price-of-gflops.png)**Figure 6:** Price of GFLOPS in different years according to Wikipedia, adjusted to 2013 US dollars.\n\n\n### Short term trends\n\n\n*Main article:* [***Recent trends in the cost of computing***](http://aiimpacts.org/recent-trend-in-the-cost-of-computing/)\n\n\nThe cheapest hardware prices (for single precision FLOPS/$) are on track to fall by around an order of magnitude every 10-16 years, based on data from around 2011-2017. There was no particular sign of slowing between 2011 and 2017.\n\n\nSummary\n-------\n\n\nWe have looked at four efforts to measure long term hardware price performance trajectories. Two of them are based on Moravec’s earlier effort, while the other two appear to be more independent (though we suspect still draw on similar sources). Two investigations measured (G)FLOPS, two measured MIPS, and one measured MSOPS.\n\n\nResults seem fairly consistent in recent decades, and for MIPS/$ in the longer run. There is insufficient data on FLOPS in the long run to check consistency. All four estimates of growth later than the 1990s produce 3.5-4 years as the time for price performance to to grow an order of magnitude (we did not include an estimate for recent years from Sandberg and Bostrom’s FLOPS data, since they did not make one and it was not straightforward to make one ourselves).[1](https://aiimpacts.org/trends-in-the-cost-of-computing/#easy-footnote-bottom-1-448 \"This is consistent with Sandberg and Bostrom’s estimate of the relationship between FLOPS and MIPS: ‘Fitting a relationship suggests that FLOPS scales as MIPS to the power of 0.89, i.e. slightly slower than unity’ (p89).\") Though note that these measures are from different spans within that period, and use different benchmarks (two were MIPS, one FLOPS, one MSOPS). Only Rieber and Muehlhauser and Wikipedia have data after 2002. Though they give similar recent growth figures, it is not clear how consistent they are: Rieber and Muehlhauser’s data appears to decline sharply in the last few years, and appears to only use CPUs, while the Wikipedia data is fairly even, and moves to GPUs in later years.\n\n\nIf we take an MSOPS to be more or less equivalent to a MIPS (as Nordhaus claims), then growth in MIPS since the 1940s is fairly consistent across studies, gaining an order of magnitude roughly every 5 years (Nordhaus), 5 years (Rieber and Muehlhauser) or 5.6 years (Sandberg and Bostrom). Note that the former two draw on similar data.\n\n\nOur two estimates of long run growth in FLOPS/$ differ substantially: we have gained an order of magnitude either every 4 years or every 7.7 years. However the four year estimate comes from Wikipedia, which only has two entries prior to 1990, while Sandberg and Bostrom have on the order of hundreds of entries from that period. Thus we rely on Sanberg and Bostrom here, and estimate FLOPS grow by an order of magnitude every 7.7 years.\n\n\nPrior to the 1940s, growth appears to be ambiguous and small. It looks like 2.4 orders of magnitude over forty eight years in Rieber and Muehlhauser’s figure, for an order of magnitude every 20 years. Nordhaus measures it as negative.\n\n\nFurther work\n------------\n\n\nFurther work on this subject might:\n\n\n* Check Moravec’s data, as it appears to be widely cited and reused (perhaps just check consistency between the fraction of data from Moravec and that added later from another source in existing datasets).\n* Separate different types of computers (e.g. treat desktop CPUs, supercomputers, and GPUs separately)\n* Find other datasets and analyses\n* Combine all of the datasets into one\n* Produce more relevant data\n* Construct and measure a more relevant benchmark\n", "url": "https://aiimpacts.org/trends-in-the-cost-of-computing/", "title": "Trends in the cost of computing", "source": "aiimpacts.org", "source_type": "wordpress", "date_published": "2015-03-10T22:15:38+00:00", "paged_url": "https://aiimpacts.org/feed?paged=22", "authors": ["Katja Grace"], "id": "1d6a22777639d966499ee5ed1f3411b9", "summary": []}
{"text": "What’s up with nuclear weapons?\n\n*By Katja Grace, 27 February 2015*\n\n\nWhen nuclear weapons were first built, the explosive power you could extract from a tonne of explosive [skyrocketed](http://aiimpacts.org/discontinuity-from-nuclear-weapons/ \"Discontinuity from Nuclear Weapons\"). But why?\n\n\nHere’s a guess. Until nuclear weapons, explosives were based on chemical reactions. Whereas nuclear weapons are based on nuclear reactions. As you can see from the below table of specific energies and energy densities I got (and innocuously shortened) from [Wikipedia](http://en.wikipedia.org/wiki/Energy_density#Energy_densities_of_common_energy_storage_materials), the characteristic scale of nuclear energy stored in things is about a hundred thousand times higher than that of chemical energy stored in things (by mass). And in particular, there are an empty three orders of magnitude between the most chemical energy packed into a thing and the least nuclear energy packed into a thing. This is perhaps to do with the [fact](http://environ.andrew.cmu.edu/m3/s3/06forces.shtml) that chemical reactions exploit the electromagnetic force, while nuclear reactions exploit the strong fundamental force.\n\n\n\n\n| Storage material | Energy type | Specific energy (MJ/kg) | Energy density (MJ/L) | Direct uses |\n| --- | --- | --- | --- | --- |\n| **[Uranium](http://en.wikipedia.org/wiki/Uranium \"Uranium\") (in [breeder](http://en.wikipedia.org/wiki/Breeder_reactor \"Breeder reactor\"))** | [Nuclear](http://en.wikipedia.org/wiki/Nuclear_power \"Nuclear power\") fission | 80,620,000[[2]](http://en.wikipedia.org/wiki/Energy_density#cite_note-whatisnuclear-2) | 1,539,842,000 | Electric power plants (nuclear reactors), industrial process heat (to drive chemical reactions, water desalination, etc.) |\n| **[Thorium](http://en.wikipedia.org/wiki/Thorium-based_nuclear_power \"Thorium-based nuclear power\") (in [breeder](http://en.wikipedia.org/wiki/Breeder_reactor \"Breeder reactor\"))** | [Nuclear](http://en.wikipedia.org/wiki/Nuclear_power \"Nuclear power\") fission | 79,420,000[[2]](http://en.wikipedia.org/wiki/Energy_density#cite_note-whatisnuclear-2) | 929,214,000 | Electric power plants (nuclear reactors), industrial process heat |\n| **[Tritium](http://en.wikipedia.org/wiki/Tritium#Decay \"Tritium\")** | [Nuclear](http://en.wikipedia.org/wiki/Nuclear_power \"Nuclear power\") decay | 583,529 | ? | Electric power plants (nuclear reactors), industrial process heat |\n| **[Hydrogen (compressed)](http://en.wikipedia.org/wiki/Compressed_hydrogen \"Compressed hydrogen\")** | [Chemical](http://en.wikipedia.org/wiki/Chemical_energy#Chemical_energy \"Chemical energy\") | 142 | 5.6 | Rocket engines, automotive engines, grid storage & conversion |\n| **[methane](http://en.wikipedia.org/wiki/Methane \"Methane\") or [natural gas](http://en.wikipedia.org/wiki/Natural_gas \"Natural gas\")** | [Chemical](http://en.wikipedia.org/wiki/Chemical_energy#Chemical_energy \"Chemical energy\") | 55.5 | 0.0364 | Cooking, home heating, automotive engines, lighter fluid |\n| **[Diesel](http://en.wikipedia.org/wiki/Diesel_fuel \"Diesel fuel\") / [Fuel oil](http://en.wikipedia.org/wiki/Fuel_oil \"Fuel oil\")** | Chemical | 48 | 35.8 | Automotive engines, power plants[[3]](http://en.wikipedia.org/wiki/Energy_density#cite_note-AFDC-3) |\n| **[LPG](http://en.wikipedia.org/wiki/Liquefied_petroleum_gas \"Liquefied petroleum gas\") (including [Propane](http://en.wikipedia.org/wiki/Propane \"Propane\")/ [Butane](http://en.wikipedia.org/wiki/Butane \"Butane\"))** | Chemical | 46.4 | 26 | Cooking, home heating, automotive engines, lighter fluid |\n| **[Jet fuel](http://en.wikipedia.org/wiki/Jet_fuel \"Jet fuel\")** | Chemical | 46 | 37.4 | Aircraft |\n| **[Gasoline](http://en.wikipedia.org/wiki/Gasoline \"Gasoline\") (petrol)** | Chemical | 44.4 | 32.4 | Automotive engines, power plants |\n| **[Fat](http://en.wikipedia.org/wiki/Fat \"Fat\") (animal/vegetable)** | Chemical | 37 | 34 | Human/animal nutrition |\n| **[Ethanol fuel](http://en.wikipedia.org/wiki/Ethanol_fuel \"Ethanol fuel\")** (E100) | Chemical | 26.4 | 20.9 | Flex-fuel, racing, stoves, lighting |\n| **[Coal](http://en.wikipedia.org/wiki/Coal \"Coal\")** | Chemical | 24 | | Electric power plants, home heating |\n| **[Methanol fuel](http://en.wikipedia.org/wiki/Methanol_fuel \"Methanol fuel\")** (M100) | Chemical | 19.7 | 15.6 | Racing, model engines, safety |\n| **[Carbohydrates](http://en.wikipedia.org/wiki/Carbohydrate \"Carbohydrate\")(including sugars)** | Chemical | 17 | | Human/animal nutrition |\n| **[Protein](http://en.wikipedia.org/wiki/Protein_in_nutrition \"Protein in nutrition\")** | Chemical | 16.8 | | Human/animal nutrition |\n| **[Wood](http://en.wikipedia.org/wiki/Wood_fuel \"Wood fuel\")** | Chemical | 16.2 | | Heating, outdoor cooking |\n| **[TNT](http://en.wikipedia.org/wiki/Trinitrotoluene \"Trinitrotoluene\")** | Chemical | 4.6 | | Explosives |\n| **[Gunpowder](http://en.wikipedia.org/wiki/Gunpowder \"Gunpowder\")** | Chemical | 3 | | Explosives |\n| | | | | |\n\n\nThus it seems very natural that the first, lousiest, nuclear weapons that anyone could invent would be much more explosive than any chemical weapon ever known. The power of explosives is mostly a matter of physics, and physics contains discontinuities, for some reason.\n\n\nBut this doesn’t quite explain it. Consider cars. Turbojet propelled cars seem just fundamentally capable of greater speeds than internal combustion engine propelled cars. But the first [turbojet cars](https://aiimpacts.org/feed/ed_record#1963.E2.80.93present_.28jet_and_rocket_propulsion.29) that were faster than internal combustion cars were not much faster—it looks like they just had a steeper trajectory, which passed other cars and kept climbing. I’m not sure what caused this pattern in the car case specifically, but I hear it’s common. Maybe people basically know what current technology is capable of, and introduce new things as soon as they can be done at all, rather than as soon as they can be done well.\n\n\nAnyway, we could imagine the same thing happening with nuclear weapons: even if nuclear power was fundamentally very powerful, the first nukes could have made use of it very badly, exploding like a weak chemical explosive the first times, but being quickly improved.\n\n\nBut that isn’t how nuclear weapons work. For a nuclear weapon to be less explosive per mass it would need to contain less fissile material, be smaller (so the outside casing is more of the mass, and so that fewer neutrons hit other atoms), or be less well contained (so fewer neutrons hit other atoms). But to get a nuclear explosion going at all, you need to get enough neutrons to hit other atoms that the chain reaction starts. Nuclear weapons have a ‘[critical mass](http://en.wikipedia.org/wiki/Critical_mass)‘. I’m not sure how much less powerful the first nuclear weapons could easily have been than they were, but measly inexplosive nuclear weapons were basically out.\n\n\nSo the first nuclear weapons had to be much more explosive than the chemical explosives they replaced, because they were based on much more powerful reactions, and primitive nuclear weapons weren’t an option.\n\n\nSo nuclear weapons were basically guaranteed to revolutionize explosives in a single hop: even if humanity had known about nuclear reactions for hundreds of years, and put a tiny amount of effort into nuclear weapons research each year, humanity would never have seen feeble, not-much-better-than-TNT type nuclear weapons. There would just have been no nuclear weapons, and then at some point there would have been powerful nuclear weapons.\n\n\nIt is somewhat interesting that this is not what happened. Physicists mostly came to believe nuclear weapons were plausible from about 1939, and within a few years America spent nominal [$19Bn](http://blog.nuclearsecrecy.com/2013/05/17/the-price-of-the-manhattan-project/) (roughly 1% of [1943 GDP](http://useconomy.about.com/od/GDP-by-Year/a/US-GDP-History.htm), but spread over a few years) on nuclear weapons, and built some. So our story is that progress in explosives was very slow, and then America spent a huge pile of money on it, and then it was very fast, but the progress was independent of the massive influx of funding.\n\n\nThat sounds surprising. But perhaps the influx of funding was *because of* the large natural discontinuity visible in the distance? Why would you ever spend small amounts of money every year, if it was clear at the outset that you had to spend a gajillion dollars to get anywhere? If there wasn’t much requirement for serial activities, probably you would just save it up and spend it in one go. America didn’t save it up though—they tried to build nuclear weapons basically as soon as they realized it was feasible at all. So it looks like nuclear weapons were just discovered after it was cost-effective to build them.\n\n\nBut if it was immediately cost-effective to build nuclear weapons thousands of times more powerful than other bombs, then isn’t the requirement that nuclear weapons be fairly powerful irrelevant to the spending? If it was worth building powerful bombs immediately, then what does it matter if it is possible to build lesser weapons? Not really, because cost-effectiveness is relative. If is only possible to buy toothpaste in a large bucket, you will probably pay for it, and it will have been a good deal. However if it’s also available in small tubes, then the same bucket is probably a bad deal.\n\n\nSimilarly, if nuclear weapons must be powerful, then there’s a decent chance that as soon as they are discovered it will be cost-effective to spend a lot on them and make them so. However if they can come in many lower levels of quality, the same large amount of spending may not be cost effective, because it will often be better to spend an intermediate amount.\n\n\nSo a requirement that nuclear weapons be very explosive when they are first built could at least partly explain the huge amount of spending. And the inherently large amounts of energy available from nuclear reactions still seems relevant: any given amount of development will be cost-effective when it is more costly, if it is more effective compared to the alternative.\n\n\nThis also appears to fit in with an explanation of the further coincidence that there happened to be a huge war at the time. That is, the war made all military technologies more cost-effective, and thus made it more likely that when nuclear weapons became feasible to develop, they would already be cost-effective. However the war also makes it more likely that high quality weapons would already be cost-effective compared to cheaper counterparts, thus partly undermining the proposal that the large expenditure was due in part to nuclear weapons requiring a minimal level of quality.\n\n\nHere’s another plausible explanation for the large expense: because of their extreme explosiveness, nuclear weapons were very cost-effective at the time they were first considered. That is, they could have been produced a lot more cheaply than they were. However, due to the war, America was willing to pay a lot to make them come faster. In particular, America was willing to keep paying to make them come faster up until the point when they were roughly as cost-effective as older weapons, taking into account the upfront cost of making them come faster. This would explain the large amount of spending, and perhaps also why it aligned so well with what America could barely afford. It also explains why nuclear weapons appear to have been very roughly as cost-effective as older weapons. However on its own, it seems to leave the large amount of spending and the large amount of progress as coincidences.\n\n\nIn other ways, this story is in line with what I know about the development of nuclear weapons. For instance, that enriching uranium via several different methods in parallel was [around half](http://blog.nuclearsecrecy.com/2013/05/17/the-price-of-the-manhattan-project/) of the cost of the Manhattan project, and that the project was a lot more expensive than other countries’ later nuclear weapons projects.\n\n\nPerhaps the inherent explosiveness of nuclear weapons made them very cost-effective, and thus able to be sped up a lot and still be cost-effective? (Thus connecting the expense with the explosiveness) But if nuclear weapons had been too expensive already to speed up much, it seems we would have seen a similar amount of spending (or more) over a somewhat longer time. So on this story it seems the heavy spending didn’t cause the high explosiveness, and the high explosiveness (and thus cheapness) didn’t seem to cause the steep spending.\n\n\nIt seems there was probably one coincidence however: a physics discovery leading to weapons of unprecedented power was made just before the largest war in history, and it’s hard to see how the war and the discovery were related, unless history was choreographed to make Leo Szilard’s life interesting. Perhaps the weapons and the war are related because nuclear weapons caused us to think of WWII as a large war by averting later wars? But the World Wars [really were quite large](http://en.wikipedia.org/wiki/List_of_wars_and_anthropogenic_disasters_by_death_toll) compared to wars in slightly earlier history, rather than just the last in a trend of growing conflicts. If there is at least one coincidence anyway, perhaps it doesn’t matter whether the massive expense is explained by the unique qualities of nuclear weapons or merely by the war inspiring haste.\n\n\nIn sum, my guesses: nuclear weapons represented abrupt progress in explosiveness because of a discontinuity inherent in physics, and because ineffective nuclear weapons weren’t feasible. Coincidentally, at the same time as nuclear weapons were discovered, there was a large war. America spent a lot on nuclear weapons for a combination of reasons. Nuclear explosions were inherently unusually powerful, and so could be cost-effective while still being very expensive. They also required investment on a large scale, so were probably invested in at an unusually large scale. America probably also spent a lot more on nuclear weapons to get them quickly, because they were so cost-effective under the circumstances.\n\n\nMy guesses are pretty speculative however, and I’m not an expert here. Further speculation, or well-grounded theorizing, is welcome.\n\n\n(image: *[Oak Ridge Y-12 Alpha Track](http://commons.wikimedia.org/wiki/File:Oak_Ridge_Y-12_Alpha_Track.jpg)*)\n\n", "url": "https://aiimpacts.org/whats-up-with-nuclear-weapons/", "title": "What’s up with nuclear weapons?", "source": "aiimpacts.org", "source_type": "wordpress", "date_published": "2015-02-27T08:07:44+00:00", "paged_url": "https://aiimpacts.org/feed?paged=22", "authors": ["Katja Grace"], "id": "1bc24011ad62a3f917462cbafe3d3092", "summary": []}
{"text": "Possible Empirical Investigations\n\nIn the course of our work, we have noticed a number of empirical questions which bear on our forecasts and might be (relatively) cheap to resolve. In the future we hope to address some of these.\n\n\n* [Our partial list of investigations into forecasting AI timelines](http://aiimpacts.org/research-topic-hardware-software-and-ai/ \"Research topic: Hardware, software and AI\")\n* [Our list of investigations that bear on ‘multipolar’ AI scenarios](http://aiimpacts.org/multipolar-research-projects/ \"List of multipolar research projects\")\n* Look at the work of ancient or enlightenment mathematicians and control for possible selection effects in [this analysis](https://sites.google.com/site/aiimpactslibrary/resolutions-of-mathematical-conjectures) of historical mathematical conjectures.\n* Look for historical characterizations of the AI problem, and try to obtain unbiased (though uninformed) breakdowns of the problem which could be used to gauge progress.\n* Identify previous examples of technological projects with clear long-term goals, and then produce estimates of the time required to achieve those goals to varying degrees.\n* Analyze the performance of different versions of software for benchmark problems, like SAT solving or chess, and determine the extent to which hardware and software progress facilitated improvement.\n* Obtain a clearer picture of the extent to which historical developments in neuroscience have played a meaningful role in historical progress in AI. Our impression is that this influence has been minimal, but this judgment might be attributable to hindsight bias.\n* In the field of AI, estimate the ratio of spending on hardware to spending on researchers.\n* Estimate the change in inputs in mathematicians, scientists, or engineers, as a complement to estimates for rates of progress in those fields.\n* Estimate the historical and present size of the AI field, ideally with plausible adjustments for quality (for example performing in-depth investigations for a small number of random samples, perhaps invoking expert opinion) and using these as a basis for quality-adjustments.\n* [Luke Muehlhauser](http://lukemuehlhauser.com/some-studies-which-could-improve-our-strategic-picture-of-superintelligence/) and the [Future of Life Institute](http://futureoflife.org/static/data/documents/research_survey.pdf)‘s section on forecasting both list further projects.\n\n\nUnfortunately this is an incomplete list (even of the ideas which have struck as promising during this project). We are beginning to flesh it out further in our aforementioned [list of projects bearing on AI timelines](http://aiimpacts.org/research-topic-hardware-software-and-ai/ \"Research topic: Hardware, software and AI\").\n\n", "url": "https://aiimpacts.org/possible-investigations/", "title": "Possible Empirical Investigations", "source": "aiimpacts.org", "source_type": "wordpress", "date_published": "2015-02-26T00:02:11+00:00", "paged_url": "https://aiimpacts.org/feed?paged=22", "authors": ["Katja Grace"], "id": "fba16fb28d68b7438bf975cedcbd843c", "summary": []}
{"text": "Research topic: Hardware, software and AI\n\nThis is the first in a sequence of articles outlining research which could help forecast AI development.\n\n\n\n\n---\n\n\nInterpretation\n--------------\n\n\nConcrete research projects are in boxes. ∑5 ∆8 means we guess the project will take (very) roughly five hours, and we rate its value (very) roughly 8/10.\n\n\nMost projects could be done to very different degrees of depth, or at very different scales. Our time cost estimates correspond to a size that we would be likely to intend if we were to do the project. Value estimates are merely ordinal indicators of worth, based on our intuitive sense, and unworthy of being taken very seriously.\n\n\n\n\n---\n\n\n \n\n\n1. How does AI progress depend on hardware and software?\n--------------------------------------------------------\n\n\nAt a high level, AI improves when people make better software, when they can run it on better hardware, when they gather bigger, better training sets, etc. This makes present-day hardware and software progress a natural place to look for evidence about when advanced AI will arrive. In order to interpret any such data however, it is important to know how these pieces fit together. For instance, is the progress we see now mostly driven by hardware progress, or software progress? Can the same level of performance usually be achieved by widely varying mixtures of hardware and software? Does progress on software depend on progress on hardware?\n\n\nIt is important to understand the relationship between hardware, software and AI for several reasons. If hardware progress is the main driver of AI progress, then quite different evidence would tell us about AI timelines than if software is the main driver. Thus different research is valuable, and different timelines are likely. Many people base their AI predictions on hardware progress, while others decline to, so it would be broadly useful to know whether one should. We also expect understanding here to be generally useful.\n\n\nSo we think research in this direction seems valuable. We also think several projects seem tractable. Yet little appears to have been done in this direction. Thus this topic seems a high priority.\n\n\n### 1.1 How does AI progress depend qualitatively on hardware and software progress?\n\n\nFor instance, will human-level AI appear when we have both a certain amount of hardware, and certain developments in software? Or can hardware and software substitute for one another? Substitution seems a natural model of the relationship between hardware and software, since anecdotally many tasks can be done by low quality software and lots of hardware, or by high quality software and less hardware. However the extent of this is unclear. This kind of model is also [not commonly used](http://aiimpacts.org/how-ai-timelines-are-estimated/ \"How AI timelines are estimated\") in estimating [AI timelines](http://aiimpacts.org/list-of-analyses-of-time-to-human-level-ai/ \"List of Analyses of Time to Human-Level AI\"), so judging whether it should be might be a useful contribution. Having a good model would also bear on the priority of other research directions. As far as we know, this issue has received almost no attention. It seems moderately tractable.\n\n\n\n> **1.1.A Evaluate qualitative models of the relationships between hardware, software and AI** ∑30 ∆5 \n> \n> One way to approach the question of qualitative relationships is to assume some model, and work on projects such as those in 1.2 that measure quantitative details of the model, then revise the model if the measurements don’t make sense in it. Before that step, we might spend a short time detailing plausible models, and examining empirical and theoretical evidence we might already have, or could cheaply find. If we were going to follow up with empirical research, we would think about what evidence we would expect the research to reveal, given alternative models. \n> \n> ~ \n> \n> For instance, we find the hardware-software [indifference curve](http://en.wikipedia.org/wiki/Indifference_curve) model described briefly above (and outlined better in a [blog post](http://aiimpacts.org/how-ai-timelines-are-estimated/ \"How AI timelines are estimated\")) plausible. Here are some ways it might be inadequate, that we might consider in evaluating it:\n> \n> \n> * ‘Hardware’ and ‘software’ are not sufficiently measurable entities for a ‘level’ of each in some domain to produce a stable level of performance.\n> * Performance depends strongly on other factors, e.g. exactly what kind of hardware and software progress you make, unique details of the software being developed, training data available.\n> * Different problem types, and different performance metrics on them have different kinds of behavior\n> * There are ‘indifference curves’ in a sense but they are not sufficiently consistent to be worth reasoning about.\n> * Humanity’s technological progress is not well characterized by an expanding rectangle of feasible hardware and software levels, but more as a complicated region of feasible combinations.\n> \n> \n> \n\n\n### 1.2 How much do marginal hardware and software improvements alter AI performance?\n\n\nAs mentioned above, this question is key to determining which other investigations are worthwhile. Naturally, it could also change our timelines substantially. Thus this question seems thus important to resolve. We think the projects here are particularly tractable, though not particularly cheap. For all of these projects, we would probably choose a specific set of benchmarks on particular problems to focus on. We might do multiple of these projects on the same set of benchmarks, to trace a more complete picture.\n\n\n\n> **1.2.A Search for natural experiments combining modern hardware and early software approaches or vice versa.**∑80 ∆7 \n> \n> For instance, we might find early projects with very large hardware budgets, or recent projects with [intentionally restricted hardware](http://1kchess.an3.es/). Where these were tested on commonly used benchmarks, we can use them to map out the broad contributions of hardware and software to progress. For instance, if very small chess programs today run better than old chess programs which used similar (but then normal) amounts of hardware, then the difference between them can be attributed to improving software, roughly.\n> \n> \n\n\n\n> **1.2.B Apply a modern understanding of software to early hardware** ∑2,000 ∆9 \n> \n> Choose a benchmark problem that people worked on in the past, e.g. in the 1980s. Use a modern understanding of AI to solve the problem again, still using 1980’s hardware. Compare this to how researchers did in the 1980’s. This project requires substantial time from at least one AI researcher. Ideally they would spend a similar amount of effort as the past researchers did, so it may be worth choosing a problem where it is known that an achievable level of effort was applied in the past.\n> \n> \n\n\n\n> **1.2.C Apply early software understanding to modern hardware** ∑2,000 ∆8 \n> \n> Using contemporary hardware and a 1970’s or 1980’s understanding of connectionism, observe the extent to which a modern AI researcher (or student) could replicate contemporary performance on benchmark AI problems. This project is relatively expensive, among those we are describing. It requires substantial time from collaborators with a historically accurate minimal understanding of AI. Students may satisfy this role well, if their education is incomplete in the right ways. One might compare to the work of similar students who had also learned about modern methods.\n> \n> \n\n\n\n> **1.2.D Measure marginal effects of hardware and software in existing performance trends** ∑100 ∆8 \n> \n> Often the same software can be used with modest changes in hardware, so changes in performance from hardware over small margins can be measured. Improved software is also often written to be run on the same hardware as earlier software, so changes in performance from software alone can be measured over moderate margins. Thus we can often estimate these marginal changes from looking at existing performance measurements. \n> \n> ~ \n> \n> We can also look at overall progress over time on some applications, and factor out what we know about hardware or software change, assuming it is close to the marginal values measured by the above methods. For instance, we can see how much individual Go programs improve with more hardware, and then we can look at longer term improvements in computer Go, and guess how much of that improvement came from hardware, given our earlier estimate of marginal improvement from hardware. In general these estimates will be less valid over larger distances, as the impact of hardware or software diverge from their marginal impact, and because arbitrary of hardware and software can’t generally be combined without designing the software to make use of the hardware. [Grace 2013](http://intelligence.org/files/AlgorithmicProgress.pdf) includes some work this project.\n> \n> \n\n\n\n> **1.2.E Interview AI researchers on the relative importance of hardware and software in driving the progress they have seen.** ∑20 ∆7 \n> \n> AI researchers likely have firsthand experience regarding how hardware and software contribute to overall progress within the vicinity of their own work. This project will probably give relatively noisy estimates, but is very cheap compared to others described here. One could just ask for views on this question, and supporting anecdotes, or devise a more structured questionnaire beforehand.\n> \n> \n\n\n### 1.3 How do hardware and software progress interact?\n\n\nDo hardware and software progress relatively independently, or for instance do advances in hardware encourage advances in software? This might change how we generally expect software progress to proceed, and what combinations of hardware and software we expect to first produce human-level AI. We are likely to get some information about this from other projects looking at historical performance data e.g. 1.2.D. For instance, if overall progress is generally proportional to hardware progress, even as hardware progress varies, then this would be suggestive. Below are further possibilities.\n\n\n\n> **1.3.A Find natural experiments**∑80 ∆4 \n> \n> Search for performance data from cases where hardware being used for an application was largely constant then shifted upward at some point. Such cases are probably hard to find, and hard to interpret when found. However, a short search for them may be worthwhile.\n> \n> \n\n\n\n> **1.3.B Interview researchers** ∑20 ∆7 \n> \n> If hardware tends to affect software research, it is likely that researchers notice this, and can talk about it. This seems a cheap and effective method of learning qualitatively about the topic. This project should probably be combined with 1.2.E.\n> \n> \n\n\n\n> **1.3.C Consider plausible models** ∑10 ∆5 \n> \n> This is a short theoretical project that would benefit from being done in concert with 1.3.B (interview researchers), since researchers probably have a relatively good understanding of which models are plausible, and we are likely to ask better questions of them if we have thought about the topic. This project should probably be combined with 1.1.A.\n> \n> \n\n", "url": "https://aiimpacts.org/research-topic-hardware-software-and-ai/", "title": "Research topic: Hardware, software and AI", "source": "aiimpacts.org", "source_type": "wordpress", "date_published": "2015-02-20T05:10:27+00:00", "paged_url": "https://aiimpacts.org/feed?paged=22", "authors": ["Katja Grace"], "id": "8ef0ca7907dfd706bfeb55fa226d9c90", "summary": []}
{"text": "Multipolar research questions\n\n*By Katja Grace, 11 February 2015*\n\n\nThe [Multipolar AI workshop](http://aiimpacts.org/event-multipolar-ai-workshop-with-robin-hanson/ \"Event: Multipolar AI workshop with Robin Hanson\") we ran a fortnight ago went well, and we just put up a [list of research projects](http://aiimpacts.org/multipolar-research-projects/ \"List of multipolar research projects\") from it. I hope this is helpful inspiration to those of you thinking about applying to the new [FLI grants](http://futureoflife.org/grants/large/initial) in the coming weeks.\n\n\nThanks to the many participants who contributed ideas!\n\n\n*(Image by [Evan Amos](http://en.wikipedia.org/wiki/Colored_pencil#/media/File:Colored-Pencils.jpg))*\n\n", "url": "https://aiimpacts.org/multipolar-research-questions/", "title": "Multipolar research questions", "source": "aiimpacts.org", "source_type": "wordpress", "date_published": "2015-02-11T19:29:02+00:00", "paged_url": "https://aiimpacts.org/feed?paged=23", "authors": ["Katja Grace"], "id": "386ba0d93f8c6be140ab95f374440e87", "summary": []}
{"text": "List of multipolar research projects\n\nThis list currently consists of research projects suggested at the [Multipolar AI workshop](http://aiimpacts.org/event-multipolar-ai-workshop-with-robin-hanson/ \"Event: Multipolar AI workshop with Robin Hanson\") we held on January 26 2015.\n\n\nRelatively concrete projects are marked [concrete]. These are more likely to already include specific questions to answer and feasible methods to answer them with. Other ‘projects’ are more like open questions, or broad directions for inquiry.\n\n\nProjects are divided into three sections:\n\n\n1. Paths to multipolar scenarios\n2. What would happen in a multipolar scenario?\n3. Safety in a multipolar scenario\n\n\nOrder is not otherwise relevant. The list is an inclusive collection of the topics suggested at the workshop, rather than a prioritized selection from a larger list.\n\n\nLuke Muehlhauser’s [list of ‘superintelligence strategy’ research questions](http://lukemuehlhauser.com/some-studies-which-could-improve-our-strategic-picture-of-superintelligence/) contains further suggestions.\n\n\nList\n----\n\n\n### Paths to multipolar scenarios\n\n\n**1.1 If we assume that AI software is similar to other software, what can we infer from observing contemporary software development? [concrete]**For instance, is progress in software performance generally smooth or jumpy? What is the distribution? What are typical degrees of concentration among developers? What are typical modes of competition? How far ahead does the leading team tend to be to their competitors? How often does the lead change? How much does a lead in a subsystem produce a lead overall? How much do non-software factors influence who has the lead? How likely is a large player like Google—with its pre-existing infrastructure—to be the frontrunner in a random new area that they decide to compete in?\n\n\nA large part of this project would be collecting what is known about contemporary software development. This information would provide one view on how AI progress might plausibly unfold. Combined with several such views, this might inform predictions on issues like abruptness, competition and involved players.\n\n\n**1.2 If the military is involved in AI development, how would that affect our predictions? [concrete]**This is a variation on 1.1, and would similarly involve a large component of reviewing the nature of contemporary military projects.\n\n\n**1.3 If industry were to be largely responsible for AI development, how would that affect our predictions? [concrete]**This is a variation on 1.2, and would similarly involve a large component of reviewing the nature of contemporary industrial projects.\n\n\n**1.4** **If academia were to be largely responsible for AI development, how would that affect our predictions? [concrete]**This is a variation on 1.2, and would similarly involve a large component of reviewing the nature of contemporary academic projects.\n\n\n**1.5 Survey AI experts on the likelihood of AI emerging in the military, business or academia, and on the likely size of a successful AI project. [concrete]**\n\n\n**1.6 Identify considerations that might tip us between multipolar and unipolar scenarios.**\n\n\n**1.7 To what extent will AGI progress be driven by developing significantly new ideas?**1.1 may bear on this. It could be approached in other ways, for instance asking AI researchers what they expect.\n\n\n**1.8 Run prediction markets on near-term questions, such as rates of AI progress, which inform our long-run expectations. **[concrete]****\n\n\n**1.9 Collect past records of ‘lumpiness’ of AI success. [concrete]** That is, variation in progress over time. This would inform expectations of future lumpiness, and thus potential for single projects to gain a substantial advantage.\n\n\n### What would happen in a multipolar scenario?\n\n\n**2.1 To what extent do values prevalent in the near-term affect the long run, in a competitive scenario?**One could consider the role of values over history so far, or examine the ways in which the role of values may change in the future. One could consider the degree of instrumental convergence between actors (e.g. firms) today, and ask how that affects long-term outcomes. One might also consider whether non-values mental features might become locked in in a way that produces similar outcomes to particular values being influential. e.g. priors or epistemological methods that make a particular religion more likely\n\n\n**2.2 What other factors in an initial scenario are likely to have long-lasting effects?** For instance social institutions, standards, and locations for cities.\n\n\n**2.3 What would AI’s value in a multipolar scenario?**We can consider a range of factors that might influence AI values:\n\n\n1. The nature of the transition to AI\n2. Prevailing institutions\n3. The extentto which AI values become static, as compared to changing human values\n4. What values do humans want AI’s to have\n5. Competitive dynamics\n\n\nThere is a common view that a multipolar scenario would be better in the long run than a hegemonic ‘unfriendly AI’. This project would inform that comparison.\n\n\n**2.4 What are the prospects for human capital-holders?**In a simple model, humans who own capital might become very wealthy during a transition to AI. On a classical economic picture, this would be a critical way for humans to influence the future. Is this picture plausible? Evaluate the considerations.\n\n\n1. What are the implications of capital holders doing no intellectual work themselves?\n2. **[concrete]** What does the existing literature on principal-agent problems suggest about multipolar AI scenarios?\n3. **[concrete]** Could humans maintain investments for significant periods of their lives, if during that time aeons of subjective time passes for faster moving populations? (i.e. is it plausible to expect to hold assets through millions of years of human history?) Investigate this via data on past expropriations\n\n\n**2.5 Identify risks distinctive to a multipolar scenario, or which are much more serious in a multipolar scenario.**\n\n\nFor instance:\n\n\n* Evolutionary dynamics bring an outcome that nobody desired initially\n* The AIs are not well integrated into human society, and consequently cause or allow destruction to human society\n* The AIs—integrated or not—have different values, and most of the resources end up being devoted to those values\n\n\n**2.6 Choose a specific multipolar scenario and try to predict its features in detail. [concrete]**Base this on the basic changes we know would occur (e.g. minds could be copied like software), and our best understanding of social science.\n\n\nSpecific instances:\n\n\n1. Brain emulations (Robin Hanson is working on this in an upcoming book)\n2. Brain emulations, without the assumption that software minds are opaque\n3. One can buy maximally efficient software for anything you want; everything else is the same\n4. AI is much like contemporary software (see 1.1).\n\n\n**2.7 How would multipolar AI change the nature and severity of violent conflict?** For instance, conflict between states.\n\n\n**2.8 Investigate the potential for AI-enforced rights.**Think about how to enforce property rights in a multipolar scenario, given advanced artificial intelligence to do it with, and the opportunity to prepare ahead of time. Can you create programs that just enforce deals between two parties, but do nothing else? If you create AI with this stable motivational structure, possessed by many parties, how does this change the way that agents that interact? How could such a system be designed?\n\n\n**2.9 What is the future of democracy in such a scenario?**In a world where resources can rapidly and cheaply be turned into agents, the existing assignment of a vote per person may be destructive and unstable.\n\n\n**2.10 How does the lumpiness of economic outcomes vary as a function of the lumpiness of origins?** For instance, if one team creates brain emulations years before others, would that group have and retain extreme influence?\n\n\n**2.11 What externalities can we foresee, in computer security?**That is, will people invest less (or more) in security than is socially optimal?\n\n\n**2.12 What externalities can we foresee in AI safety generally?**\n\n\n**2.13 To what extent can artificial agents make more effective commitments, or more effectively monitor commitments, than humans?** How does this change competitive dynamics? What proofs of properties of one’s source code may be available in the future?\n\n\n### Safety in a multipolar scenario\n\n\n**3.1 Assess the applicability of general AI safety insights to multipolar scenarios. [concrete]** How useful are capability control methods, such as boxing, stunting, incentives, or tripwires in a multi-polar scenario? How useful are motivation selection methods, such as direct specification, domesticity, indirect normatively, augmentation in a multipolar scenario?\n\n\n**3.2 Would selective pressures strongly favor the existence of goal-directed agents, in a multipolar scenario where a variety of AI designs are feasible?**\n\n\n**3.3 Develop a good model for the existing computer security phenomenon where nobody builds secure systems, though they can.** **[concrete]** Model the long-run costs of secure and insecure systems, given distributions of attacker sophistication and possibility for incremental system improvement. Determine the likely situation various future scenarios, especially where computer security is particularly important.\n\n\n**3.4 Do paradigms developed for nuclear security and biological weapons apply to AI in a multi-polar scenario? [concrete]** For instance, could similar control and detection systems be used?\n\n\n**3.5 What do the features of computer security systems tell us about how multipolar agents might compete?**\n\n\n**3.8 What policies could help create more secure computer systems?**For instance, the onus being on owners of systems to secure them, rather than on potential attackers to avoid attacking.\n\n\n**3.9 What innovations (either in AI or coinciding technologies) might reduce principal-agent problems?**\n\n\n**3.10 Apply ‘reliability theory’ to the problem of manufacturing trustworthy hardware.**\n\n\n**3.11 How can we transition in an economically viable way to hardware that we can trust is uncorrupted?**At present, we must assume that the hardware is uncorrupted upon purchase, but this may not be sufficient in the long run.\n\n\n \n\n", "url": "https://aiimpacts.org/multipolar-research-projects/", "title": "List of multipolar research projects", "source": "aiimpacts.org", "source_type": "wordpress", "date_published": "2015-02-11T18:54:51+00:00", "paged_url": "https://aiimpacts.org/feed?paged=23", "authors": ["Katja Grace"], "id": "8fa0d3a984c68b38ac5ac0f32de478d7", "summary": []}
{"text": "How AI timelines are estimated\n\n*By Katja Grace, 9 February 2015*\n\n\nA natural approach to informing oneself about when [human-level AI](http://aiimpacts.org/human-level-ai/ \"Human-Level AI\") will arrive is to check what experts who have already investigated the question say about it. So we made [this list](http://aiimpacts.wpengine.com/list-of-analyses-of-time-to-human-level-ai/ \"List of Analyses of Time to Human-Level AI\") of analyses that we could find.\n\n\nIt’s a short list, though the bar for ‘analysis’ was low. Blame for the brevity should probably be divided between our neglect of worthy entries and the world’s neglect of worthy research. Nonetheless we can say interesting things about the list.\n\n\nAbout half of the estimates are based on extrapolating hardware, usually to something like ‘human-equivalence’. A stylized estimate along these lines might run as follows:\n\n\n1. Calculate how much computation the brain does.\n2. Extrapolate the future costs for computing hardware (it goes downward, fast)\n3. Find the point in the computing hardware cost trajectory where brain-equivalent hardware (1) becomes pretty cheap, for some value of ‘pretty cheap’.\n4. Guestimate how long software will take once we have enough hardware; add this to the date produced in (3).\n5. The date produced in (4) is your estimate for human-level AI.\n\n\nHow solid is this kind of estimate? Let us consider it in a bit of detail.\n\n\n#### How much computation is a brain worth?\n\n\nIt is not trivial to estimate how much computation a brain does. A basic philosophical problem is that we don’t actually know what the brain is doing much, so it’s not obvious what part of its behavior is contributing to computation in any particular way. For instance (implausibly) if some of the neuron firing was doing computation, and the rest was just keeping the neurons prepared, we wouldn’t know. We don’t know how much detail of the neurons and their contents and surrounds is relevant to the information processing we are interested in.\n\n\n[Moravec (2009)](http://www.scientificamerican.com/article/rise-of-the-robots/) estimates how much computation the brain does by extrapolation from the retina. He estimates how much computing hardware would be needed for a computer to achieve the basic image processing that parts of the retina do, then multiplies this by how much heavier the brain is than parts of the retina. As he admits, this is a coarse estimate. I don’t actually have much idea how accurate you would expect this to be. Some obvious possible sources of inaccuracy are the retina being unrepresentative of the brain (as it appears to be for multiple reasons), the retina being capable of more than the processing being replicated by a computer, and mass being poorly correlated with capacity for computation (especially across tissue which is in different parts of the body).\n\n\nOne might straightforwardly improve upon this estimate by extrapolating from other parts of the brain in a similar way, or from calculating how much information could feasibly be communicated in patterns of neuron firing (assuming these were the main components contributing to relevant computation).\n\n\n#### The relationship between hardware and software\n\n\nSuppose that you have accurately estimated how much computation the brain does. The argument above treats this as a lower bound on when human-level intelligence will arrive. This appears to rest on a model in which there is a certain level of hardware and a certain level of software that you need, and when you have them both you will have human-level AI.\n\n\nIn reality, the same behavior can often be achieved with different combinations of hardware and software. For instance (as shown in figure 1), you can achieve the same Elo in Go using top of the range software (MoGo) and not much hardware (enough for 64 simulations) or weak software (FatMan) and much more hardware (enough for 1024 simulations, which probably take less hardware each than those used for the sophisticated program). The horizontal axis is doublings of hardware, but FatMan begins with much more hardware.\n\n\n[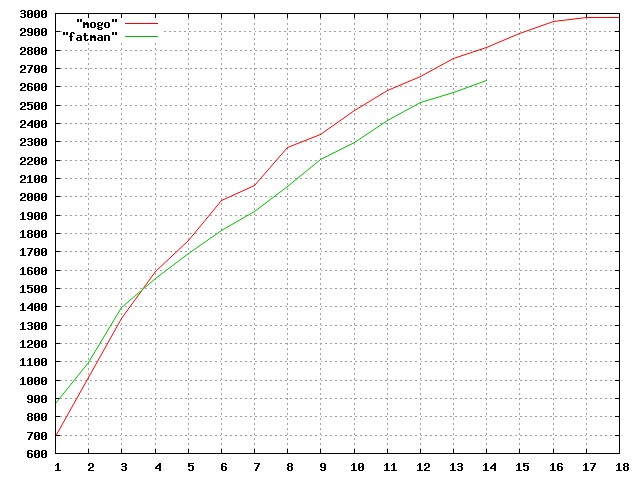](http://aiimpacts.org/wp-content/uploads/2015/02/go-hardware-software.jpg)Figure 1: [Performance](http://cgos.boardspace.net/study/) of strong Mogo and weak FatMan with successive doublings in hardware. Mogo starts out doing 64 simulations, and FatMan 1024. The horizontal axis is doublings of hardware, and the vertical axis is performance measured in Elo.\nIn Go we thus have a picture of indifference curves something like this:\n\n\n[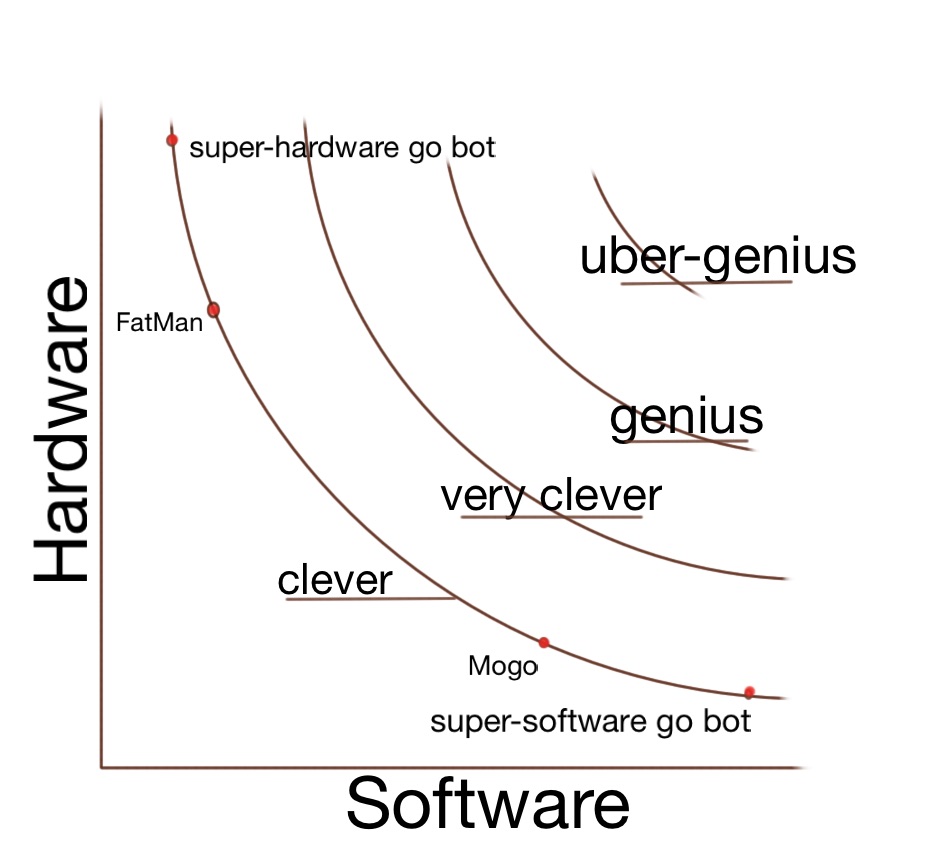](http://aiimpacts.org/wp-content/uploads/2015/02/hardware-software-indifference-copy.jpg)\n\n\n \n\n\nGo is not much like general intelligence, but the claim is that software in general has this character. If this is true, it suggests that the first human-level AI designed by human engineers might easily use much more or much less hardware than the human brain. This is illustrated in figure 3. Our trajectory of software and hardware progress could run into the frontier of human-level ability above or below human-level. If our software engineering is more sophisticated than that of evolution at the point where we hit the frontier, we would reach human-level AI with much less than ‘human-equivalent’ hardware.\n\n\n[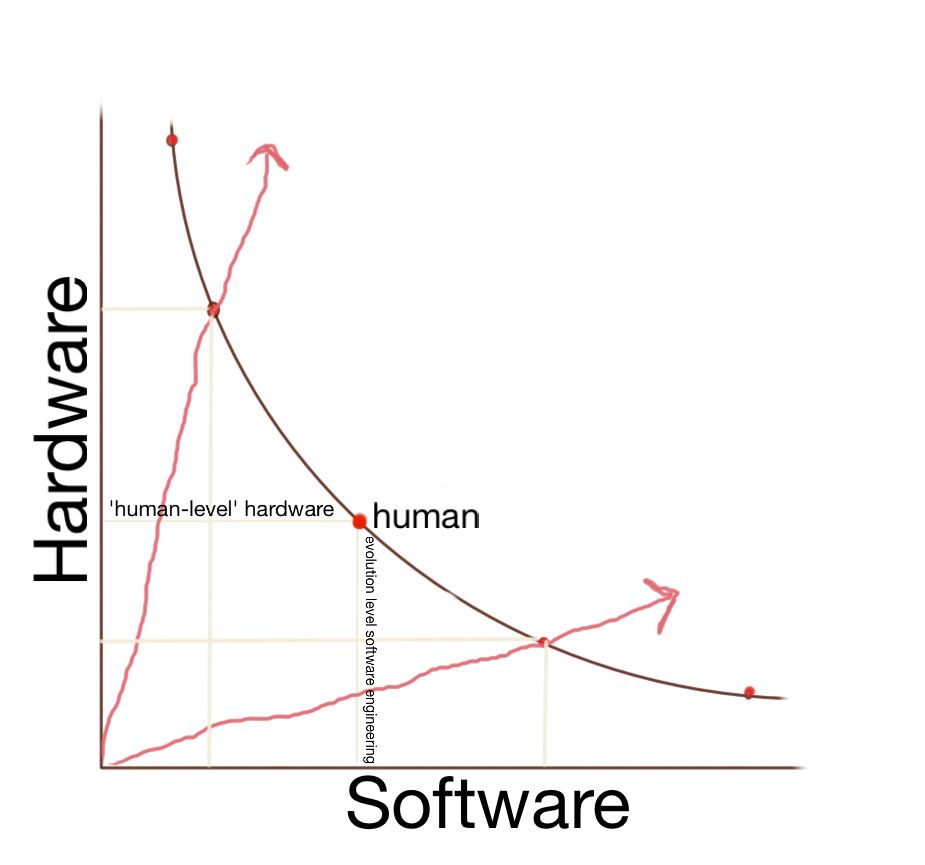](http://aiimpacts.org/wp-content/uploads/2015/02/hardware-software-indifference-2.jpg)Figure 3: two possible trajectories for human hardware and software progress, which achieve human-level intelligence (the curved line) with far more and far less hardware than humans require.\nAs an aside, if we view the human brain as a chess playing machine, an analog to the argument outlined earlier in the post suggests that we should achieve human-level chess playing at human-equivalent hardware. We in fact achieved it much earlier, because indeed humans can program a chess player more efficiently than evolution did when it programmed humans. This is obviously in part because the human brain was not designed to play chess, and is mostly for other things. However, it’s not obvious that the human brain was largely designed for artificial intelligence research either, suggesting economic dynamite such as this might also arrive without ‘human-level’ hardware.\n\n\nI don’t really know how good current human software engineering is compared to evolution, when they set their minds to the same tasks. I don’t think I have particularly strong reason to think they are about the same. Consequently, it seems I don’t seem to have strong reason to expect hardware equivalent to the brain is a particularly important benchmark (though if I’m truly indifferent between expecting human engineers to be better or worse, human-level hardware is indeed my median estimate).\n\n\nHuman equivalent hardware might be more important however: I said nothing about how hardware trades off against software. If the frontier of human-level hardware/software combinations is more like that in figure 4 below than figure 3, a very large range of software sophistication corresponds to human-level AI occurring at roughly similar levels of hardware, which means at roughly similar times. If this is so, then the advent of human-level hardware is a good estimate for when AI will arrive, because AI would arrive around then for a large range of levels of software sophistication.\n\n\n[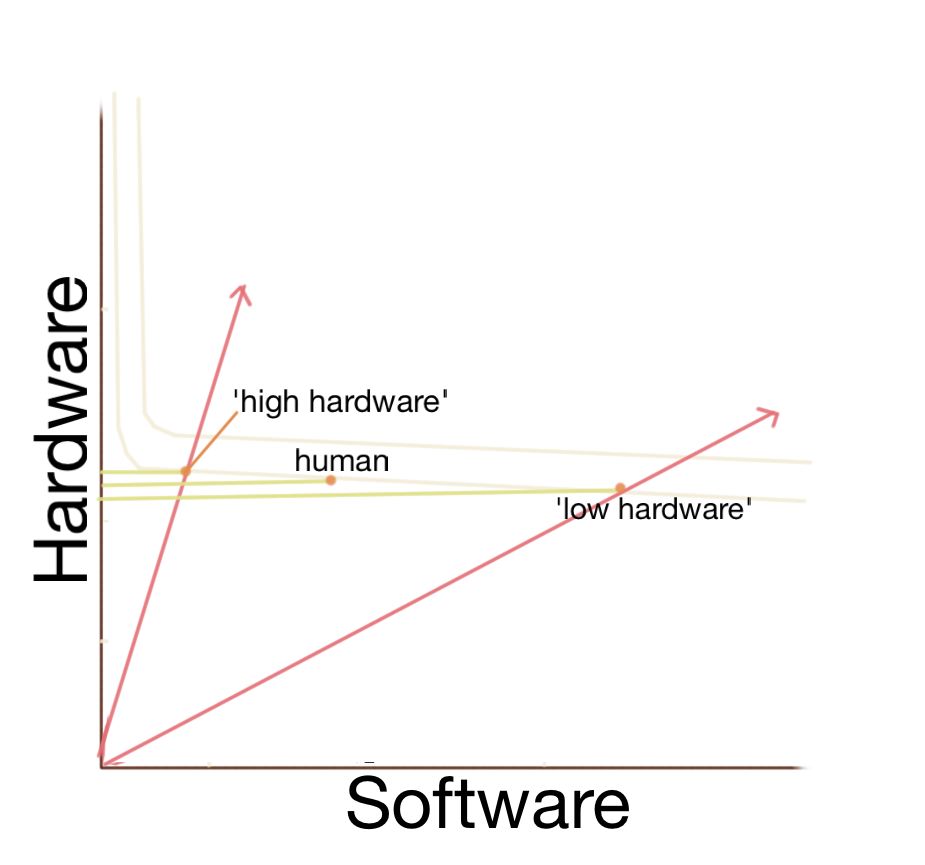](http://aiimpacts.org/wp-content/uploads/2015/02/hardware-software-indifference-21.jpg)Figure 4: If it takes a lot of software sophistication to replace a small amount of hardware, the amount of hardware that is equivalent to a human brain may be roughly as much as is needed for many plausible designs.\nThe curve could also look opposite however, with the level of software sophistication being much more important than available hardware. I don’t know of strong evidence either way, so for now the probability of human-level AI at around the time we hit human-level hardware only seems moderately elevated.\n\n\nThe shape of the hardware/software frontier we have been discussing could be straightforwardly examined for a variety of software, using similar data to that presented for Go above. Or we might find that this ‘human-level frontier’ picture is not a useful model. The general nature of such frontiers seem highly informative about the frontier for advanced AI. I have not seen such data for anything other than parts of it for chess and Go. If anyone else is aware of such a thing, I would be interested to see it.\n\n\n#### Costs\n\n\nWill there be human-level AI when sufficient hardware (and software) is available at the cost of a supercomputer? At the cost of a human? At the cost of a laptop?\n\n\nPrice estimates used in this kind of calculation often seem to be chosen to be conservative—low prices so that the audience can be confident that an AI would surely be built if it were that cheap. For instance, [when](http://futureoflife.org/PDF/rich_sutton.pdf) will human-level hardware be available for $1,000? While this is helpful for establishing an upper bound on the date, it does not seem plausible as a middling estimate. If human-level AI could be built for a million dollars instead of a thousand, it would still be done in a flash, and this corresponds to a difference of around [fifteen years](http://futureoflife.org/PDF/rich_sutton.pdf).\n\n\nThis is perhaps the easiest part of such an estimate to improve, with a review of how much organizations are generally willing to spend on large, valuable, risky projects.\n\n\n\\*\\*\\*\n\n\nIn sum, this line of reasoning seems to be a reasonable start. As it stands, it probably produces wildly inaccurate estimates, and appears to be misguided in its implicit model of how hardware and software relate to each other. However it is a good beginning that could be incrementally improved into a fairly well informed estimate, with relatively modest research efforts. Which is just the kind of thing one wants to find among previous efforts to answer one’s question.\n\n\n \n\n\n \n\n\n \n\n\n \n\n", "url": "https://aiimpacts.org/how-ai-timelines-are-estimated/", "title": "How AI timelines are estimated", "source": "aiimpacts.org", "source_type": "wordpress", "date_published": "2015-02-09T15:00:32+00:00", "paged_url": "https://aiimpacts.org/feed?paged=23", "authors": ["Katja Grace"], "id": "ba5594a778189e4ba4561668d68d683a", "summary": []}
{"text": "At-least-human-level-at-human-cost AI\n\n*By Katja Grace, 7 February 2015*\n\n\n[Often](http://wiki.lesswrong.com/wiki/Interview_series_on_risks_from_AI), when people are asked ‘when will human-level AI arrive?’ they suggest that it is a meaningless or misleading term. I think they have a point. Or several, though probably not as many as they think they have.\n\n\nOne problem is that if the skills of an AI are developing independently at different rates, then at the point that an AI eventually has the full kit of human skills, they also have a bunch of skills that are way past human-level. For instance, if a ‘human-level’ AI were developed now, it would be much better than human-level at arithmetic.\n\n\nThus the term ‘human-level’ is misleading because it invites an image of an AI which competes on even footing with the humans, rather than one that is *at least* as skilled as a human in every way, and thus what we would usually think of as *extremely superhuman*.\n\n\nAnother problem is that the term is used to mean multiple things, which then get confused with each other. One such thing is a machine which replicates human cognitive behavior, at any cost. Another is a machine which replicates human cognitive behavior at the price of a human. The former could plausibly be built years before the latter, and should arguably not be nearly as economically exciting. Yet often people imagine the two events coinciding, seemingly for lack of conceptual distinction.\n\n\nShould we use different terms for human level at human cost, and human level at any cost? Should we have a different term altogether, which evokes at-least-human capabilities? I’ll leave these questions to you. For now we just made a [disambiguation page](http://aiimpacts.org/human-level-ai/ \"Human-Level AI\").\n\n\n[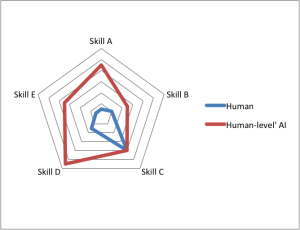](http://aiimpacts.org/wp-content/uploads/2015/02/t3_ku6_1.png)An illustration I made for the [Superintelligence Reading Group](http://lesswrong.com/lw/ku6/superintelligence_reading_group_section_1_past/)\n \n\n", "url": "https://aiimpacts.org/at-least-human-level-at-human-cost-ai/", "title": "At-least-human-level-at-human-cost AI", "source": "aiimpacts.org", "source_type": "wordpress", "date_published": "2015-02-07T14:00:15+00:00", "paged_url": "https://aiimpacts.org/feed?paged=23", "authors": ["Katja Grace"], "id": "3749092e5c3b4089069ca7558621349a", "summary": []}
{"text": "Penicillin and syphilis\n\n*By Katja Grace, 2 February 2015*\n\n\n[Penicillin](http://en.wikipedia.org/wiki/Penicillium) was a hugely important discovery. But was it a [discontinuity](http://aiimpacts.org/cases-of-discontinuous-technological-progress/ \"Cases of Discontinuous Technological Progress\") in the normal progression of research, or just an excellent discovery which followed a slightly less excellent discovery, and so on? \n\n\nThere are several senses in which penicillin might have represented a discontinuity. Perhaps its discovery was a huge leap in effectiveness, saving lives at a rate nobody thought possible. Or it might have been dramatically cheaper than expected. Or it could have heralded a step up in life expectancy, or a step down in disease prevalence.\n\n\nWe investigated this, to add to our list of cases of discontinuous technological progress, or alternatively to our new list of things we have investigated to potentially add to that list, but didn’t.\n\n\nTo make life easier, we focused on penicillin as used to remedy [syphilis](http://en.wikipedia.org/wiki/Syphilis) in particular. Our only conscious reason for choosing syphilis was that penicillin is used to cure it. It is also a disease against which penicillin was considered an important step forward.\n\n\nFirst, was penicillin a huge step forward in effectiveness, compared to the usual progress? In the field of syphilis prevention, the recent competition was actually tough. A treatment for syphilis developed thirty years earlier was literally nicknamed ‘[magic bullet](http://jmvh.org/article/syphilis-its-early-history-and-treatment-until-penicillin-and-the-debate-on-its-origins/)’ and spawned a [nobel prize](http://www.nobelprize.org/nobel_prizes/medicine/laureates/1908/ehrlich-bio.html) as well as a frightening looking [movie](http://en.wikipedia.org/wiki/Dr._Ehrlich%27s_Magic_Bullet). More quantitatively, existing treatments at the time of penicillin’s introduction in the early 40s were apparently ‘successful’ for about [90%](http://www.ncbi.nlm.nih.gov/pmc/articles/PMC1047489/?page=1) of patients who took them, and it [doesn’t look like](http://www.ncbi.nlm.nih.gov/pmc/articles/PMC1047489/?page=3) penicillin did better initially. So probably penicillin didn’t jump ahead on effectiveness.\n\n\nHowever a big difference appears to be hidden within ‘patients who took them’. The ‘magic bullet’ was an [arsenic compound, unstable in air](http://en.wikipedia.org/wiki/Arsphenamine), needing [frequent injections](http://jmvh.org/article/syphilis-its-early-history-and-treatment-until-penicillin-and-the-debate-on-its-origins/) for weeks, and producing risk to [life and limb](http://en.wikipedia.org/wiki/Arsphenamine). According to [the only paper I found with figures on this](http://www.ncbi.nlm.nih.gov/pmc/articles/PMC1047489/?page=1), about three quarter of patients ‘defected’ before receiving a ‘minimum curative dose’ of an arsenic and bismuth treatment, which suggests that while earlier cures were not obviously worse than dying of syphilis, they were also not obviously better (or else perhaps people dropped out when the severity of their side effects prohibited them from continuing). Penicillin [allowed](http://www.ncbi.nlm.nih.gov/pmc/articles/PMC1047489/?page=3) virtually everyone to get a minimum curative dose. So it’s possible that penicillin represented a discontinuity in this more inclusive success measure, but alas we don’t have the data to check. If penicillin really treated four times as many patients as recent precursors, and both cured most of them, and many would die otherwise, and little progress had happened on this measure since salvarsan, then penicillin would be worth at least thirty years of progress, and perhaps much more. \n\n\n(I hear you wondering, if this magic bullet was so much better than its precursors, what on earth were the precursors? Breathing mercury was one. From before the 16th century until the discovery of salvarsan, ‘[mercury treatments](http://jmvh.org/article/syphilis-its-early-history-and-treatment-until-penicillin-and-the-debate-on-its-origins/)’ were common. Early mercury treatments included rubbing mercury into one’s body, and inhaling the mercury fumes, while later ones involved more sophisticated injections of mercury compounds).\n\n\nI should point out that I’m confused by these apparently high defection rates. Syphilis has an untreated mortality rate of [8-58%](http://en.wikipedia.org/wiki/Epidemiology_of_syphilis), so defection from treatment would appear to be living pretty dangerously. This suggests I’m wrong about something, just so you know. Nonetheless, being right about everything doesn’t seem cost-effective here.\n\n\nSo far it seems like penicillin’s main advantage was in being less costly (including costs such as suffering and complications). Was this an abrupt change? It is hard to get figures for the inclusive costs of penicillin and its precursors, let alone a longer term trend to compare to. We can say that penicillin took around [eight days](http://jmvh.org/article/syphilis-its-early-history-and-treatment-until-penicillin-and-the-debate-on-its-origins/) at the very start, while other treatments took more than [twenty](http://www.ncbi.nlm.nih.gov/pmc/articles/PMC1047489/?page=2%7D). And penicillin seems to have been a lot less dangerous. However qualitatively speaking, salvarsan also [sounds](http://jmvh.org/article/syphilis-its-early-history-and-treatment-until-penicillin-and-the-debate-on-its-origins/) a lot less dangerous than mercury treatments. There were also further improvements in safety prior to penicillin, such as in neosalvarsan. So guessing qualitatively, penicillin might have been a few decades worth of previous progress in reducing costs, but probably not much more.\n\n\nEven at the [height](http://www.nejm.org/action/showMediaPlayer?doi=10.1056%2FNEJMp1113569&aid=NEJMp1113569_attach_1&area=&) of syphilis, the disease was not common enough that resolving all of it in one year would produce a visible change to life expectancy, so we shan’t look at that. \n\n\nDid syphilis rates decline abruptly? Both having syphilis and dying from it became much less common during the 1940s, which is probably [due](http://www.ncbi.nlm.nih.gov/pmc/articles/PMC1047489/?page=1) [in large part](http://en.wikipedia.org/wiki/Epidemiology_of_syphilis) to [antibiotics](http://jama.jamanetwork.com/article.aspx?articleid=183391) (see figures 1 and 2). Deaths from syphilis [declined by 98%](http://jama.jamanetwork.com/article.aspx?articleid=183391). However, as you can see, these were not abrupt changes. Things got modestly better every year for decades.\n\n\n[](http://aiimpacts.org/wp-content/uploads/2015/01/SyphilisUS2009.gif)Figure 1: [Syphilis infection in the US](http://en.wikipedia.org/wiki/Epidemiology_of_syphilis#mediaviewer/File:SyphilisUS2009.gif)\n[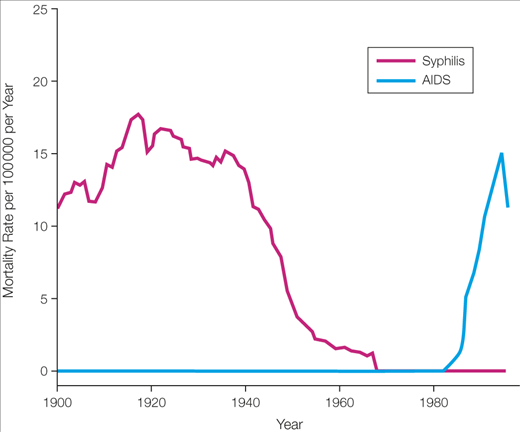](http://aiimpacts.org/wp-content/uploads/2015/01/syphilis.png)Figure 2: syphilis deaths [declined massively](http://jama.jamanetwork.com/article.aspx?articleid=768249) in the middle of last century.\nIn sum, it seems unlikely that there was abrupt progress on drug effectiveness conditional on completing the treatment, or on how many people had or died from syphilis. There may have been abrupt progress in overall costs or in drug effectiveness conditional on being offered the treatment, but these have been too hard to evaluate here. \n\n\nSo for now, we add it to the [list of things we checked](http://aiimpacts.org/discontinuous-progress-investigation/ \"Discontinuous progress investigation\"), but not the [list of things that were abrupt](http://aiimpacts.org/cases-of-discontinuous-technological-progress/ \"Cases of Discontinuous Technological Progress\"). The list of things we checked is part of a [larger page about this project](http://aiimpacts.org/discontinuous-progress-investigation/ \"Discontinuous progress investigation\"), in case you are curious. We also looked into the Haber process recently, but didn’t think it involved much discontinuity. We might blog about it at some point.\n\n\nSome other interesting facts about syphilis and penicillin I learned:\n\n\n* A pre-penicillin treatment for neurosyphilis [was](http://jmvh.org/article/syphilis-its-early-history-and-treatment-until-penicillin-and-the-debate-on-its-origins/) to give the patient malaria, because malaria mitigated the syphilis, and was considered more treatable than syphilis.\n* Early on, penicillin was so valuable that doctors [recycled](http://www.lib.niu.edu/2001/iht810139.html) what hadn’t been metabolized by extracting it from patients’ urine.\n* There is a [whole wikipedia page](http://en.wikipedia.org/wiki/History_of_penicillin) of previous occasions in history where people observed that mould prevented bacterial infection, more or less, but apparently didn’t follow up that much.\n", "url": "https://aiimpacts.org/penicillin-and-syphilis/", "title": "Penicillin and syphilis", "source": "aiimpacts.org", "source_type": "wordpress", "date_published": "2015-02-02T19:21:52+00:00", "paged_url": "https://aiimpacts.org/feed?paged=23", "authors": ["Katja Grace"], "id": "e1c367e600c8b1e30565377684af7a30", "summary": []}
{"text": "Discontinuous progress investigation\n\n*Published Feb 2, 2015; last substantially updated April 12 2020*\n\n\nWe have collected cases of discontinuous technological progress to inform our understanding of whether artificial intelligence performance is likely to undergo such a discontinuity. This page details our investigation.\n\n\nWe know of ten events that produced a robust discontinuity in progress equivalent to more than a century at previous rates in at least one interesting metric and 53 events that produced smaller or less robust discontinuities.\n\n\nDetails\n-------\n\n\n### Motivations\n\n\nWe are interested in learning [whether artificial intelligence is likely to see discontinuous progress in the lead-up](http://aiimpacts.org/likelihood-of-discontinuous-progress-around-the-development-of-agi/) to [human-level](http://aiimpacts.wpengine.com/human-level-ai/) capabilities, or to produce discontinuous change in any other socially important metrics (e.g. percent of global wealth possessed by a single entity, economic value of hardware). We are interested because we think this informs us about the plausibility of different future scenarios and about which research and other interventions are best now, and also because it is a source of disagreement, and so perhaps fruitful for resolution.[1](https://aiimpacts.org/discontinuous-progress-investigation/#easy-footnote-bottom-1-414 \"For instance, if the development of advanced AI takes place in the context of a large discontinuity, then it is arguably more likely to involve large shifts in power, to take place sooner than predicted, to be surprising, to be disruptive, and to be dangerous. Also, our research should investigate questions such as how to prepare or be warned, rather than questions like when the present trajectories of AI progress will reach human-level capabilities. See likelihood of discontinuous progress around the development of AGI for more discussion.\")\nWe seek to answer this question by investigating the prevalence and nature of discontinuities in other technological progress trends. The prevalence can then act as a baseline for our expectations about AI, which can be updated with any further [AI-specific evidence](https://aiimpacts.org/likelihood-of-discontinuous-progress-around-the-development-of-agi/), including that which comes from looking at the nature of other discontinuities (for instance, whether they arise in circumstances that are predicted by the [arguments](https://aiimpacts.org/likelihood-of-discontinuous-progress-around-the-development-of-agi/) that are made for predicting discontinuous progress in AI). \n\n\nIn particular, we want to know:\n\n\n* How common are large discontinuities in metrics related to technological progress?\n* Do any factors predict where such discontinuities will arise? (For instance, is it true that progress in a conceptual endeavor is more likely to proceed discontinuously? If there have been discontinuities in progress on a metric in the past, are further discontinuities more likely?)\n\n\nAs a secondary goal, we are interested in learning about the circumstances that have surrounded discontinuous technological change in the past, insofar as it may inform our expectations about the consequences of discontinuous progress in AI, should it happen.\n\n\n### Methods\n\n\n*Main article: [methodology for discontinuous progress investigation](http://aiimpacts.org/methodology-for-discontinuity-investigation/).*\n\n\nTo learn about the prevalence and nature of discontinuities in technological progress, we:\n\n\n1. Searched for potential examples of discontinuous progress (e.g. ‘Eli Whitney’s cotton gin’) via our own understanding, online search, and suggestions from others.[2](https://aiimpacts.org/discontinuous-progress-investigation/#easy-footnote-bottom-2-414 \"We thank \")\n2. Chose specific metrics related to these potential examples (e.g. ‘cotton ginned per person per day’, ‘value of cotton ginned per cost’) and found historic data on progress on those metrics (usually in conjunction with choosing metrics, since metrics for which we can find data are much preferred). Some datasets we found already formed in one place, while others we collected ourselves from secondary sources.\n3. Defined a ‘rate of past progress’ throughout each historic dataset (e.g. if the trend is broadly flat then gets steeper, we decide whether to call this exponential progress, or two periods of linear growth.)\n4. Measured the discontinuity at each datapoint in each trend by comparing the progress at the point to the expected progress at that point based on the last datapoint and the rate of past progress (e.g. if the last datapoint five years ago was 600 units, and progress had been going at two units per year, and now a development took it to 800 units, we would calculate 800 units – 600 units = 200 units of progress = 100 years of progress in 5 years, for a 95 year discontinuity.)\n5. Noted any discontinuities of more than ten years (‘moderate discontinuities’), and more than one hundred years (‘large discontinuities’)\n6. Judged subjectively whether the discontinuity was a clear divergence from the past trend (i.e. the past trend was well-formed enough that the new point actually seemed well outside of plausible continuations of it).[3](https://aiimpacts.org/discontinuous-progress-investigation/#easy-footnote-bottom-3-414 \"See this spreadsheet column for the judgments.\")\n7. Noted anything interesting about the circumstances of each discontinuity (e.g. the type of metric it was in, the events that appeared to lead to the discontinuity, the patterns of progress around it.)\n\n\nNote that this is not an attempt to rigorously estimate the frequency of discontinuities in arbitrary trends, since we have not attempted to select arbitrary trends. We have instead selected trends we think might contain large discontinuities. Given this, it may be used as a loose upper bound on the frequency of discontinuities in similar technological trends.\n\n\nIt is likely that there are many minor errors in this collection of data and analysis, based on the rate at which we have found and corrected them, and the unreliability of sources used. \n\n\n#### Definitions\n\n\nThroughout, we use:\n\n\n* **[Discontinuity](https://aiimpacts.org/methodology-for-discontinuity-investigation/#Discontinuity_calculation):** abrupt progress far above what one would have expected by extrapolation, measured in terms of how many years early the progress appeared relative to its expected date.\n* **Moderate discontinuity:** 10-100 years of progress at previous rates occurred on one occasion\n* **Large discontinuity:** at least 100 years of progress at previous rates occurred on one occasion\n* **Substantial discontinuity:** a moderate or large discontinuity\n* **[Robust discontinuity](https://aiimpacts.org/methodology-for-discontinuity-investigation/#Robust_discontinuities):** a discontinuity judged to involve a clear divergence from the past trend\n\n\n### Summary figures\n\n\n* We collected 21 case studies of potentially discontinuous technological progress (see [*Case studies*](https://aiimpacts.org/discontinuous-progress-investigation/?preview_id=414&preview_nonce=5c1b7b6d73&preview=true#Case_studies) below) and investigated 38 trends associated with them.\n* 20 trends had a substantial discontinuity, and 15 had a large discontinuity.[4](https://aiimpacts.org/discontinuous-progress-investigation/#easy-footnote-bottom-4-414 \"Recall that our trends were selected for being especially likely to contain discontinuities, so this is something like an upper bound on their frequency in trends in general. However some trends we investigated for fairly limited periods, so these may have contained more discontinuities than we found.\")\n* We found 88 substantial discontinuities, 39 of them large.\n* These discontinuities were produced by 63 distinct events\n* Ten events produced robust large discontinuities in at least one metric.\n\n\n### Case studies\n\n\nThis is a list of areas of technological progress which we have tentatively determined to either involve discontinuous technological progress, or not. Note that we largely investigate cases that looked likely to be discontinuous.\n\n\n#### Ship size\n\n\n*Main article: [Historic trends in ship size](https://aiimpacts.org/historic-trends-in-ship-size/)*\n\n\nTrends for ship tonnage (builder’s old measurement) and ship displacement for Royal Navy first rate line-of-battle ships saw eleven and six discontinuities of between ten and one hundred years respectively during the period 1637-1876, if progress is treated as linear or exponential as usual. There is a hyperbolic extrapolation of progress such that neither measurement sees any discontinuities of more than ten years.\n\n\nWe do not have long term data for ship size in general, however the SS *Great Eastern* seems to have produced around 400 years of discontinuity in both tonnage (BOM) and displacement if we use Royal Navy ship of the line size as a proxy, and exponential progress is expected, or 11 or 13 in the hyperbolic trend.\n\n\n**Figure 1a:** Record tonnages for Royal Navy ships of the line\n**Figure 1b:** Ship weight (displacement) over time, Royal Navy ships of the line and the *Great Eastern*, a discontinuously large civilian ship. The largest ship in the world three years prior to the *Great Eastern* was around 4% larger than the Ship of the Line of that time in this figure, so we know that the overall largest ship trend cannot have been much steeper than the Royal Navy ship of the line trend shown.\n#### Image recognition\n\n\n*Main article: [Effect of AlexNet on historic trends in image recognition](https://aiimpacts.org/effect-of-alexnet-on-historic-trends-in-image-recognition/)*\n\n\nAlexNet did not represent a greater than 10-year discontinuity in fraction of images labeled incorrectly, or log or inverse of this error rate, relative to progress in the past two years of competition data.\n\n\n**Figure 2:** Error rate (%) of ImageNet competitors from 2010 – 2012\n#### Transatlantic passenger travel\n\n\n*Main article: [Historic trends in transatlantic passenger travel](https://aiimpacts.org/historic-trends-in-transatlantic-passenger-travel/)*\n\n\nThe speed of human travel across the Atlantic Ocean has seen at least seven discontinuities of more than ten years’ progress at past rates, two of which represented more than one hundred years’ progress at past rates: Columbus’ second journey, and the first non-stop transatlantic flight.\n\n\n**Figure 3a:** Historical fastest passenger travel across the Atlantic (speeds averaged over each transatlantic voyage)\n **Figure 3b:** Previous figure, shown since 1730\n#### Transatlantic message speed\n\n\n*Main article: [Historic trends in transatlantic message speed](https://aiimpacts.org/historic-trends-in-transatlantic-message-speed/)*\n\n\nThe speed of delivering a short message across the Atlantic Ocean saw at least three discontinuities of more than ten years before 1929, all of which also were more than one thousand years: a 1465-year discontinuity from Columbus’ second voyage in 1493, a 2085-year discontinuity from the first telegraph cable in 1858, and then a 1335-year discontinuity from the second telegraph cable in 1866.\n\n\n **Figure 4:** Average speed for message transmission across the Atlantic. \n#### Long range military payload delivery\n\n\n*Main article: [Historic trends in long range military payload delivery](https://aiimpacts.org/historic-trends-in-long-range-military-payload-delivery/)*\n\n\nThe speed at which a military payload could cross the Atlantic ocean contained six greater than 10-year discontinuities in 1493 and between 1841 and 1957: \n\n\n\n\n| | | | |\n| --- | --- | --- | --- |\n| **Date** | **Mode of transport** | **Knots** | **Discontinuity size(years of progress at past rate)** |\n| 1493 | Columbus’ second voyage | 5.8 | 1465 |\n| 1884 | Oregon | 18.6 | 10 |\n| 1919 | WWI Bomber (first non-stop transatlantic flight) | 106 | 351 |\n| 1938 | Focke-Wulf Fw 200 Condor | 174 | 19 |\n| 1945 | Lockheed Constellation | 288 | 25 |\n| 1957 | R-7 (ICBM) | ~10,000 | ~500 |\n\n\n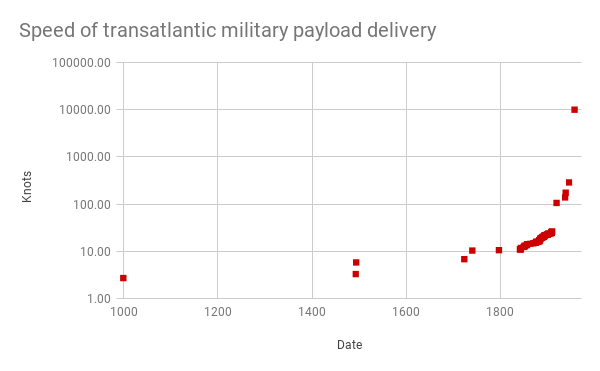**Figure 5:** Historic speeds of sending hypothetical military payloads across the Atlantic Ocean\n#### Bridge spans\n\n\n*Main article: [Historic trends in bridge span length](https://aiimpacts.org/historic-trends-in-bridge-span-length/)*\n\n\nWe measure eight discontinuities of over ten years in the history of longest bridge spans, four of them of over one hundred years, five of them robust as to slight changes in trend extrapolation. \n\n\n**Figure 6:** Record bridge span lengths for five bridge types since 1800\n#### Light intensity\n\n\n*Main article: [Historic trends in light intensity](https://aiimpacts.org/historic-trends-in-light-intensity/)*\n\n\nMaximum light intensity of artificial light sources has discontinuously increased once that we know of: argon flashes represented roughly 1000 years of progress at past rates.\n\n\n**Figure 7:** Light intensity trend since 1800 (longer trend [available](https://aiimpacts.org/historic-trends-in-light-intensity/))\n#### Book production\n\n\n*Main article: [Historic trends in book production](https://aiimpacts.org/historic-trends-in-book-production/)*\n\n\nThe number of books produced in the previous hundred years, sampled every hundred or fifty years between 600AD to 1800AD contains five greater than 10-year discontinuities, four of them greater than 100 years. The last two follow the invention of the printing press in 1492. \n\n\nThe real price of books dropped precipitously following the invention of the printing press, but the longer term trend is sufficiently ambiguous that this may not represent a substantial discontinuity.\n\n\nThe rate of progress of book production changed shortly after the invention of the printing press, from a doubling time of 104 years to 43 years.\n\n\n**Figure 8a:** Total book production in Western Europe\n**Figure 8b:** Real price of books in England\n#### Telecommunications performance\n\n\n*Main article: [Historic trends in telecommunications performance](https://aiimpacts.org/historic-trends-in-telecommunications-performance/)*\n\n\nThere do not appear to have been any greater than 10-year discontinuities in telecommunications performance, measured as: \n\n\n* bandwidth-distance product for all technologies 1840-2015\n* bandwidth-distance product for optical fiber 1975-2000\n* total bandwidth across the Atlantic 1956-2018\n\n\nRadio does not seem likely to have represented a discontinuity in message speed.\n\n\n**Figure 9a:** Growth in bandwidth-distance product across all telecommunications during 1840-2015 from Agrawal, 2016[5](https://aiimpacts.org/discontinuous-progress-investigation/#easy-footnote-bottom-5-414 \"Agrawal, Govind P. 2016. “Optical Communication: Its History And Recent Progress”. Optics In Our Time, 177-199. Springer International Publishing. doi:10.1007/978-3-319-31903-2_8., https://link.springer.com/chapter/10.1007/978-3-319-31903-2_8\")\n**Figure 9b**: \nBandwidth-distance product in fiber optics alone, from Agrawal, 2016[6](https://aiimpacts.org/discontinuous-progress-investigation/#easy-footnote-bottom-6-414 \"Agrawal, Govind P. 2016. “Optical Communication: Its History And Recent Progress”. Optics In Our Time, 177-199. Springer International Publishing. doi:10.1007/978-3-319-31903-2_8., https://link.springer.com/chapter/10.1007/978-3-319-31903-2_8\") (Note: 1 Gb = 10^9 bits) \n**Figure 9c:** Transatlantic cable bandwidth of all types. Pre-1980 cables were copper, post-1980 cables were optical fiber.\n#### Cotton gins\n\n\n*Main article:* [*Effect of Eli Whitney’s cotton gin on historic trends in cotton ginning*](http://aiimpacts.org/effect-of-eli-whitneys-cotton-gin-on-historic-trends-in-cotton-ginning/)\n\n\nWe estimate that Eli Whitney’s cotton gin represented a 10 to 25 year discontinuity in pounds of cotton ginned per person per day, in 1793. Two innovations in 1747 and 1788 look like discontinuities of over a thousand years each on this metric, but these could easily stem from our ignorance of such early developments. We tentatively doubt that Whitney’s gin represented a large discontinuity in the cost per value of cotton ginned, though it may have represented a moderate one.\n\n\n**Figure 10:** Claimed cotton gin productivity figures, 1720 to modern day, coded by credibility and being records. The last credible best point before the modern day is an improved version of Whitney’s gin, two years after the original (the original features in the two high non-credible claims slightly earlier).\n#### Altitude\n\n\n*Main article: [Historic trends in altitude](https://aiimpacts.org/discontinuity-in-altitude-records/)*\n\n\nAltitude of objects attained by man-made means has seen six discontinuities of more than ten years of progress at previous rates since 1783, shown below.\n\n\n\n\n| | | | |\n| --- | --- | --- | --- |\n| **Year** | **Height (m)** | **Discontinuity (years)** | **Entity** |\n| 1784 | 4000 | 1032 | Balloon |\n| 1803 | 7280 | 1693 | Balloon |\n| 1918 | 42,300 | 227 | [Paris gun](https://en.wikipedia.org/wiki/Paris_Gun) |\n| 1942 | 85,000 | 120 | [V-2 Rocket](https://en.wikipedia.org/wiki/List_of_V-2_test_launches) |\n| 1944 | 174,600 | 11 | [V-2 Rocket](https://en.wikipedia.org/wiki/List_of_V-2_test_launches) |\n| 1957 | 864,000,000 | 35 | Pellets (after one day) |\n\n\n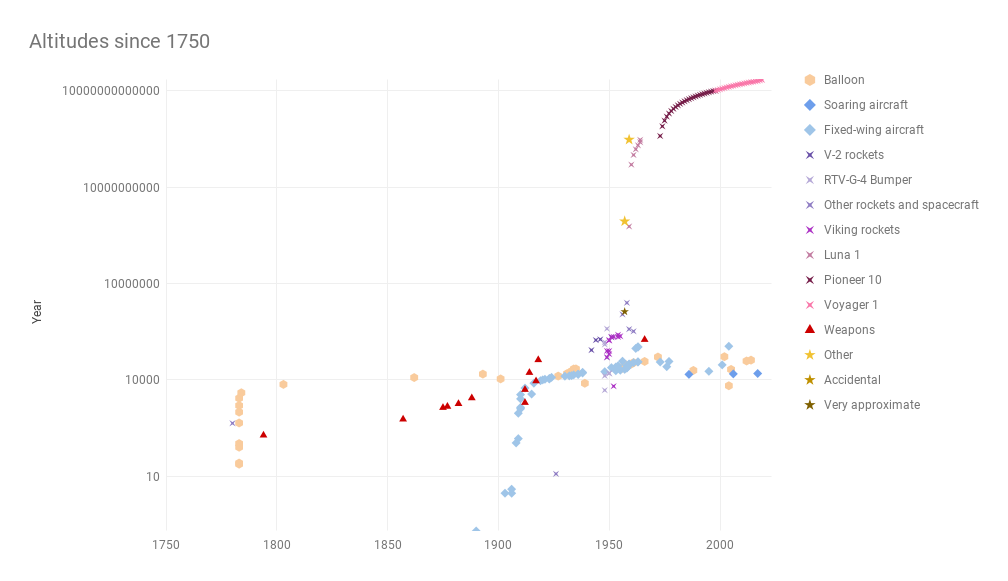**Figure 11:** Post-1750 altitudes of various objects, including many non-records. Whether we collected data for non-records is inconsistent, so this is not a complete picture of progress within object types. See image in detail [here](http://aiimpacts.org/wp-content/uploads/2018/02/Altitudes-since-1750-3.png).\n#### Slow light\n\n\n*Main article: [Historic trends in slow light technology](https://aiimpacts.org/historic-trends-in-slow-light-technology/)*\n\n\nGroup index of light appears to have seen discontinuities of 22 years in 1995 from Coherent Population Trapping (CPT) and 37 years in 1999 from EIT (condensate). Pulse delay of light over a short distance may have had a large discontinuity in 1994 but our data is not good enough to judge. After 1994, pulse delay does not appear to have seen discontinuities of more than ten years. \n\n\n[](http://aiimpacts.org/wp-content/uploads/2019/03/DelayngData4.png)\n**Figure 12:** Progress in pulse delay and group index. “Human speed” shows the rough scale of motion familiar to humans.\n\n\n#### Particle accelerators\n\n\nMain article: [Historic trends in particle accelerator performance](https://aiimpacts.org/particle-accelerator-performance-progress/)\n\n\nNone of particle energy, center-of-mass energy nor Lorentz factor achievable by particle accelerators appears to have undergone a discontinuity of more than ten years of progress at previous rates. \n\n\n**Figure 13a:** Particle energy in eV over time\n**Figure 13b:** Center-of-mass energy in eV over time\n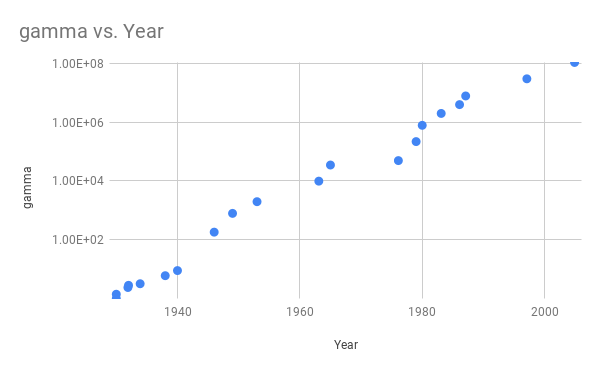**Figure 13c:** Lorentz factor (gamma) over time.\n#### Penicillin on syphilis\n\n\n*Main article: [Penicillin and historic syphilis trends](https://aiimpacts.org/penicillin-and-historic-syphilis-trends/)*\n\n\nPenicillin did not precipitate a discontinuity of more than ten years in deaths from syphilis in the US. Nor were there other discontinuities in that trend between 1916 and 2015. \n\n\nThe number of syphilis cases in the US also saw steep decline but no substantial discontinuity between 1941 and 2008.\n\n\nOn brief investigation, the effectiveness of syphilis treatment and inclusive costs of syphilis treatment do not appear to have seen large discontinuities with penicillin, but we have not investigated either thoroughly enough to be confident.\n\n\n[](http://aiimpacts.wpengine.com/wp-content/uploads/2015/01/SyphilisUS2009.gif)\n**Figure 14a**: Syphilis—Reported Cases by Stage of Infection, United States, 1941–2009, according to the CDC[7](https://aiimpacts.org/discontinuous-progress-investigation/#easy-footnote-bottom-7-414 \"From Figure 33 in Division of STD Prevention, “Sexually Transmitted Disease Surveillance 2009,” November 2010, https://web.archive.org/web/20170120091355/https://www.cdc.gov/std/stats09/surv2009-Complete.pdf.\")\n[](http://aiimpacts.wpengine.com/wp-content/uploads/2015/01/syphilis.png)**Figure 14b:** Syphilis and AIDS mortality rates in the US during the 20th century.[8](https://aiimpacts.org/discontinuous-progress-investigation/#easy-footnote-bottom-8-414 \"See table 4D in Gregory L. Armstrong, Laura A. Conn, and Robert W. Pinner, “Trends in Infectious Disease Mortality in the United States During the 20th Century,” JAMA 281, no. 1 (January 6, 1999): 61–66, https://doi.org/10.1001/jama.281.1.61.\") \n#### Nuclear weapons\n\n\n*Main article:* [Effect of nuclear weapons on historic trends in explosives](https://aiimpacts.org/discontinuity-from-nuclear-weapons/)\n\n\nNuclear weapons constituted a ~7 thousand year discontinuity in energy released per weight of explosive (relative effectiveness).\n\n\nNuclear weapons do not appear to have clearly represented progress in the cost-effectiveness of explosives, though the evidence there is weak.\n\n\n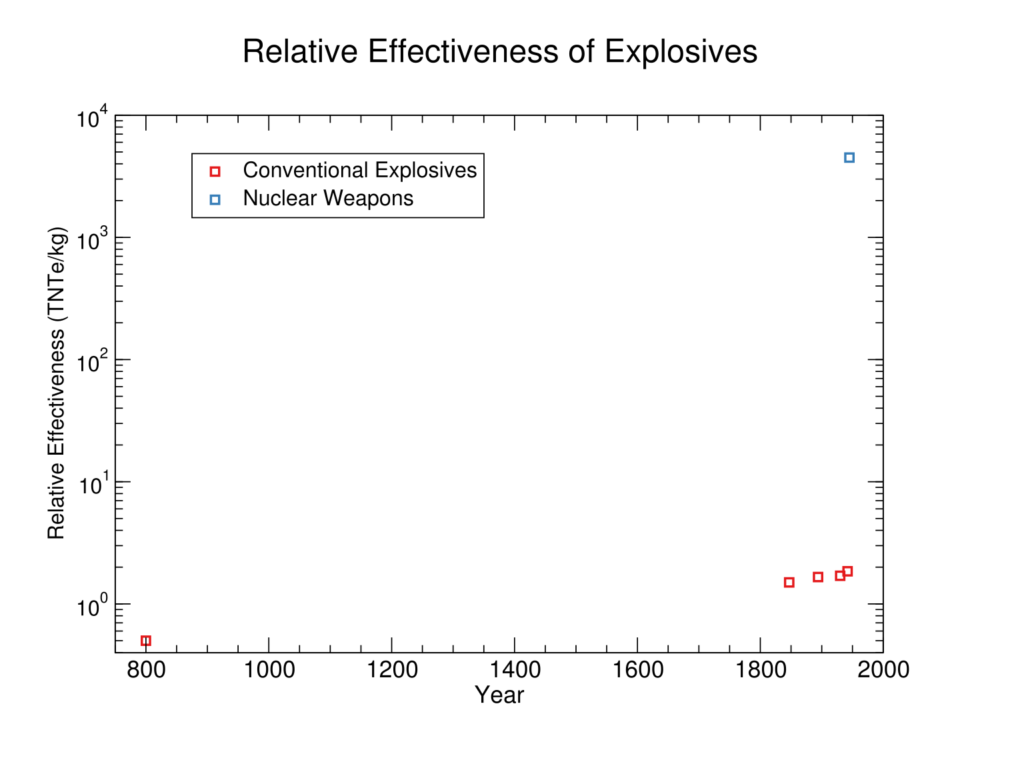**Figure 15:** Relative effectiveness of explosives, up to early nuclear bomb (note change to log scale) \n#### High temperature superconductors\n\n\n*Main article: [Historic trends in the maximum superconducting temperature](http://aiimpacts.org/historic-trends-in-the-maximum-superconducting-temperature/)*\n\n\nThe maximum superconducting temperature of any material up to 1993 contained four greater than 10-year discontinuities: A 14-year discontinuity with NbN in 1941, a 26-year discontinuity with LaBaCuO4 in 1986, a 140-year discontinuity with YBa2Cu3O7 in 1987, and a 10-year discontinuity with BiCaSrCu2O9 in 1987.\n\n\nYBa2Cu3O7 superconductors seem to correspond to a marked change in the rate of progress of maximum superconducting temperature, from a rate of progress of .41 Kelvin per year to a rate of 5.7 Kelvin per year.\n\n\n**Figure 16:** Maximum superconducting temperate by material over time through 2015 \n\n#### Land speed records\n\n\n*Main article: [historic trends in land speed records](https://aiimpacts.org/historic-trends-in-land-speed-records/)*\n\n\nLand speed records did not see any greater-than-10-year discontinuities relative to linear progress across all records. Considered as several distinct linear trends it saw discontinuities of 12, 13, 25, and 13 years, the first two corresponding to early (but not first) jet-propelled vehicles.\n\n\nThe first jet-propelled vehicle just predated a marked change in the rate of progress of land speed records, from a recent 1.8 mph / year to 164 mph / year.\n\n\n**Figure 17:** Historic land speed records in mph over time. Speeds on the left are an average of the record set in mph over 1 km and over 1 mile. The red dot represents the first record in a cluster that was from a jet propelled vehicle. The discontinuities of more than ten years are the third and fourth turbojet points, and the last two points.\n#### Chess AI\n\n\n*Main article: [Historic trends in chess AI](http://aiimpacts.org/historic-trends-in-chess-ai/)*\n\n\nThe Elo rating of the best chess program measured by the Swedish Chess Computer Association did not contain any greater than 10-year discontinuities between 1984 and 2018. \n\n\n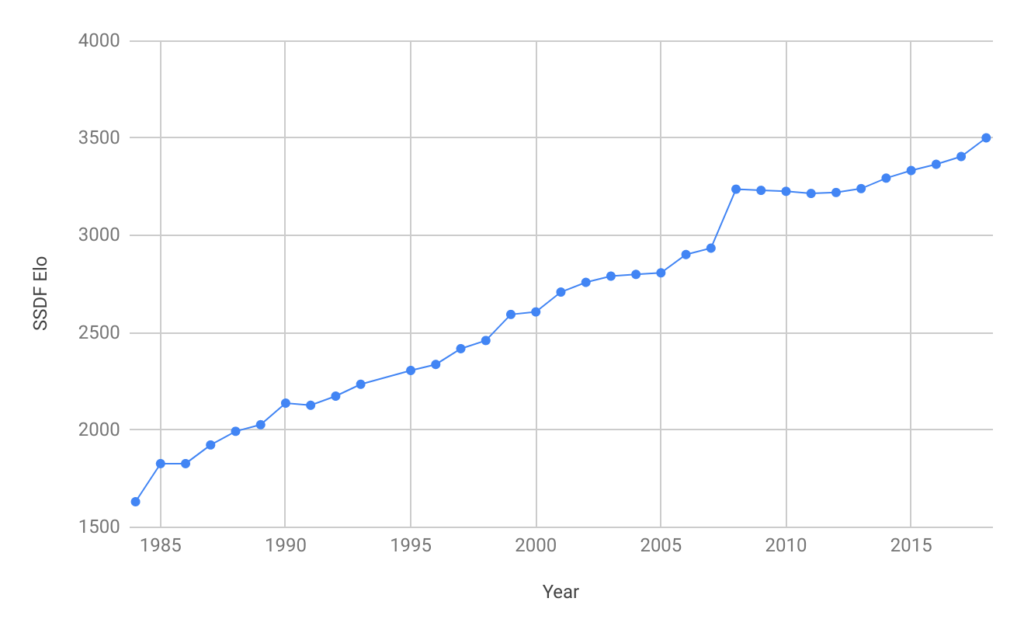 **Figure 18:** Elo ratings of the best program on SSDF at the end of each year.\n#### Flight airspeed\n\n\n*Main article:* [*Historic trends in flight airspeed records*](http://aiimpacts.org/historic-trends-in-flight-airspeed-records/)\n\n\nFlight airspeed records between 1903 and 1976 contained one greater than 10-year discontinuity: a 19-year discontinuity corresponding to the Fairey Delta 2 flight in 1956.\n\n\nThe average annual growth in flight airspeed markedly increased with the Fairey Delta 2, from 16mph/year to 129mph/year.\n\n\n**Figure 19:** Flight airspeed records over time\n#### Structure heights\n\n\n*Main article:* [*Historic trends in structure heights*](http://aiimpacts.org/discontinuity-from-the-burj-khalifa/)\n\n\nTrends for tallest ever structure heights, tallest ever freestanding structure heights, tallest existing freestanding structure heights, and tallest ever building heights have each seen 5-8 discontinuities of more than ten years. These are:\n\n\n* **Djoser and Meidum pyramids** (~2600BC, >1000 year discontinuities in all structure trends)\n* Three cathedrals that were shorter than the all-time record (**Beauvais** **Cathedral** in 1569, **St Nikolai** in 1874, and **Rouen** **Cathedral** in 1876, all >100 year discontinuities in current freestanding structure trend)\n* **Washington Monument** (1884, >100 year discontinuity in both tallest ever structure trends, but not a notable discontinuity in existing structure trend)\n* **Eiffel Tower** (1889, ~10,000 year discontinuity in both tallest ever structure trends, 54 year discontinuity in existing structure trend)\n* Two early skyscrapers: the **Singer Building** and the **Metropolitan Life Tower** (1908 and 1909, each >300 year discontinuities in building height only)\n* **Empire State Building** (1931, 19 years in all structure trends, 10 years in buildings trend)\n* **KVLY-TV mast** (1963, 20 year discontinuity in tallest ever structure trend)\n* **Taipei 101** (2004, 13 year discontinuity in building height only)\n* **Burj Khalifa** (2009, ~30 year discontinuity in both freestanding structure trends, 90 year discontinuity in building height trend)\n\n\n**Figure 20a:** All-time record structure heights, long term history\n[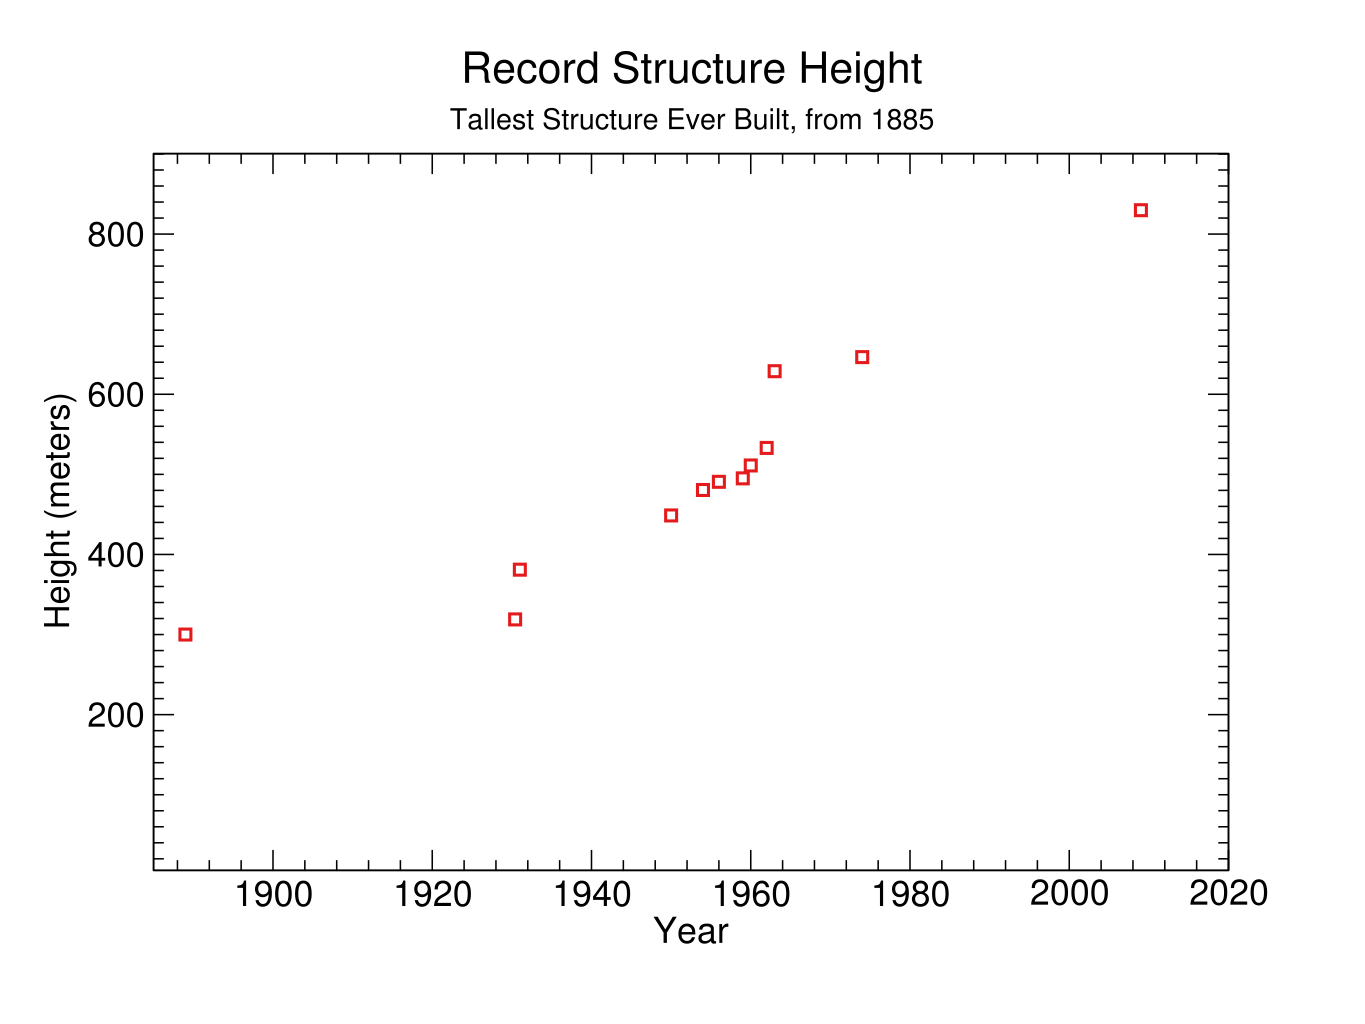](http://aiimpacts.org/wp-content/uploads/2020/01/StructureRecordZoom.png)**Figure 20b:** All-time record structure heights, recent history\n**Figure 20c:** All-time record freestanding structure heights, long term history\n[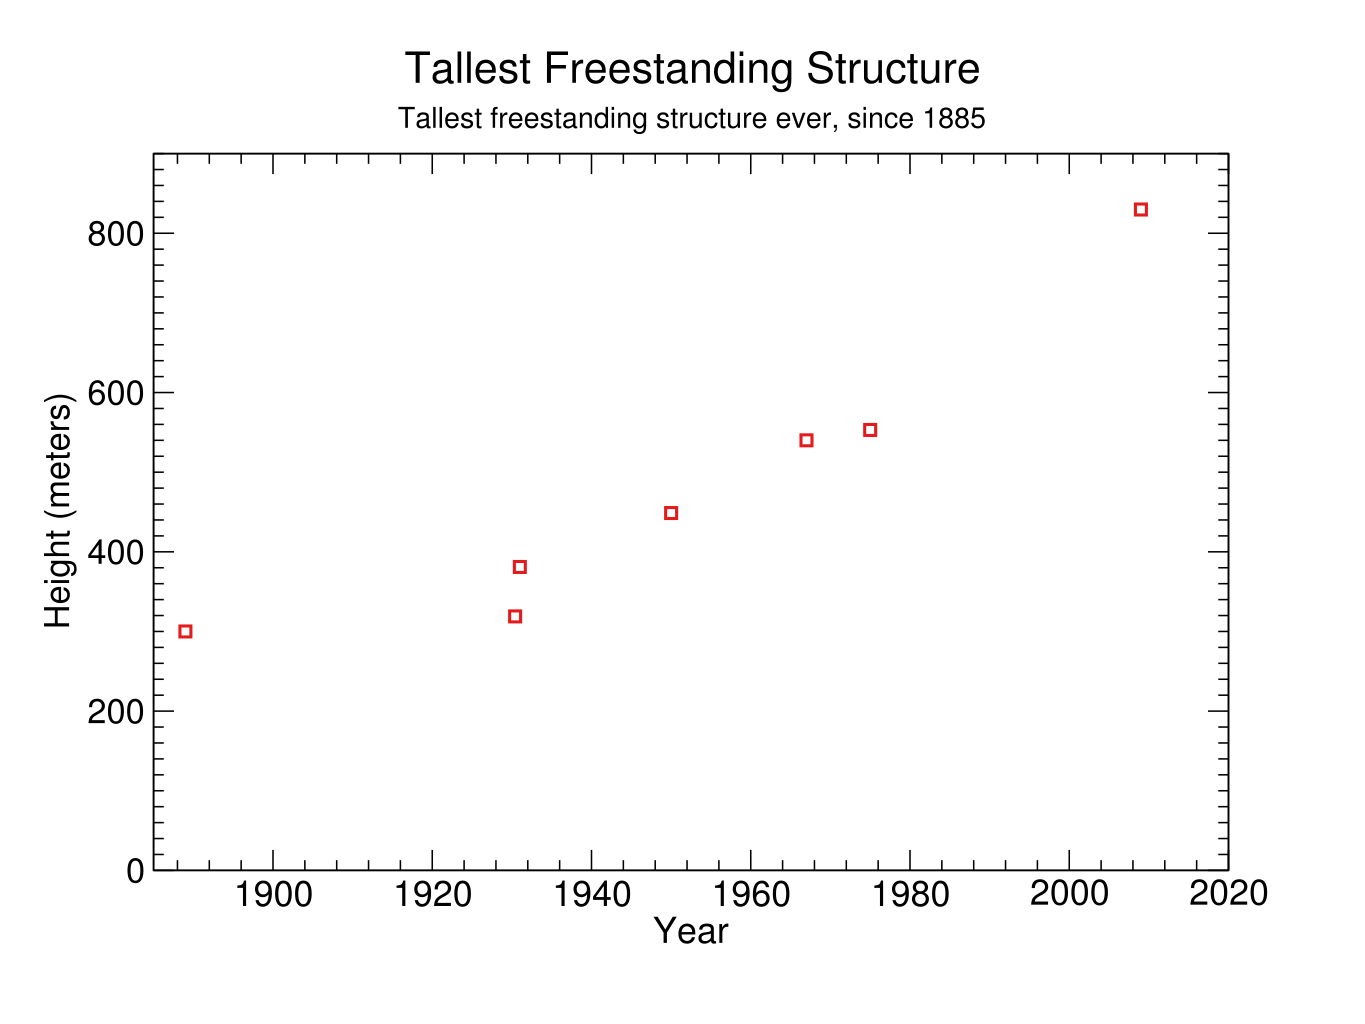](http://aiimpacts.org/wp-content/uploads/2020/01/RecordFreeZoom.png)**Figure 20d:** All-time record freestanding structure heights, recent history\n[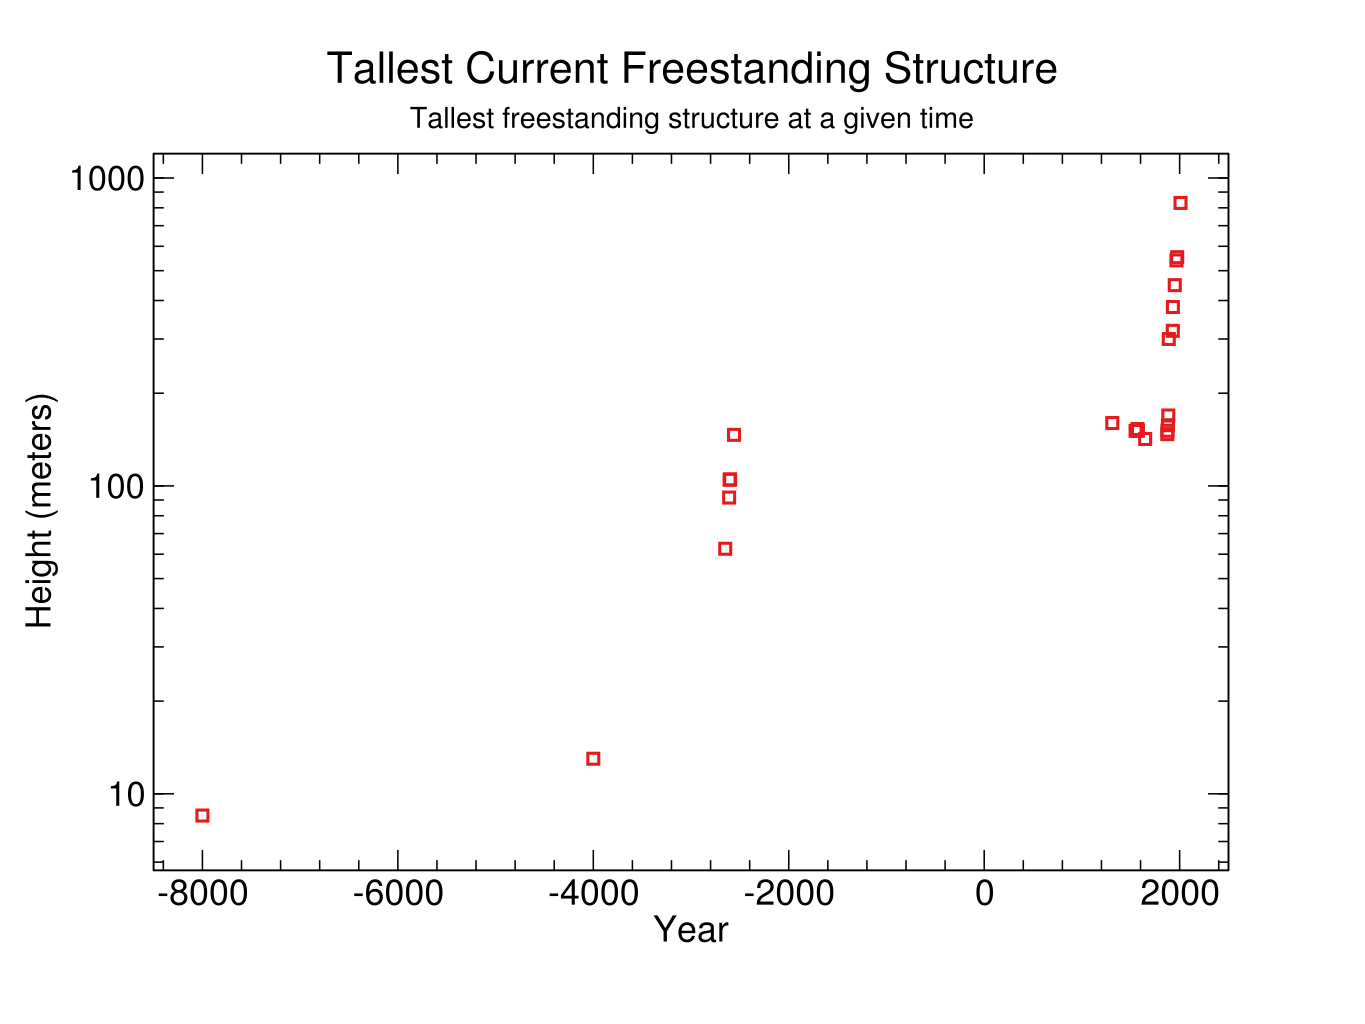](http://aiimpacts.org/wp-content/uploads/2020/01/CurrentFreestandingStructure.png)**Figure 20e:** At-the-time record freestanding structure heights, long term history\n**Figure 20f:** At-the-time record freestanding structure heights, recent history\n[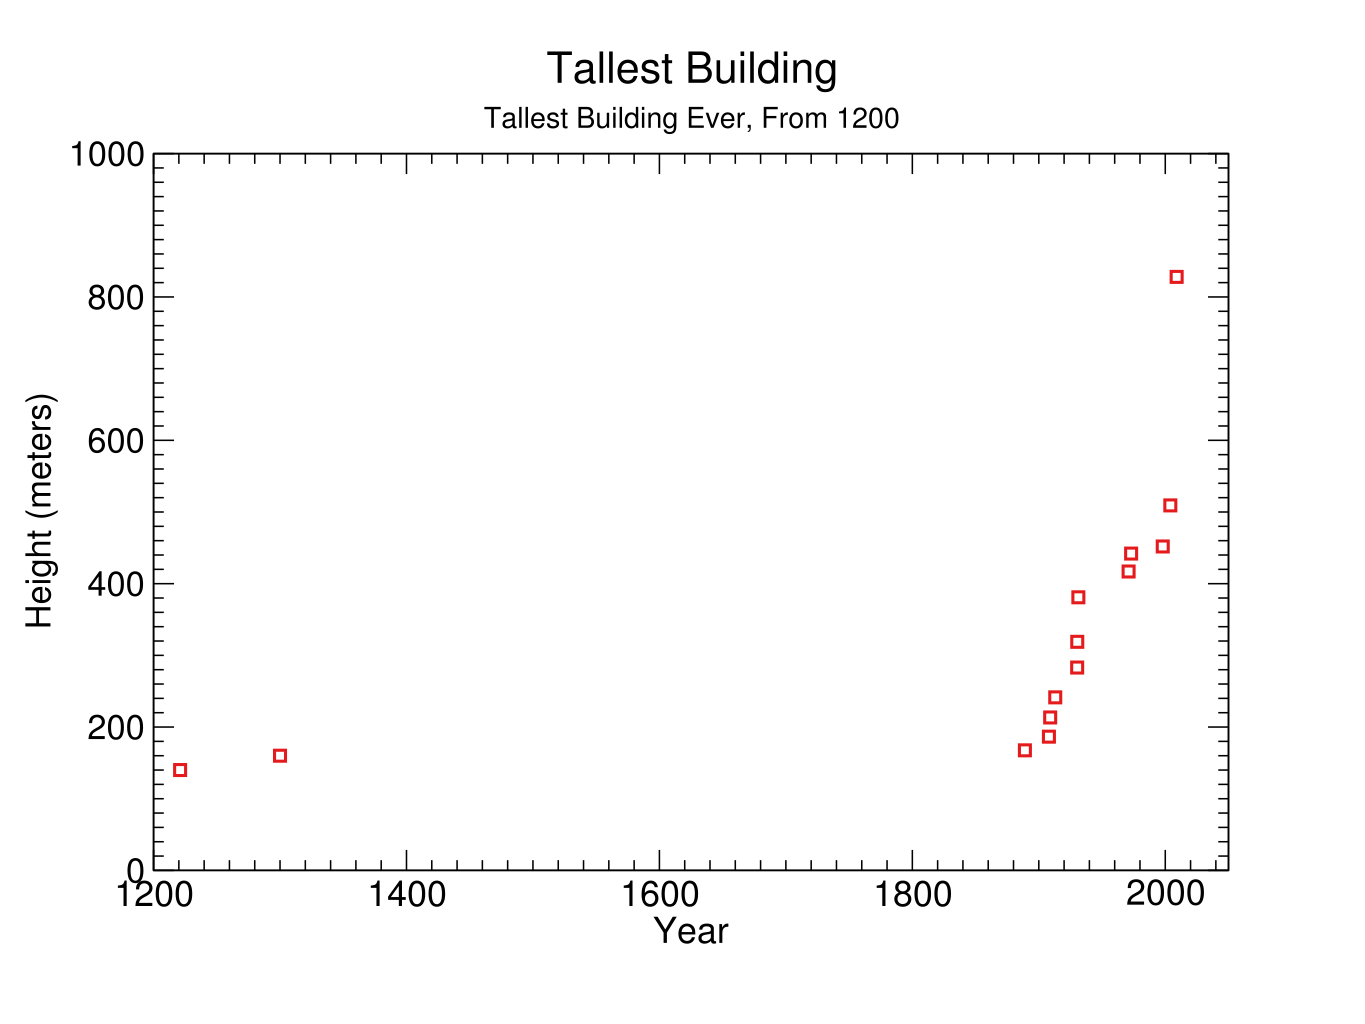](http://aiimpacts.org/wp-content/uploads/2020/01/TallestBuilding.png)**Figure 20g:** All-time record building heights, longer term history\n**Figure 20h:** All-time record building heights, longer term history\n#### Breech loading rifles\n\n\n*Main article: [Effects of breech loading rifles on historic trends in firearm progress](http://aiimpacts.org/effects-of-breech-loading-rifles-on-historic-trends-in-firearm-progress/)*\n\n\nBreech loading rifles do not appear to have represented a discontinuity in firing rate of guns, since it appears that other guns had a similar firing rate already. It remains possible that breech loading rifles represent a discontinuity in another related metric.\n\n\n#### Incomplete case studies\n\n\n[This](https://aiimpacts.org/incomplete-case-studies-of-discontinuous-progress/) is a list of cases we have partially investigated, but insufficiently to include in this page.\n\n\n### Extended observations\n\n\n[This spreadsheet](https://docs.google.com/spreadsheets/d/1iMIZ57Ka9-ZYednnGeonC-NqwGC7dKiHN9S-TAxfVdQ/edit?usp=sharing) contains summary data and statistics about the entire set of case studies, including all calculations for findings that follow.\n\n\n#### Prevalence of discontinuities\n\n\n* We investigated 38 trends in around 21 broad areas[9](https://aiimpacts.org/discontinuous-progress-investigation/#easy-footnote-bottom-9-414 \"e.g. within the area of ‘structure height’ we investigated ‘all time tallest buildings, measured by architectural height’ and also ‘tallest at the time freestanding structures, measured by pinnacle height’\")\n* Of the 38 trends that we investigated, we found [20](https://docs.google.com/spreadsheets/d/1iMIZ57Ka9-ZYednnGeonC-NqwGC7dKiHN9S-TAxfVdQ/edit#gid=1906429870&range=I44) to contain at least one substantial discontinuity, and [15](https://docs.google.com/spreadsheets/d/1iMIZ57Ka9-ZYednnGeonC-NqwGC7dKiHN9S-TAxfVdQ/edit#gid=1906429870&range=K44) to contain at least one large discontinuity. (Note that our trends were selected for being especially likely to contain discontinuities, so this is something like an upper bound on their frequency in trends in general. However some trends we investigated for fairly limited periods, so these may have contained more discontinuities than we found.)\n* Trends we investigated had in expectation [2.3](https://docs.google.com/spreadsheets/d/1iMIZ57Ka9-ZYednnGeonC-NqwGC7dKiHN9S-TAxfVdQ/edit#gid=1906429870&range=I50) discontinuities each, including [1](https://docs.google.com/spreadsheets/d/1iMIZ57Ka9-ZYednnGeonC-NqwGC7dKiHN9S-TAxfVdQ/edit#gid=1906429870&range=K50) large discontinuity each, and [0.37](https://docs.google.com/spreadsheets/d/1iMIZ57Ka9-ZYednnGeonC-NqwGC7dKiHN9S-TAxfVdQ/edit#gid=1906429870&range=M50) large robust discontinuities each (that we found–we did not necessarily investigate trends for the entirety of their history).\n* We found [88](https://docs.google.com/spreadsheets/d/1iMIZ57Ka9-ZYednnGeonC-NqwGC7dKiHN9S-TAxfVdQ/edit#gid=1906429870&range=I2) substantial discontinuities, [20](https://docs.google.com/spreadsheets/d/1iMIZ57Ka9-ZYednnGeonC-NqwGC7dKiHN9S-TAxfVdQ/edit#gid=1906429870&range=M2:N2) of them robust, [14](https://docs.google.com/spreadsheets/d/1iMIZ57Ka9-ZYednnGeonC-NqwGC7dKiHN9S-TAxfVdQ/edit#gid=1906429870&range=M2) of them large and robust.\n* These discontinuities were produced by 63 distinct events, 29 of them producing large discontinuities.\n* The robust large discontinuities were produced by 10 events\n* [32%](https://docs.google.com/spreadsheets/d/1iMIZ57Ka9-ZYednnGeonC-NqwGC7dKiHN9S-TAxfVdQ/edit#gid=1906429870&range=M45) of trends we investigated saw at least one large, robust discontinuity (though note that trends were selected for being discontinuous, and were a very non-uniform collection of topics, so this could at best inform an upper bound on how likely an arbitrary trend is to have a large, robust discontinuity somewhere in a chunk of its history)\n* [53%](https://docs.google.com/spreadsheets/d/1iMIZ57Ka9-ZYednnGeonC-NqwGC7dKiHN9S-TAxfVdQ/edit#gid=1906429870&range=I45) of trends saw any discontinuity (including smaller and non-robust ones), and in expectation a trend saw [more than two](https://docs.google.com/spreadsheets/d/1iMIZ57Ka9-ZYednnGeonC-NqwGC7dKiHN9S-TAxfVdQ/edit#gid=1906429870&range=I50) of these discontinuities.\n* On average, each trend had [0.001](https://docs.google.com/spreadsheets/d/1iMIZ57Ka9-ZYednnGeonC-NqwGC7dKiHN9S-TAxfVdQ/edit#gid=1906429870&range=AG43) large robust discontinuities per year, or [0.002](https://docs.google.com/spreadsheets/d/1iMIZ57Ka9-ZYednnGeonC-NqwGC7dKiHN9S-TAxfVdQ/edit#gid=1906429870&range=AG49) for those trends with at least one at some point[10](https://aiimpacts.org/discontinuous-progress-investigation/#easy-footnote-bottom-10-414 \"Across trends where it seemed reasonable to compare, not e.g. where we only looked at a single development. Also note that this is the average of discontinuity/years ratios across trends, not the number of discontinuities across all trends divided by the number of years across all trends.\")\n* On average [1.4%](https://docs.google.com/spreadsheets/d/1iMIZ57Ka9-ZYednnGeonC-NqwGC7dKiHN9S-TAxfVdQ/edit#gid=1906429870&range=AE43) of new data points in a trend make for large robust discontinuities, or [4.9%](https://docs.google.com/spreadsheets/d/1iMIZ57Ka9-ZYednnGeonC-NqwGC7dKiHN9S-TAxfVdQ/edit#gid=1906429870&range=AE49) for trends which have one.\n* On average [14%](https://docs.google.com/spreadsheets/d/1iMIZ57Ka9-ZYednnGeonC-NqwGC7dKiHN9S-TAxfVdQ/edit#gid=1906429870&range=AB43) of total progress in a trend came from large robust discontinuities (or [16%](https://docs.google.com/spreadsheets/d/1iMIZ57Ka9-ZYednnGeonC-NqwGC7dKiHN9S-TAxfVdQ/edit#gid=1906429870&range=AC43) of logarithmic progress), or [38%](https://docs.google.com/spreadsheets/d/1iMIZ57Ka9-ZYednnGeonC-NqwGC7dKiHN9S-TAxfVdQ/edit#gid=1906429870&range=AB49) among trends which have at least one.\n* Across all years of any metric we considered, the rate of discontinuities/year was around 0.02% (though note that this is heavily influenced by how often you consider thousands of years with poor data at the start).\n\n\nSome fuller related data, from [spreadsheet](https://docs.google.com/spreadsheets/d/1iMIZ57Ka9-ZYednnGeonC-NqwGC7dKiHN9S-TAxfVdQ/edit#gid=330500000&range=C5:G14):\n\n\n\n\n\n\n\n\n\n| | All discontinuities | Large | Robust | Robust large |\n| Metrics checked | 38 | 38 | 38 | 38 |\n| Discontinuity count | 88 | 39 | 20 | 14 |\n| Trends exhibiting that type of discontinuity | 20 | 15 | 16 | 12 |\n| Trends with 2+ discontinuities of that type | 14 | 10 | 4 | 2 |\n| P(discontinuity|trend) | 0.53 | 0.39 | 0.42 | 0.32 |\n| E(discontinuities per trend) | 2.3 | 1.0 | 0.5 | 0.4 |\n| P(multiple discontinuities|trend) | 0.37 | 0.26 | 0.11 | 0.05 |\n| P(multiple discontinuities|trend with at least one) | 0.70 | 0.67 | 0.25 | 0.17 |\n| P(multiple discontinuities|trend with at least one, and enough search to find more) | 0.78 | 0.77 | 0.29 | 0.20 |\n\n\n##### Nature of discontinuous metrics\n\n\nWe categorized each metric as one of:\n\n\n1. ‘technical’: to do with basic physical parameters (e.g. light intensity, particle energy in particle accelerators)\n2. ‘product’: to do with usable goods or services (e.g. cotton ginned per person per day, size of largest ships, height of tallest structures)\n3. ‘industry’: to do with an entire industry rather than individual items (e.g. total production of books)\n4. ‘societal’: to do with society at large (e.g. syphilis mortality)\n\n\nWe also categorized each metric as one of:\n\n\n1. ‘feature’: a characteristic that is good, but not close to encompassing the purpose of most related efforts (e.g. ship size, light intensity)\n2. ‘performance proxy’: approximates the purpose of the endeavor (e.g. cotton ginned per person per day, effectiveness of syphilis treatment)\n3. ‘value proxy’: approximates the all-things-considered value of the endeavor (e.g. real price of books, cost-effectiveness of explosives)\n\n\nMost metrics fell into ‘product feature’ (16) ‘technical feature’ (8) or ‘product performance proxy’ (6), with the rest (8) spread across the categories.\n\n\nHere is what these trends are like ([from this spreadsheet](https://docs.google.com/spreadsheets/d/1iMIZ57Ka9-ZYednnGeonC-NqwGC7dKiHN9S-TAxfVdQ/edit#gid=600317213&range=AC72:AG84)):\n\n\n\n\n\n| | | | | |\n| --- | --- | --- | --- | --- |\n| | product feature | technical feature | product performance proxy | rare categories |\n| **All discontinuities** | | | | |\n| number of discontinuities | 73 | 8 | 2 | 5 |\n| number of trends | 16 | 8 | 6 | 8 |\n| number of trends with discontinuities | 13 | 4 | 2 | 1 |\n| discontinuities per trend | 4.6 | 1.0 | 0.3 | 0.6 |\n| fraction of trends with discontinuity | 0.81 | 0.50 | 0.33 | 0.13 |\n| **Large discontinuities** | | | | |\n| number of large discontinuities | 32 | 3 | 0 | 4 |\n| number of trends | 16 | 8 | 6 | 8 |\n| number of trends with large discontinuities | 11 | 3 | 0 | 1 |\n| large discontinuities per trend | 2.0 | 0.4 | 0.0 | 0.5 |\n| fraction of trends with large discontinuity | 0.69 | 0.38 | 0.00 | 0.13 |\n\n\n\n*Primary authors: Katja Grace, Rick Korzekwa, Asya Bergal*, *Daniel Kokotajlo.*\n\n\n*Thanks to many other researchers whose work contributed to this project.* \n\n\n*Thanks to Stephen Jordan, Jesko Zimmermann, Bren Worth, Finan Adamson, and others for suggesting potential discontinuities for this project in response to our 2015 bounty, and to many others for suggesting potential discontinuities since, especially notably Nuño Sempere, who conducted a detailed independent investigation into discontinuities in ship size and time to circumnavigate the world*[11](https://aiimpacts.org/discontinuous-progress-investigation/#easy-footnote-bottom-11-414 \"Nuño Sempere. “Discontinuous Progress in Technological Trends.” Accessed March 8, 2021. https://nunosempere.github.io/rat/Discontinuous-Progress.html.\")*.* \n\n\nNotes\n-----\n\n\n\n\n\n", "url": "https://aiimpacts.org/discontinuous-progress-investigation/", "title": "Discontinuous progress investigation", "source": "aiimpacts.org", "source_type": "wordpress", "date_published": "2015-02-02T19:11:36+00:00", "paged_url": "https://aiimpacts.org/feed?paged=23", "authors": ["Katja Grace"], "id": "0dee1dbb1adf88831b6877b4d777ac20", "summary": []}
{"text": "List of Analyses of Time to Human-Level AI\n\nThis is a list of most of the substantial analyses of AI timelines that we know of. It also covers most of the arguments and opinions of which we are aware.\n\n\nDetails\n-------\n\n\nThe list below contains substantial publically available analyses of when human-level AI will appear. To qualify for the list, an item must provide both a claim about when human-level artificial intelligence (or a similar technology) will exist, and substantial reasoning to support it. ‘Substantial’ is subjective, but a fairly low bar with some emphasis on detail, novelty, and expertise. We exclude arguments that AI is impossible, though they are technically about AI timelines.\n\n\n### List\n\n\n* [Good, Some future social repercussions of computers](http://www.tandfonline.com/doi/abs/10.1080/00207237008709398?journalCode=genv20) (1970) predicts 1993 give or take a decade, based roughly on the availability of sufficiently cheap, fast, and well-organized electronic components, or on a good understanding of the nature of language, and on the number of neurons in the brain.\n* [Moravec, Today’s Computers, Intelligent Machines and Our Future](https://www.frc.ri.cmu.edu/~hpm/project.archive/general.articles/1978/analog.1978.html) (1978) projects that ten years later hardware equivalent to a human brain would be cheaply available, and that if software development ‘kept pace’ then machines able to think as well as a human would begin to appear then.\n* [Solomonoff, The Time Scale of Artificial Intelligence: Reflections on Social Effects](http://iospress.metapress.com/content/h505v60q46562260/) (1985) estimates one to fifty years to a general theory of intelligence, then ten or fifteen years to a machine with general problem solving capacity near that of a human, in some technical professions.\n* [Waltz, The Prospect for Building Truly Intelligent Machines](http://www.jstor.org/discover/10.2307/20025144?sid=21105674354083&uid=4&uid=2) (1988) predicts human-level hardware in 2017 and says the development of human-level AI might take another twenty years.\n* [Vinge, The Coming Technological Singularity: How to Survive in the post-Human Era](http://www-rohan.sdsu.edu/faculty/vinge/misc/singularity.html) (1993) argues for less than thirty years from 1993, largely based on hardware extrapolation.\n* [Eder, Re: The Singularity](http://www.aleph.se/Trans/Global/Singularity/singul.txt) (1993) argues for 2035 based on two lines of reasoning: hardware extrapolation to computation equivalent to the human brain, and hyperbolic human population growth pointing to a singularity at that time.\n* [Yudkowsky, Staring Into the Singularity 1.2.5](http://www.yudkowsky.net/obsolete/singularity.html) (1996) presents calculation suggesting a singularity will occur in 2021, based on hardware extrapolation and a simple model of recursive hardware improvement.\n* [Bostrom, How Long Before Superintelligence?](http://www.nickbostrom.com/superintelligence.html)(1997) argues that it is plausible to expect superintelligence in the first third of the 21st Century. In 2008 he added that he did not think the probability of this was more than half.\n* [Bostrom, When Machines Outsmart Humans](http://www.nickbostrom.com/2050/outsmart.html)(2000) argues that we should take seriously the prospect of human-level AI before 2050, based on hardware trends and feasibility of uploading or software based on understanding the brain.\n* [Kurzweil, The Singularity is Near](http://aiimpacts.org/kurzweil-the-singularity-is-near/ \"Kurzweil, The Singularity is Near\")[(pdf)](http://hfg-resources.googlecode.com/files/SingularityIsNear.pdf) (2005) predicts 2029, based mostly on hardware extrapolation and the belief that understanding necessary for software is growing exponentially. He also made a [bet](http://longbets.org/1/) with Mitchell Kapor, which he explains along with the bet and [here](https://web.archive.org/web/20110720061136/http://www.kurzweilai.net/a-wager-on-the-turing-test-why-i-think-i-will-win). Mitchell also explains his reasoning alongside the bet, though it nonspecific about timing to the extent that it isn’t clear whether he thinks AI will ever occur, which is why he isn’t included in this list.\n* [Peter Voss, Increased Intelligence, Improved Life](http://archive.today/s45ly) [(video)](http://vimeo.com/33959613) (2007) predicts less than ten years and probably less than five, based on the perception that other researchers pursue unnecessarily difficult routes, and that shortcuts probably exist.\n* [Moravec, The Rise of the Robots](http://www.scientificamerican.com/article/rise-of-the-robots/) (2009) predicts AI rivalling human intelligence well before 2050, based on progress in hardware, estimating how much hardware is equivalent to a human brain, and comparison with animals whose brains appear to be equivalent to present-day computers. Moravec made similar predictions in the 1988 book *Mind Children*.\n* [Legg, Tick, Tock, Tick Tock Bing](http://www.vetta.org/2009/12/tick-tock-tick-tock-bing/) (2009) predicts 2028 in expectation, based on details of progress and what remains to be done in neuroscience and AI. He agreed with this prediction in [2012](http://www.vetta.org/2011/12/goodbye-2011-hello-2012/).\n* [Allen, The Singularity Isn’t Near](http://aiimpacts.org/allen-the-singularity-isnt-near/ \"Allen, The Singularity Isn’t Near\")(2011) criticizes Kurzweil’s [prediction](http://aiimpacts.org/kurzweil-the-singularity-is-near/ \"Kurzweil, The Singularity is Near\") of a singularity around 2045, based mostly on disagreeing with Kurzweil on rates of brain science and AI progress.\n* [Hutter, Can Intelligence Explode](http://www.hutter1.net/publ/singularity.pdf) (2012) uses a prediction of not much later than the 2030s, based on hardware extrapolation, and the belief that software will not lag far behind.\n* [Chalmers (2010)](http://consc.net/papers/singularity.pdf) guesses that human-level AI is more likely than not this century. He points to several early estimates, but expresses skepticism about hardware extrapolation, based on the apparent algorithmic difficulty of AI. He argues that AI should be feasible within centuries (conservatively) based on the possibility of brain emulation, and the past success of evolution.\n* [Fallenstein and Mennen](http://intelligence.org/files/PredictingAGI.pdf) (2013) suggest using a Pareto distribution to model time until we get a clear sign that human-level AI is imminent. They get a median estimate of about 60 years, depending on the exact distribution (based on an estimate of 60 years since the beginning of the field).\n* [Drum, Welcome, Robot Overlords. Please Don’t Fire Us?](http://www.motherjones.com/media/2013/05/robots-artificial-intelligence-jobs-automation) (2013) argues for around 2040, based on hardware extrapolation.\n* [Muehlhauser, When will AI be Created?](http://intelligence.org/2013/05/15/when-will-ai-be-created/) (2013) argues for uncertainty, based on surveys being unreliable, hardware trends being insufficient without software, and software being potentially jumpy.\n* [Bostrom, Superintelligence](http://en.wikipedia.org/wiki/Superintelligence:_Paths,_Dangers,_Strategies) (2014) concludes that ‘…it may be reasonable to believe that human-level machine intelligence has a fairly sizeable chance of being developed by mid-century and that it has a non-trivial chance of being developed considerably sooner or much later…’, based on expert surveys and interviews, such as [these](http://aiimpacts.wpengine.com/muller-and-bostrom-ai-progress-poll/ \"Müller and Bostrom AI Progress Poll\").\n* [Sutton, Creating Human Level AI: How and When?](http://futureoflife.org/PDF/rich_sutton.pdf) (2015) places a 50% chance on human-level AI by 2040, based largely on hardware extrapolation and the view that software has a 1/2 chance of following within a decade of sufficient hardware.\n", "url": "https://aiimpacts.org/list-of-analyses-of-time-to-human-level-ai/", "title": "List of Analyses of Time to Human-Level AI", "source": "aiimpacts.org", "source_type": "wordpress", "date_published": "2015-01-22T14:39:11+00:00", "paged_url": "https://aiimpacts.org/feed?paged=23", "authors": ["Katja Grace"], "id": "216eef354d86bc1f96ae45ad256315de", "summary": []}
{"text": "The slow traversal of ‘human-level’\n\n*By Katja Grace, 21 January 2015*\n\n\nOnce you have normal-human-level AI, [how long does it take](http://aiimpacts.wpengine.com/is-the-range-of-human-intelligence-small/ \"The range of human intelligence\") to get Einstein-level AI? We have seen that a common argument for ‘not long at all’ based on brain size [does not work](http://aiimpacts.wpengine.com/making-or-breaking-a-thinking-machine/ \"Making or breaking a thinking machine\") in a straightforward way, though a more nuanced assessment of the evidence might. Before we get to that though, let’s look at some more straightforward evidence (from [our new page](http://aiimpacts.wpengine.com/is-the-range-of-human-intelligence-small/ \"The range of human intelligence\") on the range of human intelligence).\n\n\nIn particular, let’s look at chess. AI can play superhuman-level chess, so we can see how it got there. And how it got there is via about four decades of beating increasingly good players, starting at beginners and eventually passing [Kasparov](http://en.wikipedia.org/wiki/Garry_Kasparov) (note that a beginner is something like [level F](http://en.wikipedia.org/wiki/Elo_rating_system#United_States_Chess_Federation_ratings) or below, which doesn’t make it onto this graph):\n\n\n[](http://aiimpacts.wpengine.com/wp-content/uploads/2014/12/chess_progress.gif)Figure 1: Chess AI progress compared to human performance, from [Coles 2002](http://www.drdobbs.com/parallel/computer-chess-the-drosophila-of-ai/184405171). The original article was apparently written before 1993, so note that the right of the graph (after ‘now’) is imagined, though it appears to be approximately correct.\nSomething similar is true in Go (where -20 on this graph is a good beginner score, and go bots are not yet superhuman, but getting close):\n\n\n[](http://aiimpacts.wpengine.com/wp-content/uploads/2014/12/gobothistory-copy.jpg)From [Grace 2013](http://intelligence.org/files/AlgorithmicProgress.pdf).\nBackgammon and poker AI’s seems to have progressed similarly, though backgammon took about 2 rather than 4 decades (we will soon post more detailed descriptions of progress in board games).\n\n\nGo, chess, poker, and backgammon are all played using different algorithms. But the underlying problems are sufficiently similar that they could easily all be exceptions.\n\n\nOther domains are harder to measure, but seem basically consistent with gradual progress. Machine translation seems to be gradually moving through the range of human expertise, as does automatic driving. There are fewer clear cases where AI abilities took years rather than decades to move from subhuman to superhuman, and the most salient cases are particularly easy or narrow problems (such as arithmetic, narrow perceptual tasks, or easy board games).\n\n\nIf narrow AI generally traverses the relevant human range slowly, this suggests that general AI will take some time to go from minimum minimum wage competency to—well, at least to [AI researcher competency](http://en.wikipedia.org/wiki/Technological_singularity). If you combine many narrow skills, each progressing gradually through the human spectrum at different times, you probably wouldn’t end up with a much more rapid change in general performance. And it isn’t clear that a more general method should tend to progress faster than narrow AI.\n\n\nHowever, we can point to ways that general AI might be different from board game AI.\n\n\nPerhaps progress in chess and go has mostly been driven by hardware progress, while progress in general AI will be driven by algorithmic improvements or acquiring more training data.\n\n\nPerhaps the kinds of algorithms people really use to think scale much better than chess algorithms. Chess algorithms only become [30-60 Elo points](http://intelligence.org/files/AlgorithmicProgress.pdf) stronger with each doubling of hardware, whereas a very rough calculation suggests human brains become more like 300 Elo points better per doubling in size.\n\n\nIn humans, [brain size has roughly a 1/3 correlation](http://en.wikipedia.org/wiki/Neuroscience_and_intelligence#Brain_size) with intelligence. Given that the standard deviation of brain size is about 10% of the size of the brain ([p. 39](https://books.google.com/books?id=KReeRcshYSMC&pg=PA40&lpg=PA40&dq=standard+deviation+of+human+brain+size&source=bl&ots=KnTcwf2Fuc&sig=awJuz6Z8zH0B9Uv-9Pq_iW9tlRQ&hl=en&sa=X&ei=1va_VIbaDMuwogSQsYLABQ&ved=0CDsQ6AEwBA#v=onepage&q=standard%20deviation%20of%20human%20brain%20size&f=false)), this suggests that a doubling of brain size leads to a relatively large change in chess-playing ability. On a log scale, a doubling is a 7 standard deviation change in brain size, which would suggest a ~2 standard deviation change in intelligence. It’s hard to know how this relates to chess performance, but in *Genius in Chess* Levitt [gives](http://www.jlevitt.dircon.co.uk/iq.htm) an unjustified estimate of 300 Elo points. This is what we would expect if intelligence were responsible for half of variation in performance (neglecting the lower variance of chess player intelligence), since a standard deviation of chess performance is [about 2000/7 ~ 300 Elo](http://en.wikipedia.org/wiki/Elo_rating_system). Each of these correlations is problematic but nevertheless suggestive.\n\n\nIf human intelligence in general scales much better with hardware than existing algorithms, and hardware is important relative to software, then AI based on an understanding of human intelligence may scale from sub-human to superhuman more quickly than the narrow systems we have seen. However these are both open questions.\n\n\n*(Image: [The Chess Players](http://commons.wikimedia.org/wiki/File:Honor%C3%A9_Daumier_032.jpg), by Honoré Daumier)*\n\n", "url": "https://aiimpacts.org/the-slow-traversal-of-human-level/", "title": "The slow traversal of ‘human-level’", "source": "aiimpacts.org", "source_type": "wordpress", "date_published": "2015-01-21T19:34:14+00:00", "paged_url": "https://aiimpacts.org/feed?paged=23", "authors": ["Katja Grace"], "id": "8ad007e706f5d3cc28cf01e03f85dc1f", "summary": []}
{"text": "Making or breaking a thinking machine\n\n*By Katja Grace, 18 January 2015*\n\n\nHere is a superficially plausible argument: the brains of the slowest humans are almost identical to those of the smartest humans. And thus—in the great space of possible intelligence—the ‘human-level’ band must be very narrow. Since all humans are basically identical in design—since you can move from the least intelligent human to the sharpest human with imperceptible changes—then artificial intelligence development will probably cross this band of human capability in a blink. It won’t stop on the way to spend years being employable but cognitively limited, or proficient but not promotion material. It will be superhuman before you notice it’s nearly human. And from our anthropomorphic viewpoint, from which the hop separating [village idiot and Einstein](http://lesswrong.com/lw/ql/my_childhood_role_model/) looks like most of the spectrum, this [might seem](https://intelligence.org/files/AIPosNegFactor.pdf) like shockingly sudden progress.\n\n\nThis whole line of reasoning is wrong.\n\n\nIt is true that human brains are very similar. However, this implies very little about the design difficulty of moving from the intelligence of one to the intelligence of the other artificially. The basic problem is that the smartest humans need not be better-designed — they could be better instantiations of the same design.\n\n\nWhat’s the difference? Consider an analogy. Suppose you have a yard full of [rocket cars](http://en.wikipedia.org/wiki/Rocket_car). They all look basically the same, but you notice that their peak speeds are very different. Some of the cars can drive at a few hundred miles per hour, while others can barely accelerate above a crawl. You are excited to see this wide range of speeds, because you are a motor enthusiast and have been building your own vehicle. Your car is not quite up to the pace of the slowest cars in your yard yet, but you figure that since all those cars are so similar, once you get it to two miles per hour, it will soon be rocketing along.\n\n\nIf a car is slow because it is a rocket car with a broken fuel tank, that car will be radically simpler to improve than the first car you build that can go over 2 miles per hour. The difference is something like an afternoon of tinkering vs. [two](http://en.wikipedia.org/wiki/Nicolas-Joseph_Cugnot) [centuries](http://en.wikipedia.org/wiki/Rocket_car). This is intuitively because the broken rocket car already contains almost all of the design effort in making a fast rocket car. It’s not being used, but you know it’s there and how to use it.\n\n\nSimilarly, if you have a population of humans, and some of them are severely cognitively impaired, you shouldn’t get too excited about the prospects for your severely cognitively impaired robot.\n\n\nAnother way to see there must be something wrong with the argument is to note that humans can actually be arbitrarily cognitively impaired. Some of them are even dead. And the brain of a dead person can closely resemble the brain of a live person. Yet while these brains are again very similar in design, AI passed dead-human-level years ago, and this did not suggest that it was about to zip on past live-human-level.\n\n\nHere is a different way to think about the issue. Recall that we were trying to infer from the range of human intelligence that AI progress would be rapid across that range. However, we can predict that human intelligence has a good probability of varying significantly, using only evolutionary considerations that are orthogonal to the ease of AI development.\n\n\nIn particular, if much of the variation in intelligence is from deleterious mutations, then the distribution of intelligence is more or less set by the equilibrium between selection pressure for intelligence and the appearance of new mutations. Regardless of how hard it was to design improvements to humans, we would always see this spectrum of cognitive capacities, so this spectrum cannot tell us about how hard it is to improve intelligence by design. (Though this would be different if the harm inflicted by a single mutation was likely to be closely related to the difficulty of designing an incrementally more intelligent human).\n\n\nIf we knew more about the sources of the variation in human intelligence, we might be able to draw a stronger conclusion. And if we entertain several possible explanations for the variation in human intelligence, we can still infer something; but the strength of our inference is limited by the prior probability that deleterious mutations on their own can lead to significant variation in intelligence. Without learning more, this probability shouldn’t be very low.\n\n\nIn sum, while the brain of an idiot is designed much like that of a genius, this does not imply that designing a genius is about as easy as designing an idiot.\n\n\nWe are still [thinking about this](http://aiimpacts.wpengine.com/is-the-range-of-human-intelligence-small/ \"The range of human intelligence\"), so now is a good time to tell us if you disagree. I even turned on commenting, to make it easier for you. It should work on all of the blog posts now.\n\n\n[](http://aiimpacts.wpengine.com/wp-content/uploads/2015/01/1024px-RAR2009_-_Rocket_Car.jpg)[Rocket car](http://commons.wikimedia.org/wiki/File:RAR2009_-_Rocket_Car.jpg), photographed by Jon ‘ShakataGaNai’ Davis.\n*(Top image: [One of the first cars](http://en.wikipedia.org/wiki/Nicolas-Joseph_Cugnot#mediaviewer/File:Nicholas-Cugnots-Dampfwagen.png), [1769](http://en.wikipedia.org/wiki/Nicolas-Joseph_Cugnot))*\n\n", "url": "https://aiimpacts.org/making-or-breaking-a-thinking-machine/", "title": "Making or breaking a thinking machine", "source": "aiimpacts.org", "source_type": "wordpress", "date_published": "2015-01-18T20:59:27+00:00", "paged_url": "https://aiimpacts.org/feed?paged=23", "authors": ["Katja Grace"], "id": "c0359e31c4f0b5f17130563b0e69c372", "summary": []}
{"text": "The range of human intelligence\n\n***This page may be out-of-date. Visit the [updated version of this page](https://wiki.aiimpacts.org/doku.php?id=speed_of_ai_transition:range_of_human_performance:the_range_of_human_intelligence) on our [wiki](https://wiki.aiimpacts.org/doku.php?id=start).***\n\n\nThe range of human intelligence seems large relative to the space below it, as measured by performance on tasks we care about—despite the fact that human brains are extremely similar to each other. \n\n\nWithout knowing more about the sources of variation in human performance, however, we cannot conclude much at all about the likely pace of progress in AI: we are likely to observe significant variation regardless of any underlying facts about the nature of intelligence.\n\n\nDetails\n-------\n\n\n### Measures of interest\n\n\n#### Performance\n\n\nIQ is one measure of cognitive performance. Chess ELO is a narrower one. We do not have a general measure that is meaningful across the space of possible minds. However when people speak of ‘superhuman intelligence’ and the intelligence of animals they imagine that these can be meaningfully placed on some rough spectrum. When we say ‘performance’ we mean this kind of intuitive spectrum.\n\n\n#### Development effort\n\n\nWe are especially interested in measuring intelligence by the difficulty of building a machine which exhibits that level of intelligence. We will not use a formal unit to measure this distance, but are interested in comparing the range between humans to distances between other milestones, such as that between a mouse and a human, or a rock and a mouse.\n\n\n### Variation in cognitive performance\n\n\nIt is sometimes argued that humans occupy a very narrow band in the spectrum of cognitive performance. For instance, Eliezer Yudkowsky defends this rough schemata[1](https://aiimpacts.org/is-the-range-of-human-intelligence-small/#easy-footnote-bottom-1-191 \"“My Childhood Role Model – LessWrong 2.0.” Accessed June 3, 2020. https://www.lesswrong.com/posts/3Jpchgy53D2gB5qdk/my-childhood-role-model.\")—\n\n\n[](http://aiimpacts.wpengine.com/wp-content/uploads/2014/12/sophVI_einstein-copy1.jpg)\n\n\n—over these, which he attributes to others:\n\n\n[](http://aiimpacts.wpengine.com/wp-content/uploads/2014/12/modsofVI_einstein-copy.jpg)\n\n\n[](http://aiimpacts.wpengine.com/wp-content/uploads/2014/12/VI_einstein-copy.jpg)\n\n\nSuch arguments sometimes go further, to suggest that AI development effort needed to traverse the distance from the ‘village idiot’ to Einstein is also small, and so given that it seems so large to us, AI progress at around human level will [seem very fast](http://aiimpacts.org/likelihood-of-discontinuous-progress-around-the-development-of-agi/).\n\n\nThe landscape of performance is not easy to parameterize well, as there are many cognitive tasks and dimensions of cognitive ability, and no good global metric for comparison across different organisms. Nonetheless, we offer several pieces of evidence to suggest that the human range is substantial, relative to the space below it. We do not approach the topic here of how far above human level the space of possible intelligence reaches.\n\n\n#### Low human performance on specific tasks\n\n\nFor most tasks, human performance reaches all of the way to the bottom of the possible spectrum. At the extreme, some comatose humans will fail at almost any cognitive task. Our impression is that people who are completely unable to perform a task are not usually isolated outliers, but that there is a distribution of people spread across the range from completely incapacitated to world-champion level. That is, for a task like ‘recognize a cat’, there are people who can only do slightly better than if they were comatose.\n\n\nFor our purposes we are more interested in where normal human cognitive performance fall relative to the worst and best possible performance, and the best human performance.\n\n\n#### Mediocre human performance relative to high human performance\n\n\nOn many tasks, it seems likely that the best humans are many times better than mediocre humans, using relatively objective measures.[2](https://aiimpacts.org/is-the-range-of-human-intelligence-small/#easy-footnote-bottom-2-191 \"In particular\")\n\n\n[Shockley (1957)](http://www.gwern.net/docs/1957-shockley.pdf) found that in science, the productivity of the top researchers in a laboratory was often at least ten times as great as the least productive (and most numerous) researchers. Programmers [purportedly](http://programmers.stackexchange.com/questions/179616/a-good-programmer-can-be-as-10x-times-more-productive-than-a-mediocre-one) vary by an order of magnitude in productivity, though this is debated. A third of people scored nothing in [this](https://math.mit.edu/news/spotlight/Putnam-2012-Results.pdf) Putnam competition, while someone scored 100. Some people have to work ten times harder to pass their high school classes than others.\n\n\nNote that these differences are among people skilled enough to actually be in the relevant field, which in most cases suggests they are above average. Our impression is that something similar is true in other areas such as sales, entrepreneurship, crafts, and writing, but we have not seen data on them.\n\n\nThese large multipliers on performance at cognitive tasks suggest that the range between mediocre cognitive ability and genius is many times larger than the range below mediocre cognitive ability. However it is not clear that such differences are common, or to what extent they are due to differences in underlying general cognitive ability, rather than learning or non-cognitive skills, or a range of different cognitive skills that aren’t well correlated.\n\n\n#### Human performance spans a wide range in other areas\n\n\nIn qualities other than intelligence, humans appear to span a fairly wide range below their peak levels. For instance, the fastest human runners are multiple times faster than mediocre runners ([twice as fast](http://www.telegraph.co.uk/sport/olympics/athletics/9450234/100m-final-how-fast-could-you-run-it.html) at a 100m sprint, [four](http://www.livestrong.com/article/551509-a-good-mile-rate-for-a-beginner-runner/) [times](http://en.wikipedia.org/wiki/Mile_run) as fast for a mile). Humans can vary in height by a factor of about [four](http://www.dailymail.co.uk/news/article-2832768/The-odd-couple-Shortest-man-21-5ins-meets-tallest-living-person-8ft-1in-outside-Houses-Parliament-Guinness-World-Record-Day.html), and commonly do by a factor of about 1.5. The most accurate painters are [hard to distinguish](http://twistedsifter.com/2012/04/15-hyperrealistic-paintings-that-look-like-photos-campos/) from photographs, while some painters are [arguably](http://www.psychologytoday.com/blog/psyched/201103/my-monkey-could-have-painted-really) hard to distinguish from monkeys, which are very easy to distinguish from photographs. These observations weakly suggest that the default expectation should be for humans to span a wide absolute range in cognitive performance also.\n\n\n#### AI performance on human tasks\n\n\nIn domains where we have observed human-level performance in machines, we have seen rather gradual improvement across the range of human abilities. Here are five relevant cases that we know of:\n\n\n1. **Chess:** human chess Elo ratings conservatively range from around [800 (beginner)](http://en.wikipedia.org/wiki/Elo_rating_system#United_States_Chess_Federation_ratings) to 2800 (world champion). The following figure illustrates how it took chess AI roughly forty years to move incrementally from 1300 to 2800.\n\n\n[](http://aiimpacts.wpengine.com/wp-content/uploads/2014/12/chess_progress.gif)Figure 1: Chess AI progress compared to human performance, from [Coles 2002](http://www.drdobbs.com/parallel/computer-chess-the-drosophila-of-ai/184405171). The original article was apparently written before 1993, so note that the right of the graph (after ‘now’) is imagined, though it appears to be approximately correct.\n\n\n2. **Go:** Human go ratings [range](http://en.wikipedia.org/wiki/Go_ranks_and_ratings) from 30-20 kyu (beginner) to at least 9p (10p is a special title). Note that the numbers go downwards through kyu levels, then upward through dan levels, then upward through p(rofessional dan) levels. The following figure suggests that it took around 25 years for AI to cover most of this space (the top ratings seem to be [closer together](http://en.wikipedia.org/wiki/Go_ranks_and_ratings#Elo-like_rating_systems_as_used_in_Go) than the lower ones, though there are apparently [multiple systems](https://en.wikipedia.org/wiki/Go_ranks_and_ratings#Winning_probabilities) which vary).\n\n\n[](http://aiimpacts.wpengine.com/wp-content/uploads/2014/12/gobothistory-copy.jpg)Figure 2. From [Grace 2013](http://intelligence.org/files/AlgorithmicProgress.pdf).\n\n\n3. **Checkers:**According to [Wikipedia’s timeline of AI](http://en.wikipedia.org/wiki/Timeline_of_artificial_intelligence), a program was written in 1952 that could challenge a respectable amateur. In 1994 Chinook beat the second highest rated player ever. (In 2007 checkers was solved.) Thus it took around forty years to pass from amateur to world-class checkers-playing. We know nothing about whether intermediate progress was incremental however.\n\n\n4. **Physical manipulation:** we have not investigated this much, but our impression is that robots are somewhere in the the fumbling and slow part of the human spectrum on [some](http://youtu.be/oD9DE0HjMM4) [tasks](https://www.youtube.com/watch?v=IBY4t8XxH7E), and that nobody expects them to reach the ‘normal human abilities’ part any time soon ([Aaron Dollar estimates](http://aiimpacts.wpengine.com/hanson-ai-expert-survey/ \"Hanson AI Expert Survey\") robotic grasping manipulation in general is less than one percent of the way to human level from where it was 20 years ago).\n\n\n5. **Jeopardy**: AI appears to have taken two or three years to move from lower ‘champion’ level to surpassing world champion level (see [figure 9](https://www.aaai.org/ojs/index.php/aimagazine/article/view/2303/2165); Watson beat Ken Jennings in [2011](http://en.wikipedia.org/wiki/Watson_%28computer%29)). We don’t know how far ‘champion’ level is from the level of a beginner, but would be surprised if it were less than four times the distance traversed here, given the situation in other games, suggesting a minimum of a decade for crossing the human spectrum.\n\n\nIn all of these narrow skills, moving AI from low-level human performance to top-level human performance appears to take on the order of decades. This further undermines the claim that the range of human abilities constitutes a narrow band within the range of possible AI capabilities, though we may expect general intelligence to behave differently, for example due to smaller training effects.\n\n\nOn the other hand, most of the examples here—and in particular the ones that we know the most about—are board games, so this phenomenon may be less usual elsewhere. We have not investigated areas such as Texas hold ’em, arithmetic or constraint satisfaction sufficiently to add them to this list.\n\n\n### What can we infer from human variation?\n\n\nThe brains of humans are nearly identical, [by comparison](http://lesswrong.com/lw/ql/my_childhood_role_model/) to the brains of other animals or to other possible brains that could exist. This might suggest that the engineering effort required to move across the human range of intelligences is quite small, compared to the engineering effort required to move from very sub-human to human-level intelligence (e.g. see [p21 and 29](https://intelligence.org/files/AIPosNegFactor.pdf), [p70](http://en.wikipedia.org/wiki/Superintelligence:_Paths,_Dangers,_Strategies)). The similarity of human brains also suggest that the range of human intelligence is smaller than it seems, and its apparent breadth is due to anthropocentrism (see the same sources). According to these views, board games are an exceptional case–for most problems, it will not take AI very long to close the gap between “mediocre human” and “excellent human.”\n\n\nHowever, we should not be surprised to find meaningful variation in the cognitive performance *regardless* of the difficulty of improving the human brain. This makes it difficult to infer much from the observed variations.\n\n\nWhy should we not be surprised? De novo deleterious mutations are introduced into the genome with each generation, and the prevalence of such mutations is determined by the [balance](http://en.wikipedia.org/wiki/Mutation%E2%80%93selection_balance) of mutation rates and negative selection. If de novo mutations significantly impact cognitive performance, then there must necessarily be significant selection for higher intelligence–and hence behaviorally relevant differences in intelligence. This balance is determined entirely by the mutation rate, the strength of selection for intelligence, and the negative impact of the average mutation.\n\n\nYou can often make a machine worse by breaking a random piece, but this does not mean that the machine was easy to design or that you can make the machine better by adding a random piece. Similarly, levels of variation of cognitive performance in humans may tell us very little about the difficulty of making a human-level intelligence smarter.\n\n\nIn the extreme case, we can observe that brain-dead humans often have very similar cognitive architectures. But this does not mean that it is easy to start from an AI at the level of a dead human and reach one at the level of a living human.\n\n\nBecause we should not be surprised to see significant variation–independent of the underlying facts about intelligence–we cannot infer very much from this variation. The strength of our conclusions are limited by the extent of our possible surprise.\n\n\nBy better understanding the sources of variation in human performance we may be able to make stronger conclusions. For example, if human intelligence is improving rapidly due to the introduction of new architectural improvements to the brain, this suggests that discovering architectural improvements is not too difficult. If we discover that spending more energy on thinking makes humans substantially smarter, this suggests that scaling up intelligences leads to large performance changes. And so on. Existing research in biology addresses the role of deleterious mutations, and depending on the results this literature could be used to draw meaningful inferences.\n\n\nThese considerations also suggest that brain similarity can’t tell us much about the “true” range of human performance. This isn’t too surprising, in light of the analogy with other domains. For example, although the bodies of different runners have nearly identical designs, the worst runners are not nearly as good as the best.\n\n\nxxx[This background rate of human-range crossing is less informative about the future in scenarios where the increasing machine performance of interest is coming about in a substantially different way from how it came about in the past. For instance, it is sometimes hypothesized that major performance improvements will come from fast ‘recursive self improvement’, in which case the characteristic time scale might be much faster. However the scale of the human performance range (and time to cross it) relative to the area below the human range should still be informative.]\n\n", "url": "https://aiimpacts.org/is-the-range-of-human-intelligence-small/", "title": "The range of human intelligence", "source": "aiimpacts.org", "source_type": "wordpress", "date_published": "2015-01-18T20:58:12+00:00", "paged_url": "https://aiimpacts.org/feed?paged=23", "authors": ["Katja Grace"], "id": "9384a20bf2561ce7eb51f8704ef64224", "summary": []}
{"text": "Are AI surveys seeing the inside view?\n\n*By Katja Grace, 15 January 2015*\n\n\nAn interesting thing about the [survey data](http://aiimpacts.wpengine.com/ai-timeline-surveys/ \"AI Timeline Surveys\") on timelines to human-level AI is the apparent incongruity between answers to ‘[when](http://aiimpacts.wpengine.com/muller-and-bostrom-ai-progress-poll/ \"Müller and Bostrom AI Progress Poll\") [will](http://aiimpacts.wpengine.com/agi-09-survey/ \"AGI-09 Survey\") [human-level](http://aiimpacts.wpengine.com/fhi-ai-timelines-survey/ \"FHI Winter Intelligence Survey\") [AI](http://aiimpacts.wpengine.com/kruel-ai-survey/ \"Kruel AI Interviews\") [arrive](http://aiimpacts.wpengine.com/bainbridge-survey/ \"Bainbridge Survey\")?’ and answers to ‘[how much of the way to human-level AI have we come recently?](http://aiimpacts.wpengine.com/hanson-ai-expert-survey/ \"Hanson AI Expert Survey\")‘\n\n\nIn particular, human-level AI [will apparently arrive in thirty or forty years](http://aiimpacts.wpengine.com/ai-timeline-surveys/ \"AI Timeline Surveys\"), while in the past twenty years most specific AI subfields have [apparently moved only five or ten percent](http://aiimpacts.wpengine.com/hanson-ai-expert-survey/ \"Hanson AI Expert Survey\") of the remaining distance to human-level AI, with little sign of acceleration.\n\n\nSome possible explanations:\n\n\n* The question about how far we have come has hardly been asked, and the small sample size has hit slow subfields, or hard-to-impress researchers, perhaps due to a different sampling of events.\n* [Hanson](https://aiimpacts.org/feed/hanson.gmu.edu) (the only person who asked how far we have come) somehow inspires modesty or agreement in his audience. His survey methodology is conversational, and the answers do agree with [his own views](http://www.overcomingbias.com/2012/08/ai-progress-estimate.html).\n* The ‘[inside view](http://www.mckinsey.com/insights/strategy/daniel_kahneman_beware_the_inside_view)‘ is overoptimistic: if you ask a person directly when their project will be done, they tend to [badly underestimate](http://en.wikipedia.org/wiki/Planning_fallacy). Taking the ‘[outside view](http://en.wikipedia.org/wiki/Reference_class_forecasting)‘ – extrapolating from similar past situations – helps to resolve these problems, and is more accurate. The first question invites the inside view, while the second invites the outside view.\n* Different people are willing to answer the different questions.\n* Estimating ‘how much of the way between where we were twenty years ago and human-level capabilities’ is hopelessly difficult, and the answers are meaningless.\n* Estimating ‘when will we have human-level AI?’ is hopelessly difficult, and the answers are meaningless.\n* When people answer the ‘how far have we come in the last twenty years?…’ question, they use a different scale to when they answer the ‘…and are we accelerating?’ question, for instance thinking of where we are as a fraction of what is left to do in the first case, and expecting steady exponential growth in that fraction, but not thinking of steady exponential growth as ‘acceleration’.\n* AI researchers expect a small number of fast-growing subfields to produce AI with the full range of human-level skills, rather than for it to combine contributions from many subfields.\n* Researchers have further information not captured in the past progress and acceleration estimates. In particular, they have reason to expect acceleration.\n\n\nSince the two questions have so far yielded very different answers, it would be nice to check whether the different answers come from the different kinds of questions (rather than e.g. the small and casual nature of the [Hanson survey](http://aiimpacts.wpengine.com/hanson-ai-expert-survey/ \"Hanson AI Expert Survey\")), and to get a better idea of which kind of answer is more reliable. This might substantially change the message we get from looking at the opinions of AI researchers.\n\n\n[Luke Muehlhauser](http://lukemuehlhauser.com/) and I have written before about [how to conduct a larger survey like Hanson’s](https://docs.google.com/document/d/1-eqYP1LumqZohBTGrujyPwj9q9WUx2c2leawzbaXrV0/edit#heading=h.kk4z5v8bo60l). One might also find or conduct experiments comparing these different styles of elicitation on similar predictions that can be sooner verified. There appears to be some contention over which method should be more reliable, so we could also start by having that discussion.\n\n", "url": "https://aiimpacts.org/are-ai-surveys-seeing-the-inside-view/", "title": "Are AI surveys seeing the inside view?", "source": "aiimpacts.org", "source_type": "wordpress", "date_published": "2015-01-16T01:00:02+00:00", "paged_url": "https://aiimpacts.org/feed?paged=24", "authors": ["Katja Grace"], "id": "38a43996d852f2e3b2e7509976f839d3", "summary": []}
{"text": "Event: Multipolar AI workshop with Robin Hanson\n\n*By Katja Grace, 14 January 2015*\n\n\nOn Monday 26 January we will be holding a discussion on promising research projects relating to ‘[multipolar](http://lesswrong.com/lw/l9o/superintelligence_17_multipolar_scenarios/)‘ AI scenarios. That is, future scenarios where society persists in containing a large number of similarly influential agents, rather than a [single winner](http://www.nickbostrom.com/fut/singleton.html) who takes all. The event will be run in collaboration with [Robin Hanson](http://hanson.gmu.edu/), a leading researcher on the social consequences of [whole brain emulation](http://en.wikipedia.org/wiki/Mind_uploading).\n\n\nThe goal of the meeting will be to identify promising concrete research projects.\n\n\nWe will consider projects under various headings, for example:\n\n\n\n> **Causal origins and probability of multipolar scenarios**\n> \n> \n> * Collect past records of lumpiness of AI success\n> * Survey military, business or academic projects which were particularly analogous to successful emulation or AI projects, to learn about the situations in which emulations or AI might appear.\n> * Survey AI experts on the likelihood of AI emerging in the military, business or academia, and on the likely size of a successful AI project.\n> * …\n> \n> \n> **Consequences of multipolar scenarios**\n> \n> \n> * Hanson’s project of detailing a default whole brain emulation scenario\n> * How does the lumpiness of economic outcomes vary as a function of the lumpiness of origins?\n> * Are there initial social institutions which might substantially influence longer term outcomes?\n> * …\n> \n> \n> **Applicability of broader AI safety insights to multipolar outcomes**\n> \n> \n> * How useful are capability control methods, such as boxing, stunting, incentives, or tripwires in a multi-polar scenario?\n> * How useful are motivation selection methods, such as direct specification, domesticity, indirect normatively, augmentation in a multipolar scenario?\n> * Would selective pressures strongly favor the existence of goal-directed agents, in a multipolar scenario where a variety of AI designs are feasible?\n> * …\n> \n> \n> \n\n\n### \n\n\n### Details in brief\n\n\n***Time*:**\n\n\n2pm until 2-3 hours later\n\n\nThere will be an evening social event at 7pm in the same location, which workshop attendees are welcome to stay or return for. Some participants will go to dinner at a nearby restaurant in between.\n\n\n***Date*:** Monday 26 January 2015\n\n\n***Location*:**Private Berkeley residence. Detail available upon RSVP.\n\n\n***RSVP*:** to katja.s.grace@gmail.com.\n\n\nThis is helpful, but not required (if you can deduce the location).\n\n\n***Other things:***Tea, coffee and snacks provided.\n\n\n \n\n", "url": "https://aiimpacts.org/event-multipolar-ai-workshop-with-robin-hanson/", "title": "Event: Multipolar AI workshop with Robin Hanson", "source": "aiimpacts.org", "source_type": "wordpress", "date_published": "2015-01-14T18:52:42+00:00", "paged_url": "https://aiimpacts.org/feed?paged=24", "authors": ["Katja Grace"], "id": "07bc84c9f16621c314d449771e9a68be", "summary": []}
{"text": "Michie and overoptimism\n\n*By Katja Grace, 12 January 2015*\n\n\nWe recently wrote about [Donald Michie’s](http://en.wikipedia.org/wiki/Donald_Michie) [survey](http://aiimpacts.wpengine.com/michie-survey/ \"Michie Survey\") on timelines to human-level AI. Michie’s survey is especially interesting because it was taken in 1972, which is three decades earlier than any other [surveys we know of](http://aiimpacts.wpengine.com/ai-timeline-surveys/ \"AI Timeline Surveys\") that ask about human-level AI.\n\n\nEarly AI predictions are renowned for being absurdly optimistic. And while the scientists in Michie’s survey had had a good decade and a half since the Dartmouth Conference to observe the lack of AI, they were still pretty early. Yet they don’t seem especially optimistic. Their predictions were so far in the future that almost three quarters of them still haven’t been demonstrated wrong.\n\n\nAnd you might think computer scientists in the early 70s would be a bit more optimistic than contemporary forecasters, given that they hadn’t seen so many decades of research not produce human-level AI. But the median estimate they gave for how many years until AI was further out than those given in [almost all](http://aiimpacts.wpengine.com/ai-timeline-surveys/ \"AI Timeline Surveys\") surveys since (fifty years vs. thirty to forty). The survey doesn’t look like it was very granular – there appear to be only five options – so maybe a bunch of people would have said thirty-five years, and rounded up to fifty. Still, their median expectations don’t look like they were substantially more optimistic (in terms of time to AI) than present-day ones.\n\n\nIn terms of absolute dates, the Michie participants’ median fifty-year choice of 2022 is still considered [at least 10% likely](http://aiimpacts.wpengine.com/ai-timeline-surveys/ \"AI Timeline Surveys\") to give rise to human-level AI by recent survey participants, some four decades later.\n\n\nIt’s not like anyone said that all early predictions were embarrassingly optimistic though. Maybe Michie’s computer scientists were outliers? Perhaps, but if everyone else whose predictions we know of disagreed with them, it would be those others who were the outliers: Michie’s survey has sixty-three respondents, whereas [the MIRI dataset](http://lesswrong.com/lw/e79/ai_timeline_prediction_data/) contains only eleven other predictions made before 1980 (it looks like twelve, but the other interesting looking survey attributed to Firschein and Coles appears to be an accidental duplicate of the Michie survey, which Firschein and Coles mention in their paper). Sixty-three is more than all the predictions in the [MIRI dataset](http://lesswrong.com/lw/e79/ai_timeline_prediction_data/) until the 2005 Bainbridge survey.\n\n\nAI researchers may have been extremely optimistic in the very early days (the [MIRI dataset](http://lesswrong.com/lw/e79/ai_timeline_prediction_data/) suggests this, though it consists of public statements, which tend to be more optimistic anyway). However, it doesn’t seem to have taken AI researchers long to move to something like contemporary views. It looks like they didn’t just predict ‘twenty years’ every year since [Dartmouth](http://en.wikipedia.org/wiki/Dartmouth_Conferences).\n\n\n[](http://aiimpacts.wpengine.com/wp-content/uploads/2015/01/michietimelines-copy-1.jpg)Survey results, as shown in Michie’s paper [(pdf download)](https://saltworks.stanford.edu/assets/cf501kz5355.pdf).\nThanks to Luke Muehlhauser for [suggesting](http://lukemuehlhauser.com/some-studies-which-could-improve-our-strategic-picture-of-superintelligence/) this line of inquiry.\n\n\n*(Image: “[Donald Michie teaching](http://commons.wikimedia.org/wiki/File:Donald_Michie_teaching.jpg#mediaviewer/File:Donald_Michie_teaching.jpg)” by Petermowforth)*\n\n", "url": "https://aiimpacts.org/michie-and-overoptimism/", "title": "Michie and overoptimism", "source": "aiimpacts.org", "source_type": "wordpress", "date_published": "2015-01-13T01:24:59+00:00", "paged_url": "https://aiimpacts.org/feed?paged=24", "authors": ["Katja Grace"], "id": "3bd6b74df40babcaf4ae42a7a5f66264", "summary": []}
{"text": "Were nuclear weapons cost-effective explosives?\n\n*By Katja Grace, 11 January 2015*\n\n\nNuclear weapons were [radically more powerful](http://aiimpacts.wpengine.com/discontinuity-from-nuclear-weapons/ \"Discontinuity from Nuclear Weapons\") per pound than any previous bomb. Their appearance was [a massive discontinuity](http://aiimpacts.wpengine.com/cases-of-discontinuous-technological-progress/ \"Cases of Discontinuous Technological Progress\") in the long-run path of explosive progress, that we have [lately](http://aiimpacts.wpengine.com/the-biggest-technological-leaps/ \"The Biggest Technological Leaps\") [discussed](http://aiimpacts.wpengine.com/ai-and-the-big-nuclear-discontinuity/ \"AI and the Big Nuclear Discontinuity\").\n\n\nBut why do we measure energy per mass in particular? Energy per dollar may be a better measure of ‘progress’, if the goal was to explode things cheaply, rather than lightly. So we [looked into](http://aiimpacts.wpengine.com/discontinuity-from-nuclear-weapons/ \"Discontinuity from Nuclear Weapons\") this too. The first thing we found was that information about the costs of pre-WWII explosives is surprisingly sparse. However from what we can gather, nuclear weapons did not immediately improve the cost-effectiveness of explosives much at all.\n\n\nThe marginal cost of an early 200kt nuclear weapon was about $25M, which is quite similar to the $21M price of the equivalent amount of TNT. Early nuclear explosives did not deliver radically more bang-for-the-buck than their conventional counterparts (even setting aside the considerable upfront development costs); their immediate significance was their greater energy density.\n\n\nThis is not a precise comparison. For one thing, conventional bombs have costs beyond the explosive material, which were not included in the figures here. For another, conventional bombs contain explosives other than TNT (alternatives gave somewhat more explosive power per dollar). Nonetheless, the ballpark costs of the two explosives seem comparable.\n\n\nThis is interesting for a few reasons.\n\n\n**Continuity from continuously falling costs**\n\n\nIt tells us something about why and when technological progress is continuous. One possible explanation for continuous progress is that people do things when they first become reasonably cost-effective, at which point they are unlikely to be radically cost-effective. Imagine there are a range of possible projects, with different costs and payoffs. Every year, they all get a little cheaper. If a project is a great deal this year, then it would have been done last year, when it was already a good deal. So all of the available deals would be about as good as each other. On this model, new technologies might be suddenly very good, but only if the advance was also very expensive. Nothing would be suddenly very cost-effective.\n\n\nOn their face, nuclear weapons appear to support this theory. They made abrupt progress, but were incredibly expensive to develop and build. But this story doesn’t stand up to closer inspection. A few years before they were deployed, [not even](http://blog.nuclearsecrecy.com/2014/05/16/szilards-chain-reaction/) physicists generally thought them possible; no one considered and then rejected an investment in nuclear weapons. As soon as the possibility was seriously considered, it was considered to merit a significant fraction of GDP.\n\n\n**Continuity from incremental improvements**\n\n\nIt’s also plausible that progress is continuous on metrics that people care most about, because if they care they search hard for improvements, and there are in fact plenty of small improvements to find. Cost-effectiveness of explosives is a thing we care about, whereas we care less (though still quite a bit) about explosive power per weight. The nuclear case provides some support for this explanation.\n\n\n**Continuity in something**\n\n\nThere are many ways to measure progress. Finding measures that *don’t* change abruptly can help avoid surprises, by allowing us to forecast the trends that are most likely to advance predictably. The nuclear example may help shed light on what kinds of measures tend to be continuous.\n\n\n~\n\n\nThere are even more relevant metrics than this literal meaning of “bang for the buck.” Destruction per dollar might be closer, but harder to measure; the effect on P(winning the war) would be closer still, and the effect on national interests more broadly would be even better. It was hard enough to find cost-effectiveness of in terms of energy, so we won’t be investigating these any time soon.\n\n\nIn general, I would guess that progress becomes more continuous as we move closer to measures that people really care about. The reverse may be true, however, for nuclear weapons: the costs of deploying weapons might see more abrupt progress than the narrower measure we have considered. A nuclear weapon requires [one](http://en.wikipedia.org/wiki/Bockscar) plane, whereas a rain of small bombs requires many, and these planes and crews appear to be much more expensive than the bombs.\n\n\n\n\n---\n\n\n*This is a small part of an ongoing investigation into discontinuous technological change. More blog posts are [here](http://aiimpacts.wpengine.com/the-biggest-technological-leaps/ \"The Biggest Technological Leaps\") and [here](http://aiimpacts.wpengine.com/ai-and-the-big-nuclear-discontinuity/ \"AI and the Big Nuclear Discontinuity\"). The most relevant pages about this so far are [Cases of Discontinuous Technological Progress](http://aiimpacts.wpengine.com/cases-of-discontinuous-technological-progress/ \"Cases of Discontinuous Technological Progress\") and [Discontinuity from Nuclear Weapons](http://aiimpacts.wpengine.com/discontinuity-from-nuclear-weapons/ \"Discontinuity from Nuclear Weapons\").*\n\n\n*(Image: [EOD teams detonate expired ordnance in the Kuwaiti desert on July 12, 2002](http://commons.wikimedia.org/wiki/Explosion#mediaviewer/File:US_Navy_020712-N-5471P-010_EOD_teams_detonate_expired_ordnance_in_the_Kuwaiti_desert.jpg).)*\n\n", "url": "https://aiimpacts.org/were-nuclear-weapons-cost-effective-explosives/", "title": "Were nuclear weapons cost-effective explosives?", "source": "aiimpacts.org", "source_type": "wordpress", "date_published": "2015-01-12T01:30:06+00:00", "paged_url": "https://aiimpacts.org/feed?paged=24", "authors": ["Katja Grace"], "id": "721ba09fcc0ca9fa9bf12f87674e7ed1", "summary": []}
{"text": "A summary of AI surveys\n\n*By Katja Grace, 10 January 2015*\n\n\nIf you want to know when human-level AI will be developed, a natural approach is to ask someone who works on developing AI. You might however be put off by such predictions being regularly criticized as inaccurate and biased. While they do seem overwhelmingly likely to be inaccurate and biased, I claim they would have to be very inaccurate and biased before they were worth ignoring, especially in the absence of many other sources of quality information. The bar for ridicule is well before the bar for being uninformative.\n\n\nSo on that note, we made a big [summary](http://aiimpacts.wpengine.com/ai-timeline-surveys/ \"AI Timeline Surveys\") of all of the surveys we know of on timelines to human-level AI. And also a [bunch](http://aiimpacts.wpengine.com/ai50-survey/ \"AI@50 Survey\") [of](http://aiimpacts.wpengine.com/bainbridge-survey/ \"Bainbridge survey\") [summary](http://aiimpacts.wpengine.com/agi-09-survey/ \"AGI-09 Survey\") [pages](http://aiimpacts.wpengine.com/fhi-ai-timelines-survey/ \"FHI Winter Intelligence Survey\") [on](http://aiimpacts.wpengine.com/hanson-ai-expert-survey/ \"Hanson AI Expert Survey\") [specific](http://aiimpacts.wpengine.com/klein-agi-survey/ \"Klein AGI Survey\") [human-level](http://aiimpacts.wpengine.com/muller-and-bostrom-ai-progress-poll/ \"Müller and Bostrom AI Progress Poll\") [AI](http://aiimpacts.wpengine.com/michie-survey/ \"Michie Survey\") [surveys](http://aiimpacts.wpengine.com/kruel-ai-survey/ \"Kruel AI Interviews\"). We hope they are a useful reference, and also help avert selection bias selection bias from people only knowing about surveys that support their particular views on selection bias.\n\n\nIt’s interesting to note the consistency between the surveys that asked participants to place confidence intervals. They all predict there is a ten percent chance of human-level AI sometime in the 2020s, and almost all place a fifty percent chance of human-level AI between 2040 and 2050. They are even pretty consistent on the 90% date, with more than half in 2070-2080. This is probably mostly evidence that people talk to each other and hear about similar famous predictions. However it is some evidence of accuracy, since if each survey produced radically different estimates we must conclude that surveys are fairly inaccurate.\n\n\nIf you know of more surveys on human-level AI timelines, do [send them our way](http://aiimpacts.wpengine.com/feedback/ \"Feedback\").\n\n\nHere’s a summary of [our summary](http://aiimpacts.wpengine.com/ai-timeline-surveys/ \"AI Timeline Surveys\"):\n\n\n\n\n\n| Year | Survey | # | 10% | 50% | 90% | Other key ‘Predictions’ | Participants | Response rate | Link to original document |\n| 1972 | [Michie](http://aiimpacts.wpengine.com/michie-survey/ \"Michie Survey\") | 67 | | | | Median 50y (2022) (vs 20 or >50) | AI, CS | – | [link](https://saltworks.stanford.edu/assets/cf501kz5355.pdf) |\n| 2005 | [Bainbridge](http://aiimpacts.wpengine.com/bainbridge-survey/ \"Bainbridge survey\") | 26 | | | | Median 2085 | Tech | – | [link](http://www.wtec.org/ConvergingTechnologies/3/NBIC3_report.pdf) |\n| 2006 | [AI@50](http://aiimpacts.wpengine.com/ai50-survey/ \"AI@50 Survey\") | | | | | median >50y (2056) | AI conf | – | [link](http://web.archive.org/web/20110710193831/http://www.engagingexperience.com/ai50/) |\n| 2007 | [Klein](http://aiimpacts.wpengine.com/klein-agi-survey/ \"Klein AGI Survey\") | 888 | | | | median 2030-2050 | Futurism? | – | [link](http://web.archive.org/web/20110226225452/http://www.novamente.net/bruce/?p=54) and [link](http://sethbaum.com/ac/2011_AI-Experts.pdf) |\n| 2009 | [AGI-09](http://aiimpacts.wpengine.com/agi-09-survey/ \"AGI-09 Survey\") | | 2020 | 2040 | 2075 | | AGI conf; AI | – | [link](http://sethbaum.com/ac/2011_AI-Experts.pdf) |\n| 2011 | [FHI Winter Intelligence](http://aiimpacts.wpengine.com/fhi-ai-timelines-survey/ \"FHI Winter Intelligence Survey\") | 35 | 2028 | 2050 | 2150 | | AGI impacts conf; 44% related technical | 41% | [link](http://www.fhi.ox.ac.uk/machine-intelligence-survey-2011.pdf) |\n| 2011-2012 | [Kruel interviews](http://aiimpacts.wpengine.com/kruel-ai-survey/ \"Kruel AI Interviews\") | 37 | 2025 | 2035 | 2070 | | AGI, AI | – | [link](http://wiki.lesswrong.com/wiki/Interview_series_on_risks_from_AI) |\n| 2012 | [FHI: AGI](http://aiimpacts.wpengine.com/muller-and-bostrom-ai-progress-poll/ \"Müller and Bostrom AI Progress Poll\") | 72 | 2022 | 2040 | 2065 | | AGI & AGI impacts conf; AGI, technical work | 65% | [link](http://www.nickbostrom.com/papers/survey.pdf) |\n| 2012 | [FHI:PT-AI](http://aiimpacts.wpengine.com/muller-and-bostrom-ai-progress-poll/ \"Müller and Bostrom AI Progress Poll\") | 43 | 2023 | 2048 | 2080 | | Philosophy & theory of AI conf; not technical AI | 49% | [link](http://www.nickbostrom.com/papers/survey.pdf) |\n| 2012-present | [Hanson](http://aiimpacts.wpengine.com/hanson-ai-expert-survey/ \"Hanson AI Expert Survey\") | ~10 | | | | ≤ 10% progress to human level in past 20y | AI | – | [link](http://www.overcomingbias.com/2012/08/ai-progress-estimate.html) |\n| 2013 | [FHI: TOP100](http://aiimpacts.wpengine.com/muller-and-bostrom-ai-progress-poll/ \"Müller and Bostrom AI Progress Poll\") | 29 | 2022 | 2040 | 2075 | | Top AI | 29% | [link](http://www.nickbostrom.com/papers/survey.pdf) |\n| 2013 | [FHI:EETN](http://aiimpacts.wpengine.com/muller-and-bostrom-ai-progress-poll/ \"Müller and Bostrom AI Progress Poll\") | 26 | 2020 | 2050 | 2093 | | Greek assoc. for AI; AI | 10% | [link](http://www.nickbostrom.com/papers/survey.pdf) |\n\n\n \n\n\n*(Image: AGI-09 participants, by [jeriaska](https://www.flickr.com/photos/jeriaska/3337664307/in/set-72157614814369315/))*\n\n", "url": "https://aiimpacts.org/a-summary-of-ai-surveys/", "title": "A summary of AI surveys", "source": "aiimpacts.org", "source_type": "wordpress", "date_published": "2015-01-10T23:19:17+00:00", "paged_url": "https://aiimpacts.org/feed?paged=24", "authors": ["Katja Grace"], "id": "a9cfaa3d8d873c76069a6efa73b3ffe6", "summary": []}
{"text": "AI Timeline Surveys\n\n***This page is out-of-date. Visit the [updated version of this page](https://wiki.aiimpacts.org/doku.php?id=ai_timelines:predictions_of_human-level_ai_timelines:ai_timeline_surveys:ai_timeline_surveys) on our [wiki](https://wiki.aiimpacts.org/doku.php?id=start).***\n\n\n*Published 10 January 2015*\n\n\nWe know of twelve surveys on the predicted timing of human-level AI. If we collapse a few slightly different meanings of ‘human-level AI’, then:\n\n\n* Median estimates for when there will be a 10% chance of human-level AI are all in the 2020s (from seven surveys), except for the [2016 ESPAI](https://aiimpacts.org/2016-expert-survey-on-progress-in-ai/), which found median estimates ranging from 2013 to long after 2066, depending on question framing.\n* Median estimates for when there will be a 50% chance of human-level AI range between 2035 and 2050 (from seven surveys), except for the [2016 ESPAI](https://aiimpacts.org/2016-expert-survey-on-progress-in-ai/), which found median estimates ranging from 2056 to at least 2106, depending on question framing.\n* Of three surveys in recent decades asking for predictions but not probabilities, two produced median estimates of when human-level AI will arrive in the 2050s, and one in 2085.\n\n\nParticipants appear to mostly be experts in AI or related areas, but with a large contingent of others. Several groups of survey participants seem likely over-represent people who are especially optimistic about human-level AI being achieved soon.\n\n\nDetails\n-------\n\n\n### List of surveys\n\n\nThese are the surveys that we know of on timelines to human-level AI:\n\n\n* [Michie](http://aiimpacts.wpengine.com/michie-survey/ \"Michie Survey\") (1972)\n* [Bainbridge](http://aiimpacts.wpengine.com/bainbridge-survey/ \"Bainbridge survey\") (2005)\n* [AI@50](http://aiimpacts.wpengine.com/ai50-survey/ \"AI@50 Survey\") (2006)\n* [Klein](http://aiimpacts.wpengine.com/klein-agi-survey/ \"Klein AGI Survey\") (2007)\n* [AGI-09](http://aiimpacts.wpengine.com/agi-09-survey/ \"AGI-09 Survey\") (2009)\n* [FHI Winter Intelligence](http://aiimpacts.wpengine.com/fhi-ai-timelines-survey/ \"FHI Winter Intelligence Survey\") (2011)\n* [Kruel](http://aiimpacts.wpengine.com/kruel-ai-survey/ \"Kruel AI Interviews\") (2011-12)\n* [Hanson](http://aiimpacts.wpengine.com/hanson-ai-expert-survey/ \"Hanson AI Expert Survey\") (2012 onwards)\n* [Müller and Bostrom](http://aiimpacts.wpengine.com/muller-and-bostrom-ai-progress-poll/ \"Müller and Bostrom AI Progress Poll\"): AGI-12, TOP100, EETN, PTAI (2012-2013)\n\n\n### Results\n\n\n#### Results summary\n\n\n \n\n\n\n\n | Year | Survey | # | 10% | 50% | 90% | Other key ‘Predictions’ | Participants | Response rate | Link to original document |\n| 1972 | [Michie](http://aiimpacts.wpengine.com/michie-survey/ \"Michie Survey\") | 67 | | | | Median 50y (2022) (vs 20 or >50) | AI, CS | – | [link](https://saltworks.stanford.edu/assets/cf501kz5355.pdf) |\n| 2005 | [Bainbridge](http://aiimpacts.wpengine.com/bainbridge-survey/ \"Bainbridge survey\") | 26 | | | | Median 2085 | Tech | – | [link](http://www.wtec.org/ConvergingTechnologies/3/NBIC3_report.pdf) |\n| 2006 | [AI@50](http://aiimpacts.wpengine.com/ai50-survey/ \"AI@50 Survey\") | | | | | median >50y (2056) | AI conf | – | [link](http://web.archive.org/web/20110710193831/http://www.engagingexperience.com/ai50/) |\n| 2007 | [Klein](http://aiimpacts.wpengine.com/klein-agi-survey/ \"Klein AGI Survey\") | 888 | | | | median 2030-2050 | Futurism? | – | [link](http://web.archive.org/web/20110226225452/http://www.novamente.net/bruce/?p=54) and [link](http://sethbaum.com/ac/2011_AI-Experts.pdf) |\n| 2009 | [AGI-09](http://aiimpacts.wpengine.com/agi-09-survey/ \"AGI-09 Survey\") | 21 | 2020 | 2040 | 2075 | | AGI conf; AI | – | [link](http://sethbaum.com/ac/2011_AI-Experts.pdf) |\n| 2011 | [FHI Winter Intelligence](http://aiimpacts.wpengine.com/fhi-ai-timelines-survey/ \"FHI Winter Intelligence Survey\") | 35 | 2028 | 2050 | 2150 | | AGI impacts conf; 44% related technical | 41% | [link](https://www.fhi.ox.ac.uk/wp-content/uploads/2011-1.pdf) |\n| 2011-2012 | [Kruel interviews](http://aiimpacts.wpengine.com/kruel-ai-survey/ \"Kruel AI Interviews\") | 37 | 2025 | 2035 | 2070 | | AGI, AI | – | [link](http://wiki.lesswrong.com/wiki/Interview_series_on_risks_from_AI) |\n| 2012 | [FHI: AGI-12](http://aiimpacts.wpengine.com/muller-and-bostrom-ai-progress-poll/ \"Müller and Bostrom AI Progress Poll\") | 72 | 2022 | 2040 | 2065 | | AGI & AGI impacts conf; AGI, technical work | 65% | [link](http://www.nickbostrom.com/papers/survey.pdf) |\n| 2012 | [FHI:PT-AI](http://aiimpacts.wpengine.com/muller-and-bostrom-ai-progress-poll/ \"Müller and Bostrom AI Progress Poll\") | 43 | 2023 | 2048 | 2080 | | Philosophy & theory of AI conf; not technical AI | 49% | [link](http://www.nickbostrom.com/papers/survey.pdf) |\n| 2012-? | [Hanson](http://aiimpacts.wpengine.com/hanson-ai-expert-survey/ \"Hanson AI Expert Survey\") | ~10 | | | | ≤ 10% progress to human level in past 20y | AI | – | [link](http://www.overcomingbias.com/2012/08/ai-progress-estimate.html) |\n| 2013 | [FHI: TOP100](http://aiimpacts.wpengine.com/muller-and-bostrom-ai-progress-poll/ \"Müller and Bostrom AI Progress Poll\") | 29 | 2022 | 2040 | 2075 | | Top AI | 29% | [link](http://www.nickbostrom.com/papers/survey.pdf) |\n| 2013 | [FHI:EETN](http://aiimpacts.wpengine.com/muller-and-bostrom-ai-progress-poll/ \"Müller and Bostrom AI Progress Poll\") | 26 | 2020 | 2050 | 2093 | | Greek assoc. for AI; AI | 10% | [link](http://www.nickbostrom.com/papers/survey.pdf) |\n\n\n#### Time to a 10% chance and a 50% chance of human-level AI\n\n\nThe FHI Winter Intelligence, Müller and Bostrom, AGI-09, Kruel, and 2016 ESPAI surveys asked for years when participants expected 10%, 50% and 90% probabilities of human-level AI (or a similar concept). All of these surveys were taken between 2009 and 2012, except the 2016 ESPAI.\n\n\nSurvey participants’ median estimates for when there will be a 10% chance of human-level AI are all in the 2020s or 2030s. Until the 2016 ESPAI survey, median estimates for when there will be a 50% chance of human-level AI ranged between 2035 and 2050. The 2016 ESPAI asked about human-level AI using both very similar questions to previous surveys, and a different style of question based on automation of specific human occupations. The former questions found median dates of at least 2056, and the latter question prompted median dates of at least 2106.\n\n\n#### Non-probabilistic predictions\n\n\nThree surveys (Bainbridge, Klein, and AI@50) asked about predictions, rather than confidence levels. These produced median predictions of >2056 ([AI@50](http://aiimpacts.wpengine.com/ai50-survey/ \"AI@50 Survey\")), 2030-50 ([Klein](http://aiimpacts.wpengine.com/klein-agi-survey/ \"Klein AGI Survey\")), and 2085 ([Bainbridge](http://aiimpacts.wpengine.com/bainbridge-survey/ \"Bainbridge survey\")). It is unclear how participants interpret the request to estimate when a thing will happen; these responses may mean the same as the 50% confidence estimate discussed above. These surveys together appear to contain a high density of people who don’t work in AI, compared to the other surveys.\n\n\n#### Michie survey\n\n\n[Michie’s survey](http://aiimpacts.wpengine.com/michie-survey/ \"Michie Survey\") is unusual in being much earlier than the others (1972). In it, less than a third of participants expected human-level AI by 1992, another almost third estimated 2022, and the rest expected it later. Note that the participants’ median expectation (50 years away) was further from their present time than those of contemporary survey participants. This point conflicts with a common perception that early AI predictions were shockingly optimistic, and quickly undermined.\n\n\n#### Hanson survey\n\n\n[Hanson’s survey](http://aiimpacts.wpengine.com/hanson-ai-expert-survey/ \"Hanson AI Expert Survey\") is unusual in its methodology. Hanson informally asked some AI experts what fraction of the way to human-level capabilities we had come in 20 years, in their subfield. He also asked about apparent acceleration. Around half of answers were in the 5-10% range, and all except one which hadn’t passed human-level already were less than 10%. Of six who reported on acceleration, only one saw positive acceleration.\n\n\nThese estimates suggest human-level capabilities in most fields will take more than 200 years, if progress proceeds as it has (i.e. if we progress at 10% per twenty years, it will take 200 years to get to 100%). This estimate is quite different from those obtained from most of the other surveys.\n\n\nThe 2016 ESPAI attempted to [replicate this methodology](https://aiimpacts.org/2016-expert-survey-on-progress-in-ai/#Outside_view_implied_HLMI_forecasts), and did not appear to find similarly long implied timelines, however little attention has been paid to analyzing that data.\n\n\nThis methodology is discussed more in the methods section below.\n\n\n### Methods\n\n\n#### Survey participants\n\n\nIn assessing the quality of predictions, we are interested in the expertise of the participants, the potential for biases in selecting them, and the degree to which a group of well-selected experts generally tend to make good predictions. We will leave the third issue to be addressed elsewhere, and here describe the participants’ expertise and the surveys’ biases. We will see that the participants have much expertise relevant to AI, but – relatedly – their views are probably biased toward optimism because of selection effects as well as normal human optimism about projects.\n\n\n###### Summary of participant backgrounds\n\n\nThe FHI (2011), AGI-09, and one of the four FHI collection surveys are from AGI (artificial general intelligence) conferences, so will tend to include a lot of people who work directly on trying to create human-level intelligence, and others who are enthusiastic or concerned about that project. At least two of the aforementioned surveys draw some participants from the ‘impacts’ section of the AGI conference, which is likely to select for people who think the effects of human-level intelligence are worth thinking about now.\n\n\nKruel’s participants are not from the AGI conferences, but around half work in AGI. Klein’s participants are not known, except they are acquaintances of a [person](http://web.archive.org/web/20091208081401/http://www.novamente.net/bruce/?page_id=2) who is enthusiastic about AGI (his site is called ‘AGI-world’). Thus many participants either do AGI research, or think about the topic a lot.\n\n\nMany more participants are AI researchers from outside AGI. Hanson’s participants are experts in narrow AI fields. Michie’s participants are computer scientists working close to AI. Müller and Bostrom’s surveys of the top 100 artificial intelligence researchers, and Members of the Greek Association for Artificial Intelligence, would be almost entirely AI researchers, and there is little reason to expect them to be in AGI. AI@50 seems to include a variety of academics interested in AI rather than those in the narrow field of AGI, though also [includes](http://www.aaai.org/ojs/index.php/aimagazine/article/view/1911/1809) others, such as several dozen graduate and post-doctoral students. [2016 ESPAI](http://aiimpacts.org/2016-expert-survey-on-progress-in-ai/) is everyone publishing in two top machine learning conferences, so largely machine learning researchers.\n\n\nThe remaining participants appear to be mostly highly educated people from academia and other intellectual areas. The attendees at the 2011 Conference on Philosophy and Theory of AI appear to be a mixture of philosophers, AI researchers, and academics from related fields such as brain sciences. Bainbridge’s participants are contributors to ‘converging technology’ reports, on topics of nanotechnology, biotechnology, information technology, and cognitive science. From looking at [what appears to be one of these reports](http://www.wtec.org/ConvergingTechnologies/Report/NBIC_report.pdf), these seem to be mostly experts from government and national laboratories, academia, and the private sector. Few work in AI in particular. An arbitrary sample includes the Director of the Division of Behavioral and Cognitive Sciences at NSF, a person from the Defense Threat Reduction Agency, and a person from HP laboratories.\n\n\n###### AGI researchers\n\n\nAs noted above, many survey participants work in AGI – the project to create general intelligent agents, as opposed to narrow AI applications. In general, we might expect people working on a given project to be unusually optimistic about its success, for two reasons. First, those who are most optimistic initially will more likely find the project worth investing in. Secondly, people are [generally observed](http://en.wikipedia.org/wiki/Planning_fallacy) to be especially optimistic about the time needed for their own projects to succeed. So we might expect AGI researchers to be biased toward optimism, for these reasons.\n\n\nOn the other hand, AGI researchers are working on projects most closely related to human-level AI, so probably have the most relevant expertise.\n\n\n###### Other AI researchers\n\n\nJust as AGI researchers work on topics closer to human-level AI than other AI researchers – and so may be more biased but also more knowledgeable – AI researchers work on more relevant topics than everyone else. Similarly, we might expect them to both be more accurate due to their additional expertise, but more biased due to selection effects and optimism about personal projects.\n\n\nHanson’s participants are experts in narrow AI fields, but are also reporting on progress in their own fields of narrow AI (rather than on general intelligence), so we might expect them to be more like the AGI researchers – especially expert and especially biased. On the other hand, Hanson asks about past progress rather than future expectations, which should diminish both the selection effect and the effect from the planning fallacy, so we might expect the bias to be weaker.\n\n\n**Definitions of human-level AI**\n\n\nA few different definitions of human-level AI are combined in this analysis.\n\n\nThe AGI-09 survey asked about four benchmarks; the one reported here is the Turing-test capable AI. [Note](http://aiimpacts.wpengine.com/agi-09-survey/ \"AGI-09 Survey\") that ‘Turing test capable’ seems to sometimes be interpreted as merely capable of holding a normal human discussion. It isn’t clear that the participants had the same definition in mind.\n\n\nKruel only asked that the AI be as good as humans at science, mathematics, engineering and programming, and asks conditional on favorable conditions continuing (e.g. no global catastrophes). This might be expected prior to fully human-level AI.\n\n\nEven where people talk about ‘human-level’ AI, they can mean a variety of different things. For instance, it is not clear whether a machine must operate at human cost to be ‘human-level’, or to what extent it must resemble a human.\n\n\nAt least three surveys use the acronym ‘HLMI’, but it can stand for either ‘human-level machine intelligence’ or ‘high level machine intelligence’ and is defined differently in different surveys.\n\n\nHere is a full list of exact descriptions of something like ‘human-level’ used in the surveys:\n\n\n* **Michie:** ‘computing system exhibiting intelligence at adult human level’\n* **Bainbridge:** ‘The computing power and scientific knowledge will exist to build \nmachines that are functionally equivalent to the human brain’\n* **Klein:** ‘When will AI surpass human-level intelligence?’\n* **AI@50:** ‘When will computers be able to simulate every aspect of human intelligence?’\n* **FHI 2011:** ‘Assuming no global catastrophe halts progress, by what year would you assign a 10%/50%/90% chance of the development of human-level machine intelligence? Feel free to answer ‘never’ if you believe such a milestone will never be reached.’\n* **Müller and Bostrom: ‘**[machine intelligence] that can carry out most human professions at least as well as a typical human’\n* **Hanson:** ‘human level abilities’ in a subfield (wording is probably not consistent, given the long term and informal nature of the poll)\n* **AGI-09:** ‘Passing the Turing test’\n* **Kruel:** Variants on, ‘Assuming beneficial political and economic development and that no global catastrophe halts progress, by what year would you assign a 10%/50%/90% chance of the development of artificial intelligence that is roughly as good as humans (or better, perhaps unevenly) at science, mathematics, engineering and programming?’\n* **2016 ESPAI**(our emboldening)**:**\n\t+ Say we have ‘**high level machine intelligence**’ when unaided machines can accomplish every task better and more cheaply than human workers. Ignore aspects of tasks for which being a human is intrinsically advantageous, e.g. being accepted as a jury member. *Think feasibility, not adoption.*\n\t+ Say an occupation becomes **fully automatable** when unaided machines can accomplish it better and more cheaply than human workers. Ignore aspects of occupations for which being a human is intrinsically advantageous, e.g. being accepted as a jury member. *Think feasibility, not adoption.*\n\t+ Say we have reached ‘**full automation of labor**’ “when all occupations are fully automatable. That is, when for any occupation, machines could be built to carry out the task better and more cheaply than human workers.”\n\n\n#### Inside vs. outside view methods\n\n\nHanson’s survey was unusual in that it asked participants for their impressions of past rates of progress, from which extrapolation could be made (an ‘[outside view](http://en.wikipedia.org/wiki/Reference_class_forecasting)’ estimate), rather than asking directly about expected future rates of progress (an ‘inside view’ estimate). It also produced much later median dates for human-level AI, suggesting that this outside view methodology in general produces much later estimates (rather than for instance, Hanson’s low sample size and casual format just producing a noisy or biased estimate that happened to be late).\n\n\nIf so, this would be important because outside view estimates in general are often informative.\n\n\nHowever the 2016 ESPAI included a set of questions similar to Hanson’s, and did not at a glance find similarly long implied timelines, though the data has not been carefully analyzed. This is some evidence against the outside view style methodology systematically producing longer timelines, though arguably not enough to overturn the hypothesis.\n\n\nWe might expect Hanson’s outside view method to be especially useful in AI forecasting because a key merit is that asking people about the past means asking questions more closely related to their expertise, and the future of AI is arguably especially far from anyone’s expertise (relative to say asking a dam designer how long it will take for their dam to be constructed) . On the other hand, AI researchers’ expertise may include a lot of information about AI other than how far we have come, and translating what they have seen into what fraction of the way we have come may be difficult and thus introduce additional error.\n\n\n", "url": "https://aiimpacts.org/ai-timeline-surveys/", "title": "AI Timeline Surveys", "source": "aiimpacts.org", "source_type": "wordpress", "date_published": "2015-01-10T09:37:48+00:00", "paged_url": "https://aiimpacts.org/feed?paged=24", "authors": ["Katja Grace"], "id": "ea8bda76ce7435cc02f2d97b7085a012", "summary": []}
{"text": "Michie Survey\n\nIn a 1972 poll of sixty-seven AI and computer science experts, respondents were roughly divided between expecting human-level intelligence in 20 years, in 50 years and in more than 50 years. They were also roughly divided between considering a ‘takeover’ by AI a negligible and a substantial risk – with ‘overwhelming risk’ far less popular.\n\n\nDetails\n-------\n\n\n### Methods\n\n\n[Donald Michie](http://en.wikipedia.org/wiki/Donald_Michie) reported on the poll in Machines and the Theory of Intelligence [(pdf download)](https://saltworks.stanford.edu/assets/cf501kz5355.pdf). The participants were sixty-seven British and American computer scientists working in or close to machine intelligence. The paper does not say much more about the methodology used. It is unclear whether Michie ran the poll.\n\n\n### Findings\n\n\nMichie presents Figure 4 below, and [Firschein and Coles](http://ijcai.org/Past%20Proceedings/IJCAI-73/PDF/013.pdf) present the table in Figure 2, which appears to be the same data. Michie’s interesting findings include:\n\n\n* ‘Most considered that attainment of the goals of machine intelligence would cause human intellectual and cultural processes to be enhanced rather than to atrophy.’\n* ‘Of those replying to a question on the risk of ultimate ‘takeover’ of human affairs by intelligent machines, about half regarded it as ‘negligible’, and most of the remainder as ‘substantial’ with a few voting for ‘overwhelming’.’\n* Almost all participants predicted human level computing systems would not emerge for over twenty years. They were roughly divided between 20, 50, and more. See figure 4 below (from p512).\n\n\n[](https://sites.google.com/site/aiimpactslibrary/ai-timelines/predictions-of-human-level-ai-dates/ai-expert-surveys/michie-survey/michietimelines%20copy.jpg?attredirects=0)\n\n\n[](http://aiimpacts.wpengine.com/wp-content/uploads/2015/01/michie-table-copy.jpg)Figure 2: Firschein and Coles 1973 present this table, which appears to report on the same survey.\n\n\n \n\n\n \n\n", "url": "https://aiimpacts.org/michie-survey/", "title": "Michie Survey", "source": "aiimpacts.org", "source_type": "wordpress", "date_published": "2015-01-10T01:58:11+00:00", "paged_url": "https://aiimpacts.org/feed?paged=24", "authors": ["Katja Grace"], "id": "4ef081e61e22eea5a897da2b96ff2844", "summary": []}
{"text": "AI and the Big Nuclear Discontinuity\n\n*By Katja Grace, 9 January 2015*\n\n\n[As we’ve discussed before](http://aiimpacts.wpengine.com/the-biggest-technological-leaps/ \"The Biggest Technological Leaps\"), the advent of nuclear weapons was a [striking](http://aiimpacts.wpengine.com/discontinuity-from-nuclear-weapons/ \"Discontinuity from Nuclear Weapons\") technological [discontinuity](http://aiimpacts.wpengine.com/cases-of-discontinuous-technological-progress/ \"Cases of Discontinuous Technological Progress\") in the effectiveness of explosives. In 1940, no one had ever made an explosive twice as effective as TNT. By 1945 the best explosive [was 4500 times more potent](http://aiimpacts.wpengine.com/discontinuity-from-nuclear-weapons/ \"Discontinuity from Nuclear Weapons\"), and by 1960 the ratio was 5 million.\n\n\nProgress in nuclear weapons is sometimes offered as an analogy for possible rapid progress in AI (e.g. by Eliezer Yudkowsky [here](https://intelligence.org/files/AIPosNegFactor.pdf), and [here](http://intelligence.org/files/IEM.pdf)). It’s worth clarifying the details of this analogy, which has nothing to do with the discontinuous progress in weapon effectiveness. It’s about a completely different discontinuity: a single nuclear pile’s quick transition from essentially inert to extremely reactive.\n\n\nAs you add more fissile material to a nuclear pile, little happens until it reaches a critical mass. After reaching critical mass, the chain reaction proceeds much faster than the human actions that assembled it. By analogy, perhaps as you add intelligence to a pile of intelligence, little will happen until it reaches a critical level which initiates a chain reaction of improvements (‘[recursive self-improvement](http://en.wikipedia.org/wiki/Recursive_self-improvement)’) which proceeds much faster than the human actions that assembled it.\n\n\nThis discontinuity in individual nuclear explosions is not straightforwardly related to the technological discontinuity caused by their introduction. Older explosives were also based on chain reactions. The big jump seems to be a move from chemical chain reactions to nuclear chain reactions, two naturally occurring sources of energy with very different characteristic scales–and with no alternatives in between them. This jump has no obvious analog in AI.\n\n\nOne might wonder if the technological discontinuity was nevertheless connected to the discontinuous dynamics of individual nuclear piles. Perhaps the density and volume of fissile uranium required for any explosive was the reason that we did not see small, feeble nuclear weapons in between chemical weapons and powerful nuclear weapons. This doesn’t match the history however. Nobody knew that concentrating fissile uranium was important until after fission was discovered in [1938](http://en.wikipedia.org/wiki/Nuclear_fission), less than seven years before the [first](http://en.wikipedia.org/wiki/Trinity_%28nuclear_test%29) nuclear detonation. Even if nuclear weapons had grown in strength gradually over this period, this would still be [around](http://aiimpacts.wpengine.com/discontinuity-from-nuclear-weapons/ \"Discontinuity from Nuclear Weapons\") one thousand years of progress at the historical rate per year. The dynamics of individual piles can only explain a miniscule part of the discontinuity.\n\n\nThere may be an important analogy between AI progress and nuclear weapons. And the development of nuclear weapons was in some sense a staggeringly abrupt technological development. But we probably shouldn’t conclude that the development of AI is much more likely to be comparably abrupt.\n\n\n If you vaguely remember that AI progress and nuclear weapons are analogous, and that nuclear weapons were a staggeringly abrupt development in explosive technology, try not to infer from this that AI is especially likely to be a staggeringly abrupt development.\n\n\n*(Image: [Trinity test after ten seconds](http://commons.wikimedia.org/wiki/File:Trinity_blast_10sec.jpg), taken from [Atomic Bomb Test Site Photographs](http://www.gutenberg.org/files/277/old/3trnt10.zip), courtesy of U.S. Army White Sands Missile Range Public Affairs Office)*\n\n", "url": "https://aiimpacts.org/ai-and-the-big-nuclear-discontinuity/", "title": "AI and the Big Nuclear Discontinuity", "source": "aiimpacts.org", "source_type": "wordpress", "date_published": "2015-01-09T22:06:46+00:00", "paged_url": "https://aiimpacts.org/feed?paged=24", "authors": ["Katja Grace"], "id": "ba91149977d277af20c4297acf77f747", "summary": []}
{"text": "The Biggest Technological Leaps\n\n*By Katja Grace, 9 January 2015*\n\n\nOver thousands of years, humans became better at producing explosions. A weight of explosive that would have blown up a tree stump in the year 800 [could have](http://en.wikipedia.org/wiki/Relative_effectiveness_factor) blown up more than three tree stumps [in the 1930s](http://en.wikipedia.org/wiki/HMX). Then suddenly, a decade later, the figure became more like nine thousand tree stumps. [The first nuclear weapons represented a massive leap](http://aiimpacts.wpengine.com/discontinuity-from-nuclear-weapons/ \"Discontinuity from Nuclear Weapons\") – something like 6000 years of progress in one step\\*.\n\n\nThough such jumps have been historical exceptions, some [some observers](http://lesswrong.com/lw/l4e/superintelligence_6_intelligence_explosion/) think a massive jump in AI capability is likely. Progress may be fast due to the apparent amenability of software to groundbreaking insights, the possibility of rapid applications (to deploy a new algorithm, you don’t have to build any factories), the plausibility of simple conceptual ingredients underlying intelligent behavior, [and the potential](https://intelligence.org/files/AIPosNegFactor.pdf) for [‘recursive self-improvement’](http://en.wikipedia.org/wiki/Recursive_self-improvement) to speed software development to rates characteristic of superhumanly-programmed computers rather than that of humans.\n\n\nWe think the question, *‘will AI progress be discontinuous?’* is a good one to investigate. Not just because advance notice of abrupt world-changing developments is sure to come in handy somehow–nor because of the exciting degree of disagreement it elicits. What makes this [a particularly good topic](http://www.effective-altruism.com/ea/6g/the_timing_of_labour_aimed_at_reducing/) to study *now* is that it it helps us know what other information is most relevant to understanding AI progress.\n\n\nOne might hope to make predictions about how soon AI will reach human-level by extrapolating from [how fast we are moving](http://aiimpacts.wpengine.com/hanson-ai-expert-survey/ \"Hanson AI Expert Survey\") and how far we have to go, for instance.\\*\\* Or we could monitor the rate at which automation replaces workers, or at which the performance of AI systems improves. These all provide valuable information if you think AI will be reached gradually, by the continuation of existing processes. However if you expect progress to be abrupt and uneven, these indicators are much less informative.\n\n\nSo whether AI will be reached abruptly or incrementally is an important question. But is it a tractable one to make progress on? My guess is yes. Plenty of evidence bears on this question: the historical patterns of progress in other technologies, instances of abnormally uneven progress, arguments suggesting abnormal degrees of abnormality in the AI case, theories explaining past continuity and discontinuities, cases that look relevantly analogous to AI…\n\n\nWe know some examples of very fast technological progress; simply understanding those cases better is likely to be an informative start.\n\n\nSo we’ve have started a list of cases [here.](http://aiimpacts.wpengine.com/cases-of-discontinuous-technological-progress/ \"Cases of Discontinuous Technological Progress\") Each case appears to involve abrupt technological progress. We looked into each one a little, usually just enough to check it really involved abrupt progress and to get approximate rates of progress before and during the discontinuity. We intend to do a more thorough job later for the cases seem particularly important or interesting.\n\n\nThis list will hopefully help us understand what fast progress looks like historically (How fast is it? How far is it? How unexpected is it?), and when it happens (Does it usually flow from a huge intellectual insight? The discovery of a new natural phenomenon? Overcoming a large upfront investment?).\n\n\nSo far, we have a couple of really big jumps, a couple of smaller jumps, a bunch of potentially interesting but uncertain cases, and a rich assortment of purported discontinuities that we are yet to investigate.\n\n\nAfter nuclear weapons, the second most interesting case we’ve found is high temperature superconductivity. The maximum temperature of superconduction appears to have made something like 150 years of progress in one jump in 1986, after the discovery of a new class of materials with maximum temperatures for superconducting behavior above what was thought possible.\n\n\nDo you have thoughts on this line of research? Do you have ideas for how to investigate cases? Do you know of historical cases of abrupt technological progress? Do you want to see [our list](http://aiimpacts.wpengine.com/cases-of-discontinuous-technological-progress/ \"Cases of Discontinuous Technological Progress\")?\n\n\n\n\n---\n\n\n\\* Measured in doublings; you would get a much more extreme estimate if you expected linear progress. Relative effectiveness (RE) had doubled less than twice in 1100 years, then it doubled more than eleven times when the first nuclear weapons emerged. (For more on nuclear weapons, see [our page on them](http://aiimpacts.wpengine.com/discontinuity-from-nuclear-weapons/ \"Discontinuity from Nuclear Weapons\")).\n\n\n\\*\\* Interestingly, asking AI researchers about rates of progress gives much more pessimistic estimates than asking them about when human-level AI will arrive, based on [some](http://aiimpacts.wpengine.com/hanson-ai-expert-survey/ \"Hanson AI Expert Survey\") very preliminary research. This may mean that AI researchers expect human-level AI to arrive following abnormally fast progress, though the discrepancy could be explained in many other ways. It seems worth of [looking in to](https://docs.google.com/document/d/1-eqYP1LumqZohBTGrujyPwj9q9WUx2c2leawzbaXrV0/edit).\n\n\n*(Image: The [first nuclear chain reaction](http://commons.wikimedia.org/wiki/File:First_nuclear_chain_reaction.jpg). Painting by Gary Sheehan (Atomic Energy Commission).*\n\n", "url": "https://aiimpacts.org/the-biggest-technological-leaps/", "title": "The Biggest Technological Leaps", "source": "aiimpacts.org", "source_type": "wordpress", "date_published": "2015-01-09T21:59:04+00:00", "paged_url": "https://aiimpacts.org/feed?paged=24", "authors": ["Katja Grace"], "id": "73f8767c1775566f9ffd2e1a140efeda", "summary": []}
{"text": "The AI Impacts Blog\n\n*By Katja Grace, 9 January 2015*\n\n\nWelcome to the AI Impacts blog. \n\n\nAI Impacts is premised on two ideas (at least!):\n\n\n* **The details of the arrival of human-level artificial intelligence matter** \n[Seven years to prepare](http://aiimpacts.wpengine.com/muller-and-bostrom-ai-progress-poll/) is very different from [seventy years](http://aiimpacts.wpengine.com/bainbridge-survey/) to prepare. A weeklong transition is very different from a decade-long transition. Brain emulations require different preparations than do synthetic AI minds. Etc.\n* **Available data and reasoning can substantially educate our guesses about these details**We can track progress in AI subfields. We can estimate the hardware represented by the human brain. We can detect the effect of additional labor on software progress. Etc.\n\n\nOur goal is to assemble relevant evidence and considerations, and to synthesize reasonable views on questions such as when AI will surpass human-level capabilities, how rapid development will be at that point, what advance notice we might expect, and what kinds of AI are likely to reach human-level capabilities first.\n\n\nWe are doing this recursively, first addressing much smaller questions, like:\n\n\n* Is AI likely to surpass human level in a discontinuous spurt, or through incremental progress?\n* Does AI software undergo discontinuous progress often?\n* [Is technological progress of any sort discontinuous often?](http://aiimpacts.wpengine.com/cases-of-discontinuous-technological-progress/)\n* When is technological progress discontinuous?\n* [Why did explosives undergo discontinuous progress in the form of nuclear weapons?](http://aiimpacts.wpengine.com/discontinuity-from-nuclear-weapons/)\n\n\nIn this way, we hope to inform decisions about how to prepare for advanced AI, and about whether it is worth prioritizing over other pressing issues in the world. Researchers, funders, and other thinkers and doers are choosing how to spend their efforts on the future impacts of AI, and we want to help them choose well.\n\n\nAI impacts is currently something like a (brief) encyclopedia of semi-original AI forecasting research. That is, it is a growing collection of pages addressing particular questions or bodies of evidence relating to the future of AI. We intend to revise these in an ongoing fashion, according to new investigations and debates. \n\n\nAt the same time as producing reasonable views, we are interested in exploring and bettering humanity’s machinery for producing reasonable views. To this end, we have chosen this unusual – but we think promising – format, and may experiment with novel methods of organizing information and resolving questions and disagreements. \n\n\nIf you want to know more about the project overall, see [About](http://aiimpacts.wpengine.com/about/), or peruse our [research pages](http://aiimpacts.org/articles/ \"Articles\") and see it firsthand. \n\n\n[This blog](http://aiimpacts.wpengine.com/blog/) exists to show you the most interesting findings of the AI Impacts project as we find them, and before they get lost in what we hope becomes a dense network of research pages. We might also write about other things, such as our thoughts on methodology, speculative opinions, news about the project itself, and anything else that seems like a good idea at the time.\n\n\nIf you like the sound of any of these things, consider signing up for one of our RSS feeds ([blog](http://aiimpacts.wpengine.com/category/blog/feed/), [articles](http://aiimpacts.wpengine.com/feed/)). If you don’t, or if you think you could (cheaply) like it more, we [welcome](http://aiimpacts.wpengine.com/feedback/) your thoughts or suggestions.\n\n\n[](http://aiimpacts.wpengine.com/wp-content/uploads/2015/01/Photo-on-1-10-14-at-5.55-PM.jpg)AI Impacts is currently authored by Paul Christiano and Katja Grace.", "url": "https://aiimpacts.org/the-ai-impacts-blog/", "title": "The AI Impacts Blog", "source": "aiimpacts.org", "source_type": "wordpress", "date_published": "2015-01-09T21:56:23+00:00", "paged_url": "https://aiimpacts.org/feed?paged=24", "authors": ["Katja Grace"], "id": "09789c36ad7efcac46f255292387f77c", "summary": []}
{"text": "Cases of Discontinuous Technological Progress\n\nWe know of ten events which produced a robust discontinuity in progress equivalent to more than one hundred years at previous rates in some interesting metric. We know of 53 other events which produced smaller or less robust discontinuities.\n\n\nBackground\n----------\n\n\nThese cases were researched as part of our [discontinuous progress investigation](http://aiimpacts.org/discontinuous-progress-investigation/).\n\n\nList of cases\n-------------\n\n\n### Events causing large, robust discontinuities\n\n\n* The Pyramid of Djoser, 2650BC (discontinuity in [structure height trends](http://aiimpacts.org/discontinuity-from-the-burj-khalifa/))\n* The SS *Great Eastern*, 1858 (discontinuity in [ship size trends](http://aiimpacts.org/historic-trends-in-ship-size/))\n* The first telegraph, 1858 (discontinuity in [speed of sending a 140 character message across the Atlantic Ocean](http://aiimpacts.org/historic-trends-in-transatlantic-message-speed/))\n* The second telegraph, 1866 (discontinuity in [speed of sending a 140 character message across the Atlantic Ocean](http://aiimpacts.org/historic-trends-in-transatlantic-message-speed/))\n* The Paris Gun, 1918 (discontinuity in [altitude reached by man-made means](http://aiimpacts.org/discontinuity-in-altitude-records/))\n* The first non-stop transatlantic flight, in a modified WWI bomber, 1919 (discontinuity in both [speed of passenger travel across the Atlantic Ocean](http://aiimpacts.org/historic-trends-in-transatlantic-passenger-travel/) and [speed of military payload travel across the Atlantic Ocean](http://aiimpacts.org/historic-trends-in-long-range-military-payload-delivery/))\n* The George Washington Bridge, 1931 (discontinuity in [longest bridge span](http://aiimpacts.org/historic-trends-in-bridge-span-length/))\n* The first nuclear weapons, 1945 (discontinuity in [relative effectiveness of explosives](http://aiimpacts.org/discontinuity-from-nuclear-weapons/))\n* The first ICBM, 1958 (discontinuity in [average speed of military payload crossing the Atlantic Ocean](http://aiimpacts.org/historic-trends-in-long-range-military-payload-delivery/))\n* YBa2Cu3O7 as a superconductor, 1987 (discontinuity in [warmest temperature of superconduction](http://aiimpacts.org/historic-trends-in-the-maximum-superconducting-temperature/))\n\n\n### Events causing moderate, robust discontinuities\n\n\n* HMS Warrior, 1860 (discontinuity in both [Royal Navy ship tonnage and Royal Navy ship displacement](https://aiimpacts.org/historic-trends-in-ship-size/))\n* Eiffel Tower, 1889 (discontinuity in [tallest existing freestanding structure height](http://aiimpacts.org/discontinuity-from-the-burj-khalifa/), and in other height trends non-robustly)\n* Fairey Delta 2, 1956 (discontinuity in [airspeed](http://aiimpacts.org/historic-trends-in-flight-airspeed-records/))\n* Pellets shot into space, 1957, measured after one day of travel (discontinuity in [altitude achieved by man-made means](http://aiimpacts.org/discontinuity-in-altitude-records/))[1](https://aiimpacts.org/cases-of-discontinuous-technological-progress/#easy-footnote-bottom-1-202 \"This was the first of various altitude records where the object continues to gain distance from Earth’s surface continuously over a long period. One could choose to treat these in different ways, and get different size of discontinuity numbers. Strictly, all altitude increases are continuous, so we are anyway implicitly looking at something like discontinuities in heights reached within some period. We somewhat arbitrarily chose to measure altitudes roughly every year, including one day in for the pellets, the only one where the very start mattered. \")\n* Burj Khalifa, 2009 (discontinuity in [height of tallest building ever](http://aiimpacts.org/discontinuity-from-the-burj-khalifa/))\n\n\n### Non-robust discontinuities\n\n\n[This spreadsheet](https://docs.google.com/spreadsheets/d/1iMIZ57Ka9-ZYednnGeonC-NqwGC7dKiHN9S-TAxfVdQ/edit#gid=1994197408&range=B3:B90) details all discontinuities found, as of April 2020.\n\n", "url": "https://aiimpacts.org/cases-of-discontinuous-technological-progress/", "title": "Cases of Discontinuous Technological Progress", "source": "aiimpacts.org", "source_type": "wordpress", "date_published": "2014-12-31T23:44:11+00:00", "paged_url": "https://aiimpacts.org/feed?paged=25", "authors": ["Katja Grace"], "id": "5d57abf65d894a0c8e997c0aef028a23", "summary": []}
{"text": "Effect of nuclear weapons on historic trends in explosives\n\nNuclear weapons constituted a ~7 thousand year discontinuity in relative effectiveness factor (TNT equivalent per kg of explosive).\n\n\nNuclear weapons do not appear to have clearly represented progress in the cost-effectiveness of explosives, though the evidence there is weak.\n\n\nDetails\n-------\n\n\nThis case study is part of AI Impacts’ [discontinuous progress investigation](https://aiimpacts.org/discontinuous-progress-investigation/).\n\n\n### Background\n\n\nThe development of nuclear weapons is often referenced informally as an example of discontinuous technological progress. Discontinuities are sometimes considered especially plausible in this case because of the involvement of a threshold phenomenon in nuclear chain reactions.\n\n\n21-kiloton underwater nuclear explosion (Bikini Atoll, 1946)[1](https://aiimpacts.org/discontinuity-from-nuclear-weapons/#easy-footnote-bottom-1-201 \"From Wikimedia Commons: U.S. Army Photographic Signal Corps [Public domain]\")\n### Trends\n\n\n#### Relative effectiveness factor\n\n\nThe “relative effectiveness factor” (RE Factor) of an explosive measures the mass of TNT required for an equivalent explosion.[2](https://aiimpacts.org/discontinuity-from-nuclear-weapons/#easy-footnote-bottom-2-201 \"
“TNT Equivalent.” Wikipedia. June 26, 2019. https://web.archive.org/web/20190626194926/https://en.wikipedia.org/wiki/TNT_equivalent \")\n##### **Data**\n\n\nWe collected data on explosive effectiveness from an online timeline of explosives and a comparison of RE factors on Wikipedia.[3](https://aiimpacts.org/discontinuity-from-nuclear-weapons/#easy-footnote-bottom-3-201 \"
Bellis, Mary. “3 Types of Explosive and How They Were Invented.” ThoughtCo. March 01, 2019. Accessed July 02, 2019. https://www.thoughtco.com/history-of-explosives-1991611.
“TNT Equivalent.” Wikipedia. June 26, 2019. https://en.wikipedia.org/wiki/TNT_equivalent#Relative_effectiveness_factor. \") These estimates modestly understate the impact of nuclear weapons, since the measured mass of the nuclear weapons includes the rest of the bomb while the conventional explosives are just for the explosive itself. \n\n\nFigures 1-3 below show the data we collected, which can also be found in [this spreadsheet](https://docs.google.com/spreadsheets/d/1T4TrJBNwTUHuHu17998ltoXMxSRGPcSBtkiMz6tmeH8/edit?usp=sharing). Our data below is incomplete– we elide many improvements between 800 and 1942 that would not affect the size of the discontinuity from “Fat man”. We have verified that there are no explosives with higher RE factor than Hexanitrobenzene before “Fat man” (see the ‘Relative effectiveness data’ in [this spreadsheet](https://docs.google.com/spreadsheets/d/1T4TrJBNwTUHuHu17998ltoXMxSRGPcSBtkiMz6tmeH8/edit#gid=1489897733&range=A1) for this verification). \n\n\n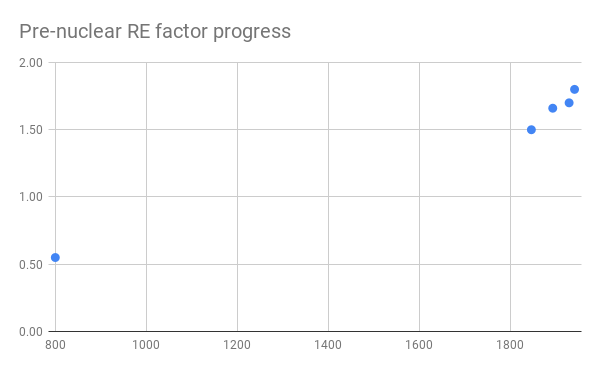Figure 1: Approximate relative effectiveness factor for selected explosives over time, prior to nuclear weapons.\nFigure 2: Approximate relative effectiveness factor for selected explosives, up to early nuclear bomb (note change to log scale) \n##### Discontinuity Measurement\n\n\nTo compare nuclear weapons to past rates of progress, we treat progress as exponential.[4](https://aiimpacts.org/discontinuity-from-nuclear-weapons/#easy-footnote-bottom-4-201 \"See our methodology page for more details.\") With this assumption, the first nuclear weapon, “Fat man”, represented a around seven thousand years of discontinuity in the RE factor of explosives at previous rates.[5](https://aiimpacts.org/discontinuity-from-nuclear-weapons/#easy-footnote-bottom-5-201 \"See our methodology page for more details, and our spreadsheet for our calculation.\") In addition to the size of this discontinuity in years, we have tabulated a number of other potentially relevant metrics [here](https://docs.google.com/spreadsheets/d/1iMIZ57Ka9-ZYednnGeonC-NqwGC7dKiHN9S-TAxfVdQ/edit?usp=sharing).[6](https://aiimpacts.org/discontinuity-from-nuclear-weapons/#easy-footnote-bottom-6-201 \"See our methodology page for more details.\") \n\n\nWe checked if “Fat Man” constituted a discontinuity, but did not look for other discontinuities, because we have not thoroughly searched for data on earlier developments. Even though we’re missing data, since gunpowder is the earliest known explosive and Hexanitrobenzene is the explosive before “Fat man” with the highest RE factor, the missing data should not affect discontinuity calculations for “Fat man” unless it suggests we should be predicting using a different trend. This seems unlikely given that early explosives all have an RE factor close to that of our existing data points, around 1 – 3 (see table [here](https://en.wikipedia.org/wiki/TNT_equivalent#Relative_effectiveness_factor))[7](https://aiimpacts.org/discontinuity-from-nuclear-weapons/#easy-footnote-bottom-7-201 \" “TNT Equivalent.” Wikipedia. June 26, 2019. https://en.wikipedia.org/wiki/TNT_equivalent#Relative_effectiveness_factor. \"), so are not vastly inconsistent with our exponential. If we instead assumed a linear trend, or an exponential ignoring the early gunpowder datapoint, we still get answers of over three thousand years (see [spreadsheet](https://docs.google.com/spreadsheets/d/1T4TrJBNwTUHuHu17998ltoXMxSRGPcSBtkiMz6tmeH8/edit#gid=0) for calculations).\n\n\n##### Discussion of causes\n\n\nInterestingly, at face value this discontinuous jump does not seem to be directly linked to the chain reaction that characterizes nuclear explosions, but rather to the massive gap between the energies involved in chemical interactions and nuclear interactions. It seems likely that similar results would obtain in other settings; for example, the accessible energy in nuclear fuel enormously exceeds the energy stored in chemical fuels, and so at some far future time we might expect a dramatic jump in the density with which we can store energy (though arguably not in the cost-effectiveness).[8](https://aiimpacts.org/discontinuity-from-nuclear-weapons/#easy-footnote-bottom-8-201 \"See this blog post for a discussion of why nuclear weapons were such a large discontinuity.\")\n#### Cost-effectiveness of explosives\n\n\nAnother important measure of progress in explosives is cost-effectiveness. Cost-effectiveness is particularly important to understand, because some plausible theories of continuous progress would predict continuous improvements in cost-effectiveness much more strongly than they would predict continuous improvements in explosive density.\n\n\n##### Data\n\n\n###### Cost-effectiveness of nuclear weapons\n\n\nAssessing the cost of nuclear weapons is not straightforward empirically, and depends on the measurement of cost. The development of nuclear weapons incurred a substantial upfront cost, and so for some time the average cost of nuclear weapons significantly exceeded their marginal cost. We provide estimates for the marginal costs of nuclear weapons, as well as for the “average” cost of all nuclear explosives produced by a certain date.\n\n\nWe focus our attention on WWII and the immediately following period, to understand the extent to which the development of nuclear weapons represented a discontinuous change in cost-effectiveness.\n\n\nSee [our spreadsheet](https://docs.google.com/spreadsheets/d/1_OTLC2Pvd2Umfn0rf9giQS22Tn8uIJP2-gYA6x3s750/edit?usp=sharing) for a summary of the data explained below. According to the [Brookings Institute](http://www.brookings.edu/research/books/1998/atomic), nuclear weapons were by 1950 considered to be especially cost-effective (though not obviously in terms of explosive power per dollar), and adopted for this reason. However, Brookings notes that this has never been validated, and appears to distrust it.[9](https://aiimpacts.org/discontinuity-from-nuclear-weapons/#easy-footnote-bottom-9-201 \" “Some observers believe the absence of a third world war confirms that these weapons were a prudent and cost-effective response to the uncertainty and fear surrounding the Soviet Union’s military and political ambitions during the cold war. As early as 1950, nuclear weapons were considered relatively inexpensive— providing “a bigger bang for a buck”—and were thoroughly integrated into U.S. forces on that basis. Yet this assumption was never validated. Indeed, for more than fifty years scant attention has been paid to the enormous costs of this effort—more than $5 trillion thus far—and its short and long-term consequences for the nation.”
Schwartz, Stephen I., and Stephen I. Schwartz. “Atomic Audit.” Brookings. October 23, 2018. Accessed July 02, 2019. https://www.brookings.edu/book/atomic-audit/. \") This disagreement weakly suggests that nuclear weapons are at least not radically more or less cost-effective than other weapons.\n\n\n[According to Wikipedia](http://en.wikipedia.org/wiki/Manhattan_Project), the cost of the Manhattan project was about $26 billion (in 2014 dollars), 90% of which “was for building factories and producing the fissile materials.”[10](https://aiimpacts.org/discontinuity-from-nuclear-weapons/#easy-footnote-bottom-10-201 \"“Manhattan Project.” Wikipedia. June 29, 2019. Accessed July 02, 2019. https://en.wikipedia.org/wiki/Manhattan_Project. \") The Brookings U.S. Nuclear Weapons Cost Study Project [estimates](http://www.brookings.edu/about/projects/archive/nucweapons/manhattan) the price as $20 billion 2014 dollars, resulting in similar conclusions.[11](https://aiimpacts.org/discontinuity-from-nuclear-weapons/#easy-footnote-bottom-11-201 \"
“The Costs of the Manhattan Project.” Brookings. April 14, 2017. Accessed July 02, 2019. https://www.brookings.edu/the-costs-of-the-manhattan-project/. \") [This post](http://wiki.answers.com/Q/How_many_atomic_bombs_were_made_during_ww2) claims that 9 bombs were produced through the end of “[Operation Crossroads](http://en.wikipedia.org/wiki/Operation_Crossroads)” in 1946, citing Chuck Hansen’s[Swords of Armageddon](http://www.uscoldwar.com/).[12](https://aiimpacts.org/discontinuity-from-nuclear-weapons/#easy-footnote-bottom-12-201 \" “The next definite data in Swords of Armageddon gives bomb production up to the end of the 1946 Operation Crossroads: total bombs built 9, total bombs detonated 5, bombs remaining in stockpile 4. “
“How Many Atomic Bombs Were Made during Ww2.” Answers. Accessed July 02, 2019. https://www.answers.com/Q/How_many_atomic_bombs_were_made_during_ww2.
“Index.htm.” Index.htm. Accessed July 02, 2019. http://www.uscoldwar.com/. \") The explosive power of these bombs was likely to be about 20kT, suggesting a total explosive capacity of 180kT. [Anecdotes](https://aiimpacts.org/discontinuity-from-nuclear-weapons/?preview_id=201&preview_nonce=b10f13d56d&preview=true) suggest that the cost to actually produce a bomb were about $25M,[13](https://aiimpacts.org/discontinuity-from-nuclear-weapons/#easy-footnote-bottom-13-201 \"“Just before take-off, Admiral Purnell asked Sweeney if he knew how much the bomb cost. Sweeney answered, ‘About $25 million.’ Purnell then warned him, ‘See that we get our money’s worth.'” – “Wayback Machine”. 2019. Web.Archive.Org. Accessed July 5 2019. https://web.archive.org/web/20150406054646/http://www.mputtre.com/sitebuildercontent/sitebuilderfiles/copy_of_tinian_fat_man_speech.pdf.\") or about $335M in 2014 dollars. This would make the marginal cost around $16.8k per ton of TNT equivalent ($335M/20kT = $16.75k/T), and the average cost around $111k/T.\n\n\nIn 2013 the US apparently planned to build 3,000 nuclear weapons for $60B.[14](https://aiimpacts.org/discontinuity-from-nuclear-weapons/#easy-footnote-bottom-14-201 \" “Ultimately, the plan calls for some 3,000 of these new weapons at an estimated cost of $60 billion, or $20 million each.”
“How Much Does It Cost to Create a Single Nuclear Weapon?” Union of Concerned Scientists. Accessed July 02, 2019. https://www.ucsusa.org/publications/ask/2013/nuclear-weapon-cost.html#.VKNkUIrF8kM. \") However it [appears](http://www.armscontrol.org/reports/The-Unaffordable-Arsenal-Reducing-the-Costs-of-the-Bloated-US-Nuclear-Stockpile/2014/10/Section_one) that at least some of these may be refurbishments rather than building from scratch, and the [B61-12](http://www.armscontrol.org/reports/The-Unaffordable-Arsenal-Reducing-the-Costs-of-the-Bloated-US-Nuclear-Stockpile/2014/10/Section_one) design at least appears to be designed to be less powerful than it could be, since it is less powerful than the bombs it is replacing[15](https://aiimpacts.org/discontinuity-from-nuclear-weapons/#easy-footnote-bottom-15-201 \"“The new Air Force bomber would carry two types of nuclear weapons: a rebuilt gravity bomb (the B61-12) and a cruise missile, known as the Long-Range Stand-Off (LSRO) weapon or Air-Launched Cruise Missile (ALCM)” “The B61-12 would have a maximum yield of up to 50 kilotons, but would replace a bomb (the B61-7) with a yield of up to 360 kilotons. “
“Projects & Reports.” SECTION 1: Nuclear Reductions Save Money | Arms Control Association. Accessed July 02, 2019. https://www.armscontrol.org/reports/The-Unaffordable-Arsenal-Reducing-the-Costs-of-the-Bloated-US-Nuclear-Stockpile/2014/10/Section_one. \") and much less powerful than a nuclear weapon such as the [Tsar Bomba](https://en.wikipedia.org/wiki/Tsar_Bomba), with a yield of 50mT.[16](https://aiimpacts.org/discontinuity-from-nuclear-weapons/#easy-footnote-bottom-16-201 \"“Blast yield50 megatons of TNT (210 PJ)[2]“
“Tsar Bomba.” In Wikipedia, October 24, 2019. https://en.wikipedia.org/w/index.php?title=Tsar_Bomba&oldid=922820257. \") The B61-12 is a 50kT weapon. These estimates give us $400/T ($60B/3,000\\*50kT). They are very approximate, for reasons given. However have not found better estimates. Note that they are for comparison, and not integral to our conclusions.\n\n\nThese estimates could likely be improved by a more careful survey, and extended to later nuclear weapons; the book [Atomic Audit](https://play.google.com/store/books/details/Stephen_I_Schwartz_Atomic_Audit?id=safduT80AHMC) seems likely to contain useful resources.[17](https://aiimpacts.org/discontinuity-from-nuclear-weapons/#easy-footnote-bottom-17-201 \"Schwartz, Stephen I., and Stephen I. Schwartz. “Atomic Audit.” Brookings. October 23, 2018. Accessed July 02, 2019. https://www.brookings.edu/book/atomic-audit/. \")\n\n\n| | | |\n| --- | --- | --- |\n| Year | Description of explosive | Cost per ton TNT equivalent |\n| 1920 | Ammonium nitrate | $5.6k |\n| 1920 | TNT | $10.5k |\n| 1946 | 9 ([Mark 1 and Mark 3’s](http://en.wikipedia.org/wiki/List_of_nuclear_weapons#United_States)) x 20kt (marginal) | $16.8k (marginal Mark 3) |\n| 1946 | 9 ([Mark 1 and Mark 3’s](http://en.wikipedia.org/wiki/List_of_nuclear_weapons#United_States)) x 20kt (average) | $111k (average Mark 3) |\n| | [3,000](http://www.ucsusa.org/publications/ask/2013/nuclear-weapon-cost.html#.VKNkUIrF8kM) weapons in the 3+2 plan | $400 |\n\n\n***Table 2: Total, average and marginal costs associated with different weapons arsenals***\n\n\n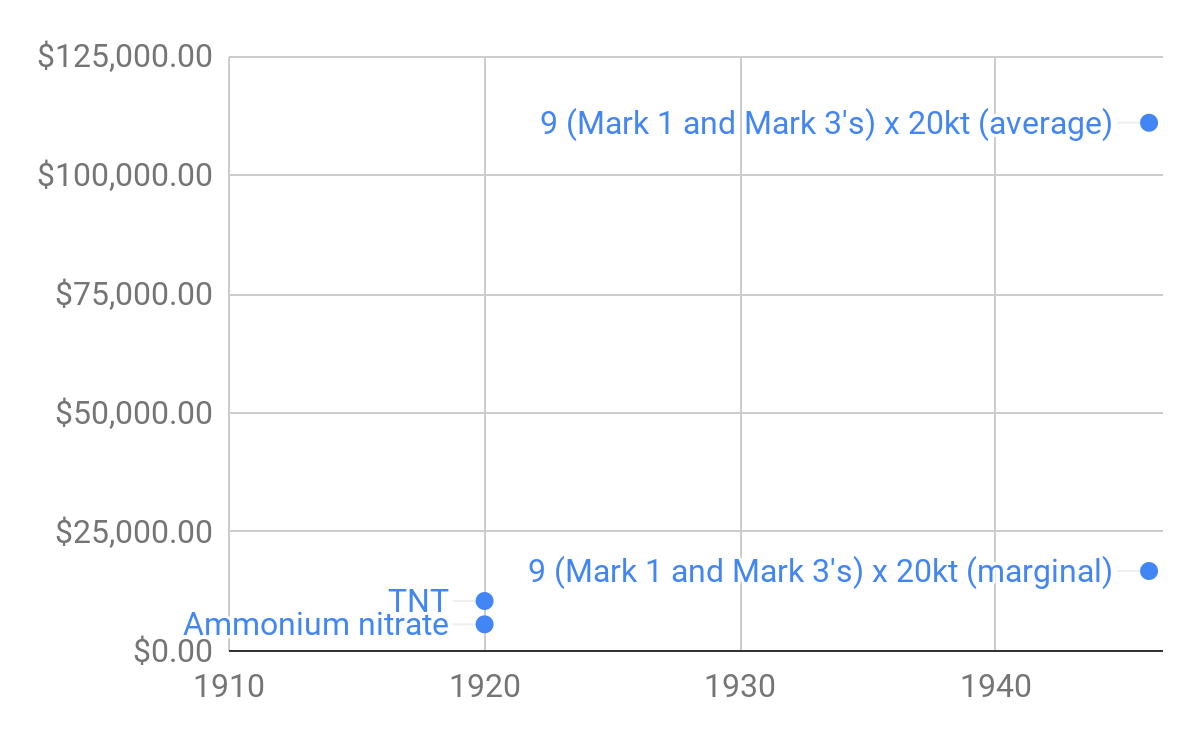Figure 4: Cost-effectiveness of nuclear weapons\n###### Cost-effectiveness of non-nuclear weapons\n\n\nWe have found little information about the cost of pre-nuclear bombs in the early 20th Century. However [what we have](https://docs.google.com/spreadsheets/d/1_OTLC2Pvd2Umfn0rf9giQS22Tn8uIJP2-gYA6x3s750/edit?usp=sharing) (explained below) suggests they cost a comparable amount to nuclear weapons, for a certain amount of explosive energy.\n\n\n[Ammonium nitrate](http://en.wikipedia.org/wiki/Ammonium_nitrate) and [TNT](http://en.wikipedia.org/wiki/Trinitrotoluene) appear to be large components of many high explosives used in WWII. For instance, [blockbuster bombs](http://en.wikipedia.org/wiki/Blockbuster_bomb) were apparently filled with [amatol](http://en.wikipedia.org/wiki/Amatol), which is a mixture of TNT and ammonium nitrate.[18](https://aiimpacts.org/discontinuity-from-nuclear-weapons/#easy-footnote-bottom-18-201 \"”
Amatol was used extensively during World War I and World War II, typically as an explosive in military weapons such as aircraft bombs, shells, depth charges, and naval mines.”
“Amatol.” Wikipedia. May 25, 2019. Accessed July 02, 2019. https://en.wikipedia.org/wiki/Amatol. \")\nAn [appropriations bill from 1920 (p289)](https://books.google.com/books?id=S-ksAAAAYAAJ&pg=PA289&dq=For+example,+as+was+explained+yesterday+general+deficiency+bill&hl=en&sa=X&ei=XVqjVOHrI8rjoATD5IDQBA&ved=0CB8Q6AEwAA#v=onepage&q=For%20example%2C%20as%20was%20explained%20yesterday%20general%20deficiency%20bill&f=false) suggests that the 1920 price of ammonium nitrate was about $0.10-0.16 per pound, [which is](http://www.usinflationcalculator.com/) about $1.18 per pound in 2014.[19](https://aiimpacts.org/discontinuity-from-nuclear-weapons/#easy-footnote-bottom-19-201 \"“For example, as was explained yesterday, TNT will cost on an average 44 cents a pound, whereas ammonium nitrate will run from, say, 10 to 15.5 cents…” General Deficiency Bill, 1918: Hearings Before Subcommittee of House Committee on Appropriations … in Charge of Deficiency Appropriations for the Fiscal Year 1917 and Prior Fiscal Years, Sixty-fifth Congress, Second Session. Accessed online at \") It suggests TNT was $0.44 per pound, or around $5.20 per pound in 2014. These estimates are consistent with [that of](http://www.quora.com/How-expensive-were-bombs-during-World-War-Two/answer/Peter-Hand-4) a Quora commenter.[20](https://aiimpacts.org/discontinuity-from-nuclear-weapons/#easy-footnote-bottom-20-201 \"
“Peter Hand.” Quora. Accessed July 02, 2019. https://www.quora.com/How-expensive-were-bombs-during-World-War-Two/answer/Peter-Hand-4. \")\nThis puts TNT at $10.4k/ton: very close to the $16.8k/ton marginal cost of an equivalent energy from Mark 3 nuclear weapons, and well below the average cost of Mark 3 nuclear weapons produced by the end of Operation Crossroads.\n\n\nAmmonium nitrate is about [half as energy dense](http://en.wikipedia.org/wiki/Relative_effectiveness_factor) as TNT, suggesting a price of about $5.6k/T.[21](https://aiimpacts.org/discontinuity-from-nuclear-weapons/#easy-footnote-bottom-21-201 \"($1.18 per pound of ammonium nitrate * 1/0.42 relative effectiveness adjustment for ammonium nitrate relative to TNT * 2000 pounds in a ton)\") [22](https://aiimpacts.org/discontinuity-from-nuclear-weapons/#easy-footnote-bottom-22-201 \"
“TNT Equivalent.” Wikipedia. June 26, 2019. https://en.wikipedia.org/wiki/TNT_equivalent#Relative_effectiveness_factor. \") This is substantially lower than the marginal cost of the Mark 3.\n\n\nNote that these figures are for explosive material only, whereas the costs of nuclear weapons used here are more inclusive. Ammonium nitrate may be far from the most expensive component of amatol-based explosives, and so what we have may be a very substantial underestimate for the price of conventional explosives. There is also some error from [synergy](http://en.wikipedia.org/wiki/Amatol) between the components of amatol.[23](https://aiimpacts.org/discontinuity-from-nuclear-weapons/#easy-footnote-bottom-23-201 \"Amatol is a mixture of TNT and ammonium nitrate that benefits from the TNT getting to use some of the oxygen from the ammonium nitrate.
“Amatol.” Wikipedia. May 25, 2019. Accessed July 02, 2019. https://en.wikipedia.org/wiki/Amatol. \")\n##### Discontinuity Measurement\n\n\nWithout a longer-run price trend in explosives, we do not have enough pre-discontinuity data to measure a discontinuity.[24](https://aiimpacts.org/discontinuity-from-nuclear-weapons/#easy-footnote-bottom-24-201 \"See our methodology page for more details.\") However, from the evidence we have here, it is unclear that nuclear weapons represent any development at all in cost-effectiveness, in terms of explosive power per dollar. Thus it seems unlikely that nuclear weapons were surprisingly cost-effective, at least on that metric.\n\n\nNotes\n-----\n\n\n\n\n\n\n\n\n\n\n\n\n\n", "url": "https://aiimpacts.org/discontinuity-from-nuclear-weapons/", "title": "Effect of nuclear weapons on historic trends in explosives", "source": "aiimpacts.org", "source_type": "wordpress", "date_published": "2014-12-31T11:45:48+00:00", "paged_url": "https://aiimpacts.org/feed?paged=25", "authors": ["Katja Grace"], "id": "b8b18c14158c40228b8b200ce0c6f119", "summary": []}
{"text": "AGI-09 Survey\n\n[Baum et al.](http://sethbaum.com/ac/2011_AI-Experts.pdf) surveyed 21 attendees of the [AGI-09](http://agi-conference.org/2009/) conference, on [AGI](http://en.wikipedia.org/wiki/Artificial_General_Intelligence) timelines with and without extra funding. They also asked about other details of AGI development such as social impacts, and promising approaches.\n\n\nTheir findings include the following:\n\n\n* The median dates when participants believe there is a 10% , 50% and 90% probability that AI will pass a Turing test are 2020, 2040, and 2075 respectively.\n* Predictions changed by only a few years when participants were asked to imagine $100 billion (or sometimes $1 billion, due to a typo) in funding.\n* There was apparently little agreement on the ordering of milestones (‘turing test’, ‘third grade’, ‘Nobel science’, ‘super human’), except that ‘super human’ AI would not come before the other milestones.\n* A strong majority of participants believed ‘integrative designs’ were more likely to contribute critically to creation of human-level AGI than narrow technical approaches.\n\n\nDetails\n-------\n\n\n### Detailed results\n\n\n#### Median confidence levels for different milestones\n\n\nTable 1 shows median dates given for different confidence levels of AI reaching four benchmarks: able to pass an online third grade test, able to pass a Turing test, able to produce science that would win a Nobel prize, and ‘super human’.\n\n\n[](https://sites.google.com/site/aiimpactslibrary/ai-timelines/predictions-of-human-level-ai-dates/ai-expert-surveys/baum-et-al-ai-expert-survey/baumetaltable2.jpg?attredirects=0)\n\n\n#### Best guess times for various milestones\n\n\nFigure 2 shows the distribution of participants’ best guesses – probably usually interpreted as 50 percent confidence points – for the timing of these benchmarks, given status quo levels of funding.\n\n\n[](https://sites.google.com/site/aiimpactslibrary/ai-timelines/predictions-of-human-level-ai-dates/ai-expert-surveys/baum-et-al-ai-expert-survey/BaumetalFigure2%20copy.jpg?attredirects=0)\n\n\n#### Individual confidence intervals for each milestone\n\n\nFigure 4 shows all participants’ confidence intervals for all benchmarks. Participant 17 appears to be interpreting ‘best guess’ as something other than fiftieth percentile of probability, though the other responses appear to be consistent with this interpretation.\n\n\n[](https://sites.google.com/site/aiimpactslibrary/ai-timelines/predictions-of-human-level-ai-dates/ai-expert-surveys/baum-et-al-ai-expert-survey/BaumetalFigure4%20copy.jpg?attredirects=0)\n\n\n#### Expected social impacts\n\n\nFigure 6 illustrates responses to three questions about social impact. The participants were asked about the probability of negative social impact, if the first AGI that can pass the Turing test is created by an open source project, by the United States military, or by a private company focused on commercial profit. The paper summarises that the experts lacked consensus.\n\n\n[](http://aiimpacts.wpengine.com/wp-content/uploads/2014/12/baumetalsocialimpact-copy.jpg)‘Fig. 6. Probability of a negative-to-humanity outcome for different development scenarios. The three development scenarios are if the first AGI that can pass the Turing test is created by an open source project (x’s), the United States military (squares), or a private company focused on commercial profit (triangles). Participants are displayed in the same order as in figure 4, such that Participant 1 in figure 6 is the same person as Participant 1 in figure 4.’\n\n\n### Methodological details\n\n\nThe survey contained a set of standardized questions, plus individualized followup questions. It can be downloaded from [here](http://sethbaum.com/ac/2011_AI-Experts.html).\n\n\nIt included questions on:\n\n\n* when AI would meet certain benchmarks (passing third grade, turing test, Nobel quality research, superhuman), with and without billions of dollars of additional funding. Participants were asked for confidence intervals (10%, 25%, 75%, 90%) and ‘best estimates’ (interpreted above as 50% confidence levels).\n* Embodiment of the first AGIs (physical, virtual, minimal)\n* What AI software paradigm the first AGIs would be based on (formal neural networks, probability theory, uncertain logic, evolutionary learning, a large hand-coded knowledge-base, mathematical theory, nonlinear dynamical systems, or an integrative design combining multiple paradigms)\n* Probability of strongly negative-to-humanity outcome if the first AGIs were created by different parties (an open-source project, the US military, or a private for-profit software company)\n* If quantum computing or hypercomputing would be required for AGI.\n* Whether brain emulations would be conscious\n* The experts’ area of expertise\n\n\n#### Participants\n\n\nMost of the participants were actively involved in AI research. The paper describes them:\n\n\n\n> Study participants have a broad range of backgrounds and experience, all with significant prior thinking about AGI. Eleven are in academia, including six Ph.D. students, four faculty members, and one visiting scholar, all in AI or allied fields. Three lead research at independent AI research organizations and three do the same at information technology organizations. Two are researchers at major corporations. One holds a high-level administrative position at a relevant non-profit organization. One is a patent attorney. All but four participants reported being actively engaged in conducting AI research.\n> \n> \n\n\nAccording to [the website](http://agi-conference.org/2009/), the AGI-09 conference gathers “leading academic and industry researchers involved in serious scientific and engineering work aimed directly toward the goal of artificial general intelligence”. While these people are expert in the field, they are also probably highly selected for being optimistic about the timing of human-level AI. This seems likely to produce some bias.\n\n\n#### Meaning of ‘Turing test’\n\n\nSeveral meanings of ‘Turing test’ are prevalent, and it is unclear what distribution of them is being used by participants. The authors note that some participants asked about this ambiguity, and were encouraged verbally to consider the ‘one hour version’ instead of the ‘five minute version’, because the shorter one might be gamed by chat-bots (p6). The authors also write, ‘Using human cognitive development as a model, one might think that being able to do Nobel level science would take much longer than being able to conduct a social conversation, as in the Turing Test’ (p8). Both of these points suggest that the authors at least were thinking of a Turing test as a test of normal social conversation rather than a general test of human capabilities as they can be observed via a written communication channel.\n\n", "url": "https://aiimpacts.org/agi-09-survey/", "title": "AGI-09 Survey", "source": "aiimpacts.org", "source_type": "wordpress", "date_published": "2014-12-29T18:50:48+00:00", "paged_url": "https://aiimpacts.org/feed?paged=25", "authors": ["Katja Grace"], "id": "afa775c39ad02407fac446d03410f503", "summary": []}
{"text": "Bainbridge Survey\n\nA [survey](http://www.wtec.org/ConvergingTechnologies/3/NBIC3_report.pdf) of twenty-six technology experts in 2005 produced a median of 2085 as the year in which artificial intelligence would be able to functionally replicate a human brain (p344). They rated this application 5.6/10 in beneficialness to humanity.\n\n\nDetails\n-------\n\n\nIn 2005 William Bainbridge [reported](http://www.wtec.org/ConvergingTechnologies/3/NBIC3_report.pdf) on a survey of 26 contributors to Converging Technologies reports. The contributors were asked when a large number of applications would be developed, and how beneficial they would be (see [Appendix 1](http://www.wtec.org/ConvergingTechnologies/3/NBIC3_report.pdf)). The survey produced 2085 as the median year in which “the computing power and scientific knowledge will exist to build machines that are functionally equivalent to the human brain” (p344). The participants rated this development 5.6 out of 10 in beneficialness.\n\n\n### Participants\n\n\nBainbridge’s participants are contributors to ‘converging technology’ reports, which are on topics of nanotechnology, biotechnology, information technology, and cognitive science. From looking at [what appears to be one of these reports](http://www.wtec.org/ConvergingTechnologies/Report/NBIC_report.pdf), these seem to be mostly experts from government and national laboratories, academia, and the private sector. Few work in AI in particular. For instance, an arbitrary sample includes the Director of the Division of Behavioral and Cognitive Sciences at the [National Science Foundation](http://www.nsf.gov/), a person from the [Defense Threat Reduction Agency](http://www.dtra.mil/), and a person from [HP laboratories](http://www.hpl.hp.com/).\n\n", "url": "https://aiimpacts.org/bainbridge-survey/", "title": "Bainbridge Survey", "source": "aiimpacts.org", "source_type": "wordpress", "date_published": "2014-12-29T18:50:48+00:00", "paged_url": "https://aiimpacts.org/feed?paged=25", "authors": ["Katja Grace"], "id": "d1ed861eeacb0c4c43bd6615fd744a22", "summary": []}
{"text": "AI@50 Survey\n\nA seemingly informal seven-question poll was taken of participants at the AI@50 conference in 2006. 41% of respondents said it would take more than 50 years for AI to simulate every aspect of human intelligence, and 41% said it would never happen.\n\n\nDetails\n-------\n\n\n### AI timelines question\n\n\nOne question was “when will computers be able to simulate every aspect of human intelligence?” 41% of respondents said “More than 50 years” and 41% said “Never”.\n\n\n### Participants and interpretation\n\n\nWe do not know how many people participated in the conference or in the poll.\n\n\nLuke Muehlhauser [points out](http://intelligence.org/2013/05/15/when-will-ai-be-created/#footnote_2_10199) that many of the respondents were probably college students, rather than experts, and that the question may have been interpreted as asking in part about the possibility of machine consciousness.\n\n\n### Records of the poll\n\n\nInformation about the poll was available at http://web.archive.org/web/20110710193831/http://www.engagingexperience.com/ai50/ when we put up this page, but it has since become inaccessible. Secondary descriptions of parts of it exist at https://intelligence.org/2013/05/15/when-will-ai-be-created/#footnote\\_2\\_10199 and http://sethbaum.com/ac/2011\\_AI-Experts.pdf\n\n", "url": "https://aiimpacts.org/ai50-survey/", "title": "AI@50 Survey", "source": "aiimpacts.org", "source_type": "wordpress", "date_published": "2014-12-29T18:50:48+00:00", "paged_url": "https://aiimpacts.org/feed?paged=25", "authors": ["Katja Grace"], "id": "5a4563bd0b8728f0142cc26b49361e92", "summary": []}
{"text": "Early Views of AI\n\nThis is an incomplete list of early works we have found discussing AI or AI related problems.\n\n\nList\n----\n\n\n1. Claude Shannon (1950), in [Programming a Computer for Playing Chess](http://vision.unipv.it/IA1/ProgrammingaComputerforPlayingChess.pdf), offers the following list of “possible developments in the immediate future,”\n\n\n* Machines for designing filters, equalizers, etc\n* Machines for designing relay and switching circuits\n* Machines which will handle routing of telephone calls based on the individual circumstances rather than by fixed patterns\n* Machines for performing symbolic (non-numerical) mathematical operations\n* Machines capable of translating from one language to another\n* Machines for making strategic decisions in simplified military operations\n* Machines capable of orchestrating a melody\n* Machines capable of logical deduction\n\n\n2. The [proposal](http://www-formal.stanford.edu/jmc/history/dartmouth/dartmouth.html) for Dartmouth conference on AI offers the following “aspects of the artificial intelligence project”:\n\n\n* Automatic computers. This appears to be an application rather than an aspect of the problem; if you can describe how to do a task precisely, it can be automated.\n* How Can a Computer be Programmed to Use a Language\n* How can a set of (hypothetical) neurons be arranged so as to form concepts\n* Theory of the size of a calculation\n* Self-improvement\n* Abstractions. “A direct attempt to classify these and to describe machine methods of forming abstractions from sensory and other data would seem worthwhile.”\n* Randomness and creativity\n", "url": "https://aiimpacts.org/early-views-of-ai/", "title": "Early Views of AI", "source": "aiimpacts.org", "source_type": "wordpress", "date_published": "2014-12-29T18:47:46+00:00", "paged_url": "https://aiimpacts.org/feed?paged=25", "authors": ["Katja Grace"], "id": "801d7977e134cf8e66afd5429b52b36e", "summary": []}
{"text": "FHI Winter Intelligence Survey\n\nThe Future of Humanity Institute [administered a survey](http://www.fhi.ox.ac.uk/machine-intelligence-survey-2011.pdf) in 2011 at their [Winter Intelligence AGI impacts conference](http://www.winterintelligence.org/oxford2012/agi-impacts/). Participants’ median estimate for a 50% chance of human-level AI was 2050.\n\n\nDetails\n-------\n\n\n### AI timelines question\n\n\nThe survey included the question: “Assuming no global catastrophe halts progress, by what year would you assign a 10%/50%/90% chance of the development of human-level machine intelligence? Feel free to answer ‘never’ if you believe such a milestone will never be reached.”\n\n\nThe first quartile / second quartile / third quartile responses to each of these three questions were as follows:\n\n\n10% chance: 2015 / 2028 / 2030 \n\n50% chance: 2040 / 2050 / 2080 \n\n90% chance: 2100 / 2150 / 2250\n\n\n### Participants and selection effects\n\n\nSurvey participants probably expect AI sooner than comparably expert groups, by virtue of being selected from participants at the Winter Intelligence conference. The conference is [described as](http://www.winterintelligence.org/oxford2012/agi-impacts/press-release/) focussing on “artificial intelligence and the impacts it will have on the world,” a topic of disproportionately great natural interest to researchers who believe that AI will substantially impact the world soon. The response rate to the survey was 41% (35 respondents), limiting response bias.\n\n\nWhen asked “Prior to this conference, how much have you thought about these issues?” the respondents were roughly evenly divided between “Significant interest,” “Minor research focus / sustained study,” and “major research focus.”\n\n\nWhen asked to describe their field, of the 35 respondents, 22% indicated an area that the survey administrators considered to be “AI and Robotics” as their field, 22% indicated a field considered to be “computer science and engineering,” and the remainder indicated a variety of fields with less direct relevant to AI progress (excepting perhaps cognitive science and neuroscience, whose prevalence the authors do not report). The administrators of the survey write:\n\n\n“There were no significant (as per ANOVA) inter-group differences in regards to who would develop AI, the outcomes, type of AI, expertise, or likelihood of Watson winning. Merging the AI and computer science group and the philosophy and general academia group did not change anything: participant views did not link strongly to their formal background. ” (p. 10).\n\n", "url": "https://aiimpacts.org/fhi-ai-timelines-survey/", "title": "FHI Winter Intelligence Survey", "source": "aiimpacts.org", "source_type": "wordpress", "date_published": "2014-12-29T18:47:28+00:00", "paged_url": "https://aiimpacts.org/feed?paged=25", "authors": ["Katja Grace"], "id": "8c61a7c3462ff1742bb6cf2adda953fb", "summary": []}
{"text": "Hanson AI Expert Survey\n\nIn a small informal survey running since 2012, AI researchers generally estimated that their subfields have moved less than ten percent of the way to human-level intelligence. Only one (in the slowest moving subfield) observed acceleration.\n\n\nThis suggests on a simple extrapolation that reaching human-level capability across subfields will take over a century (in contrast with many other predictions).\n\n\nDetails\n-------\n\n\nRobin Hanson [has asked experts](http://www.overcomingbias.com/2012/08/ai-progress-estimate.html) in various social contexts to estimate how far we’ve come in their own subfield of AI research in the last twenty years, compared to how far we have to go to reach human level abilities. His results are listed in Table 1. He points out that on an [outside view](http://wiki.lesswrong.com/wiki/Outside_view) calculation, this suggests at least a century until human-level AI.\n\n\n\n\n| | | | | |\n| --- | --- | --- | --- | --- |\n| Year added to list | Person | Subfield | Distance in 20y | Acceleration |\n| 2012 | A few UAI attendees | | 5-10% | ~0 |\n| 2012 | Melanie Mitchell | Analogical reasoning | 5% | ~0 |\n| 2012 | Murray Shanahan | Knowledge representation | 10% | ~0 |\n| 2013 | Wendy Hall | Computer-assisted training | 1% | |\n| 2013 | Claire Cardie (and Peter Norvig agrees in ’14) | Natural language processing | 20% | |\n| 2013 | Boi Faltings (and Peter Norvig agrees in ’14) | Constraint satisfaction | Past human-level 20 years ago | |\n| 2014 | Aaron Dollar | robotic grasping manipulation | <1% | positive |\n| 2014 | Peter Norvig | \\* | | |\n| 2014 | Timothy Meese | early human vision processing | 5% | negative |\n| 2015 | Francesca Rossi | constraint reasoning | 10% | negative |\n| 2015 | Margret Boden | no particular subfield | 5% | |\n| 2015 | David Kelley | big data analysis | 5% | positive |\n| 2016 | Henry Kautz | constraint satisfaction | >100% | |\n| 2016 | Henry Kautz | language | 10% | positive |\n| 2016 | Jeff Legault | robotics | 5% | positive |\n| 2017 | Thore Husfeldt | human-understandable explanation | <0.5% | |\n\n\n***Table 1*** : ***Results from Robin Hanson’s informal survey***\n\n\n\\*Hanson’s [summary](http://www.overcomingbias.com/2012/08/ai-progress-estimate.html#sthash.7PusXP8C.dpuf) of Peter Norvig’s response seems hard to fit into this framework:\n\n\n\n> After coming to a talk of mine, Peter Norvig told me that he agrees with both Claire Cardie and Boi Faltings, that on speech recognition and machine translation we’ve gone from not usable to usable in 20 years, though we still have far to go on deeper question answering, and for retrieving a fact or page that is relevant to a search query we’ve far surpassed human ability in recall and do pretty well on precision.\n> \n> \n\n", "url": "https://aiimpacts.org/hanson-ai-expert-survey/", "title": "Hanson AI Expert Survey", "source": "aiimpacts.org", "source_type": "wordpress", "date_published": "2014-12-29T18:47:27+00:00", "paged_url": "https://aiimpacts.org/feed?paged=25", "authors": ["Katja Grace"], "id": "353071a56e2063863eb47d823c282e3a", "summary": []}
{"text": "Müller and Bostrom AI Progress Poll\n\nVincent Müller and Nick Bostrom of FHI conducted a [poll of four groups of AI experts](http://www.nickbostrom.com/papers/survey.pdf) in 2012-13. Combined, the median date by which they gave a 10% chance of human-level AI was 2022, and the median date by which they gave a 50% chance of human-level AI was 2040.\n\n\nDetails\n-------\n\n\nAccording to [Bostrom](http://www.amazon.com/Superintelligence-Dangers-Strategies-Nick-Bostrom/dp/0199678111), the participants were asked when they expect “human-level machine intelligence” to be developed, defined as “one that can carry out most human professions at least as well as a typical human”. The results were as follows. The groups surveyed are described below.\n\n\n\n\n| | | | | |\n| --- | --- | --- | --- | --- |\n| | Response rate | 10% | 50% | 90% |\n| PT-AI | 43% | 2023 | 2048 | 2080 |\n| AGI | 65% | 2022 | 2040 | 2065 |\n| EETN | 10% | 2020 | 2050 | 2093 |\n| TOP100 | 29% | 2022 | 2040 | 2075 |\n| Combined | 31% | 2022 | 2040 | 2075 |\n\n\n***Figure 1: Median dates for different confidence levels for human-level AI, given by different groups of surveyed experts (from [Bostrom, 2014](http://www.amazon.com/Superintelligence-Dangers-Strategies-Nick-Bostrom/dp/0199678111)).***\n\n\nSurveyed groups:\n\n\nPT-AI: Participants at the [2011 Philosophy and Theory of AI](http://www.pt-ai.org/2011) conference (88 total). By the list of speakers, this appears to have contained a fairly even mixture of philosophers, computer scientists and others (e.g. cognitive scientists). According to the paper, they tend to be interested in theory, to not do technical AI work, and to be skeptical of AI progress being easy.\n\n\nAGI: Participants at the 2012 AGI-12 and AGI Impacts conferences (111 total). These people mostly do technical work.\n\n\nEETN: Members of the [Greek Association for Artificial Intelligence](http://www.eetn.gr/), which only accepts published AI researchers (250 total).\n\n\nTOP100: The 100 top authors in artificial intelligence, by citation, in all years, according to [Microsoft Academic Search](http://academic.research.microsoft.com/RankList?entitytype=2&topdomainid=2&subdomainid=5&last=0&orderby=1) in May 2013. These people mostly do technical AI work, and tend to be relatively old and based in the US.\n\n", "url": "https://aiimpacts.org/muller-and-bostrom-ai-progress-poll/", "title": "Müller and Bostrom AI Progress Poll", "source": "aiimpacts.org", "source_type": "wordpress", "date_published": "2014-12-29T18:47:11+00:00", "paged_url": "https://aiimpacts.org/feed?paged=25", "authors": ["Katja Grace"], "id": "41335d924a781396e8ee53f7296b0bcc", "summary": []}
{"text": "Kruel AI Interviews\n\nAlexander Kruel [interviewed](http://wiki.lesswrong.com/wiki/Interview_series_on_risks_from_AI) 37 experts on areas related to AI, starting in 2011 and probably ending in 2012. Of those answering the question in a full quantitative way, median estimates for human-level AI (assuming business as usual) were 2025, 2035 and 2070 for 10%, 50% and 90% probabilities respectively. It appears that most respondents found human extinction as a result of human-level AI implausible.\n\n\nDetails\n-------\n\n\n### AI timelines question\n\n\nKruel asked each interviewee something similar to “Assuming beneficial political and economic development and that no global catastrophe halts progress, by what year would you assign a 10%/50%/90% chance of the development of artificial intelligence that is roughly as good as humans (or better, perhaps unevenly) at science, mathematics, engineering and programming?” Twenty respondents gave full quantitative answers. For those, the median estimates were 2025, 2035 and 2070 for 10%, 50% and 90% respectively, according to [this spreadsheet](https://docs.google.com/spreadsheet/ccc?key=0AvoX2xCTgYnWdFlCajk5a0d0bG5Ld1hYUEQzaS1aQWc&usp=sharing#gid=0) (belonging to Luke Muehlhauser).\n\n\n### AI risk question\n\n\nAlexander asked each interviewee something like:\n\n\n\n> ‘What probability do you assign to the possibility of human extinction as a result of badly done AI?\n> \n> \n> Explanatory remark to Q2: \n> \n> P(human extinction | badly done AI) = ? \n> \n> (Where ‘badly done’ = AGI capable of self-modification that is not provably non-dangerous.)\n> \n> \n\n\nAn arbitrary selection of (abridged) responses; parts that answer the question relatively directly are emboldened:\n\n\n* Brandon Rohrer: **<1%**\n* Tim Finin: **.001**\n* Pat Hayes: **Zero**. The whole idea is ludicrous.\n* Pei Wang: I don’t think it makes much sense to talk about “probability” here, except to drop all of its mathematical meaning…\n* J. Storrs Hall: …**unlikely but not inconcievable.** If it happens…it will be because the AI was part of a doomsday device probably built by some military for “mutual assured destruction”, and some other military tried to call their bluff. …\n* Paul Cohen: From where I sit today, **near zero**….\n* William Uther: …Personally, I don’t think ‘Terminator’ style machines run amok is a very likely scenario….\n* Kevin Korb: …**we have every prospect** of building an AI that behaves reasonably vis-a-vis humans, should we be able to build one at all…\n* The ability of humans to speed up their own extinction will, I expect, not be matched any time soon by machine, again not in my lifetime\n* Michael G. Dyer: Loss of human dominance is a foregone conclusion (100% for loss of dominance)…As to extinction, we will only not go extinct if our robot masters decide to keep some of us around…\n* Peter Gacs: …**near 1%**…\n\n\n### Interviewees\n\n\nThe MIRI dataset (to be linked soon) contains all of the ‘full’ predictions mentioned above, and seven more from the Kruel interviews that had sufficient detail for its purposes. Of those 27 participants, we class 10 as AGI researchers, 13 as other AI researchers, 1 as a futurist, and 3 as none of the above.\n\n", "url": "https://aiimpacts.org/kruel-ai-survey/", "title": "Kruel AI Interviews", "source": "aiimpacts.org", "source_type": "wordpress", "date_published": "2014-12-29T18:47:11+00:00", "paged_url": "https://aiimpacts.org/feed?paged=25", "authors": ["Katja Grace"], "id": "c520395c7f83857e6e0c8b982e08f2b8", "summary": []}
{"text": "Klein AGI Survey\n\nFuturist Bruce Klein ran an informal [online survey](http://web.archive.org/web/20110226225452/http://www.novamente.net/bruce/?p=54) in 2007, asking ‘When will AI surpass human-level intelligence?”. He got 888 responses, from ‘friends’ of unspecified nature.\n\n\nDetails\n-------\n\n\nThe results are shown below, taken from [Baum et al, p4.](http://sethbaum.com/ac/2011_AI-Experts.pdf) Roughly 50% of respondents gave answers before 2050.\n\n\n[](https://sites.google.com/site/aiimpactslibrary/ai-timelines/predictions-of-human-level-ai-dates/ai-expert-surveys/klein-agi-survey/Klein%20results%20copy.jpg?attredirects=0)\n\n", "url": "https://aiimpacts.org/klein-agi-survey/", "title": "Klein AGI Survey", "source": "aiimpacts.org", "source_type": "wordpress", "date_published": "2014-12-29T18:47:11+00:00", "paged_url": "https://aiimpacts.org/feed?paged=26", "authors": ["Katja Grace"], "id": "d1b2a91f2f611f25eba022868a3f819b", "summary": []}
{"text": "Similarity Between Historical and Contemporary AI Predictions\n\nAI predictions from public statements made before and after 2000 form similar distributions. Such predictions from before 1980 appear to be more optimistic, though predictions from a larger early survey are not.\n\n\nDiscussion\n----------\n\n\n### Similarity of predictions over time\n\n\n#### MIRI dataset\n\n\nWe compared early and late predictions using the [MIRI dataset](http://aiimpacts.org/miri-ai-predictions-dataset/ \"MIRI AI Predictions Dataset\"). We find the correlation between the date of a prediction and number of years until AI is predicted from that time is 0.13. Most predictions are in the last decade or two however, so this does not tell us much about long run trends (see Figure 1).\n\n\n[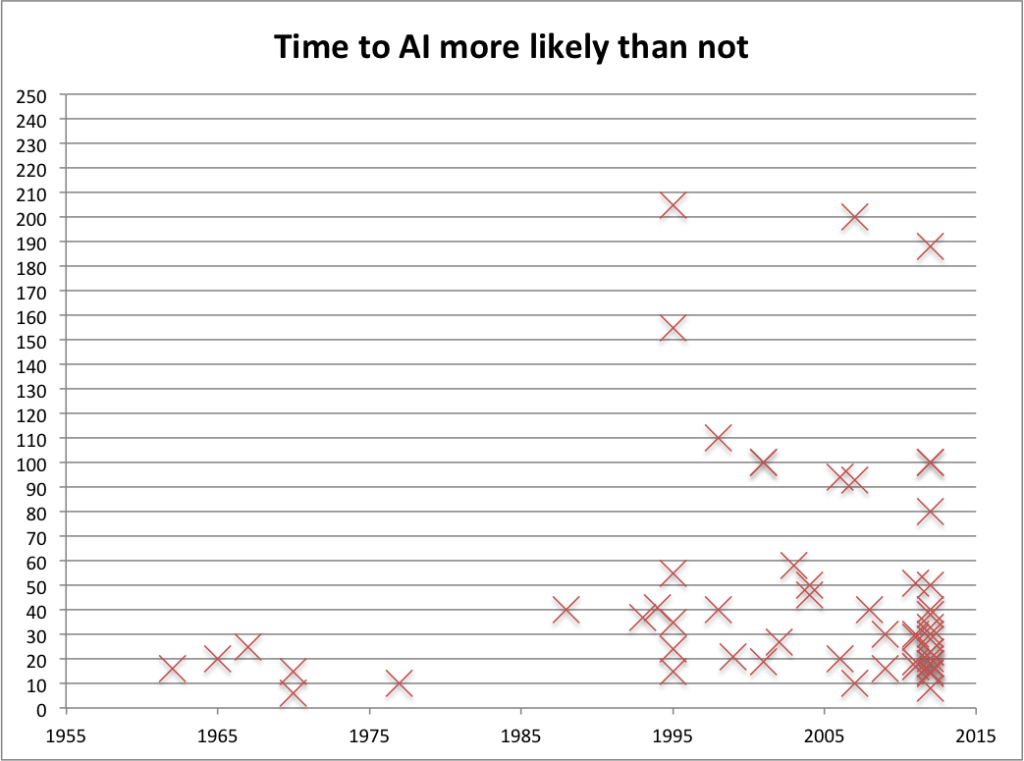](http://aiimpacts.org/wp-content/uploads/2014/12/Time-to-AI-more-likely-than-not-1.png)**Figure 1:** Years until AI is predicted ([minPY](http://aiimpacts.org/miri-ai-predictions-dataset/ \"MIRI AI Predictions Dataset\")) over time in [MIRI AI predictions dataset](http://aiimpacts.org/miri-ai-predictions-dataset/ \"MIRI AI Predictions Dataset\").\nThe six predictions prior to 1980 were all below the median 30 years, which would have less than 2% chance if they were really drawn from the same distribution.\n\n\nThe predictions made before and after 2000 form very similar distributions however (see figure 2). The largest difference between the fraction of pre-2000 and since-2000 people who predict AI by any given distance in the future is about 15%. A difference this large is fairly likely by chance, according to our unpublished calculations. See the [MIRI dataset page](https://sites.google.com/site/aiimpactslibrary/ai-timelines/predictions-of-human-level-ai-dates/miri-ai-predictions-dataset) for further details.\n\n\n[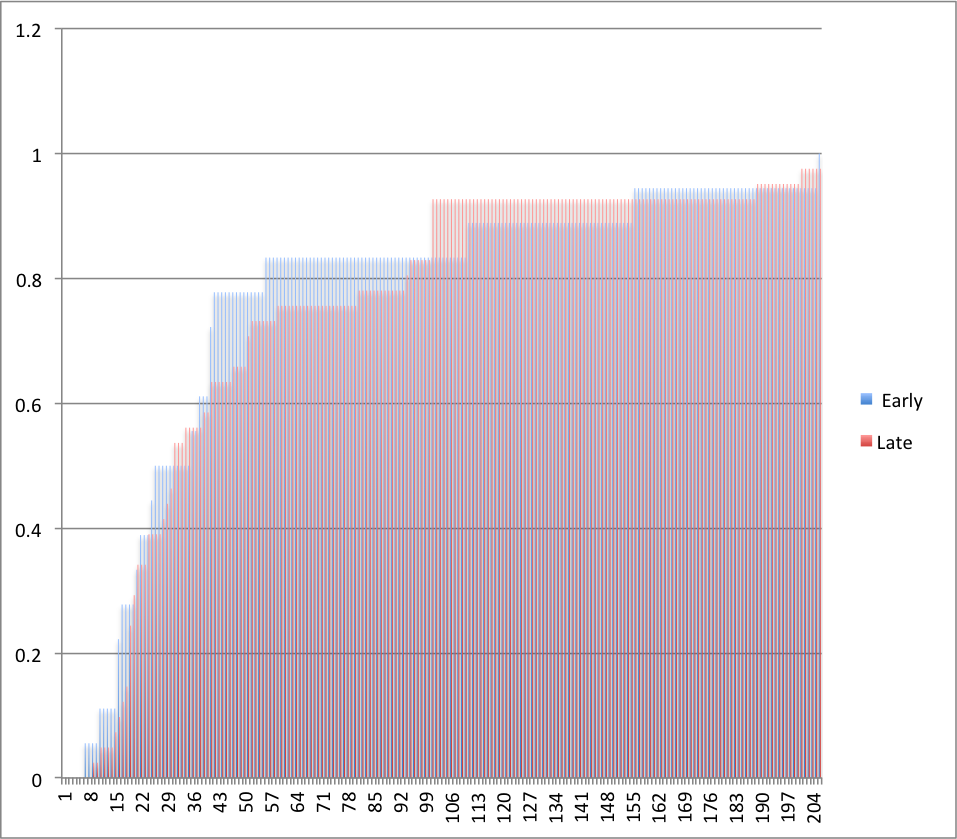](http://aiimpacts.org/wp-content/uploads/2014/12/time-to-predictions-2-11.png)**Figure 2:** Cumulative probability of prediction falling less than X years from date of writing ([minPY; from MIRI AI predictions dataset](http://aiimpacts.org/miri-ai-predictions-dataset/ \"MIRI AI Predictions Dataset\"))\n#### Survey data\n\n\n[The surveys we know of](http://aiimpacts.org/ai-timeline-surveys/) provide some evidence against early predictions being more optimistic. [Michie’s survey](http://aiimpacts.org/michie-survey/) is the only survey we know of made more than ten years ago. Ten surveys have been made since 2005 that give median predictions or median fiftieth percentile dates. The median date in Michie’s survey is the third furthest out in the set of eleven: fifty years, compared to common twenty to forty year medians now. Michie’s survey does not appear to have involved options between twenty and fifty years however, making this result less informative. However it suggests the researchers in the survey were not substantially more optimistic than researchers in modern surveys. They were also apparently more pessimistic than the six early statements from the MIRI dataset discussed above, though some difference [should be expected](http://aiimpacts.org/ai-timeline-predictions-in-surveys-and-statements/) from comparing a survey with public statements. Michie’s survey had sixty-three respondents, compared to the MIRI dataset’s six, making this substantial evidence.\n\n\n[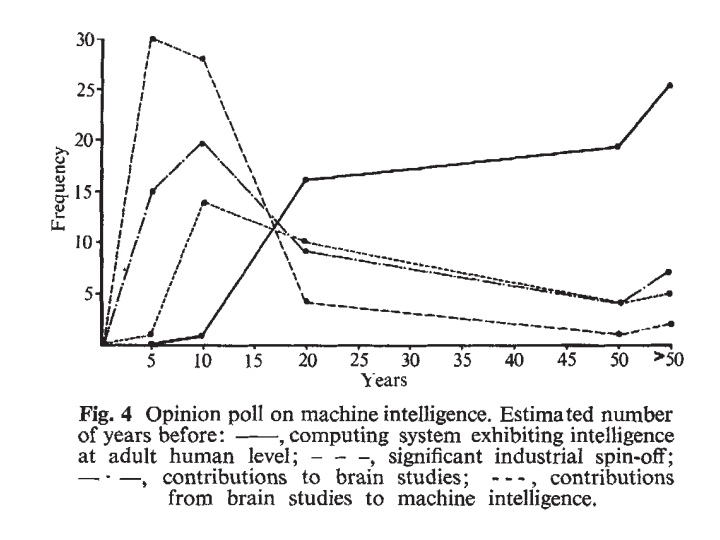](http://aiimpacts.org/wp-content/uploads/2015/01/michietimelines-copy-1.jpg)**Figure 3:** Survey results, as shown in Michie’s paper.\n#### Armstrong and Sotala on failed past predictions\n\n\n[Armstrong and Sotala](http://intelligence.org/files/PredictingAI.pdf) compare failed predictions of the past to all predictions, in an older version of the same dataset. This is not the same as comparing historical to contemporary predictions, but related. In particular, they use a subset of past predictions to conclude that contemporary predictions are likely to be similarly error-prone.\n\n\nThey find that predictions which are old enough to be proved wrong form a similar distribution to the entire set of predictions (see Figures 5-6). They infer that recent predictions are likely to be flawed in similar ways to the predictions we know to be wrong.\n\n\nThis inference appears to us to be wrong, due to a selection bias. Figure 4 illustrates how such reasoning fails with a simple scenario where the failure is clear. In this scenario, for thirty years people have divided their predictions between ten, twenty and thirty years out. In 2010 (the fictional present), many of these predictions are known to have been wrong (shown in pink). In order for the total distribution of predictions to match that of the past failed predictions, the modern predictions have to form a very distribution from the historical predictions (e.g. one such distribution is shown in the ‘2010’ row).\n\n\n[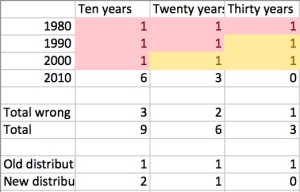](http://aiimpacts.org/wp-content/uploads/2014/12/by-error-or-time-copy.jpg)**Figure** **4:** a hypothetical distribution of predictions.\nIn general, failed predictions are disproportionately short early predictions, and also disproportionately short bad predictions. If the distributions of failed and total predictions look the same, this suggests that the distribution of early and late predictions is *not* the same – the later predictions must include fewer longer predictions, to make up for the longer unfalsified predictions inherited from the earlier dates, as well as the longer predictions effectively missing from the earlier dates.\n\n\nIf the characteristic lengths of the predictions was small relative to the time between different predictions, these biases would be small. In the example in figure 4, if the distance between the groups had been one hundred years, there would be no problem. However in the MIRI dataset, both are around twenty years.\n\n\nIn sum, the fact that failed predictions look like all predictions suggests that historical predictions came from a different distribution to present predictions. Which would seem to be good news about present predictions, if past predictions were bad. However, we have other evidence from comparing predictions from before and after 2000 directly that those are fairly similar (see above), so if earlier methods were unsuccessful, this is some mark against current methods. On the other hand, public predictions from before 1980 appear to be systematically more optimistic.\n\n\n[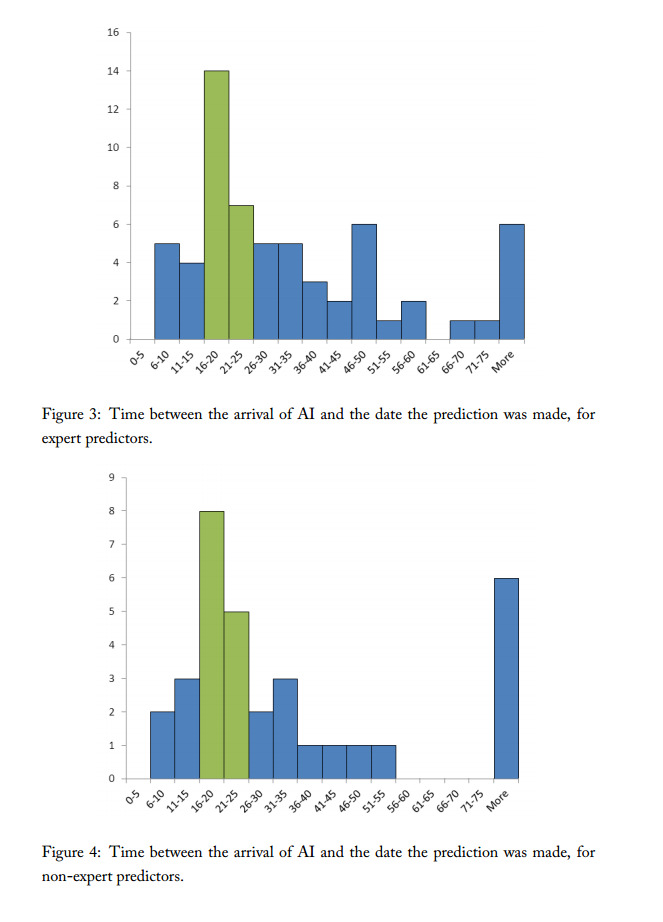](http://aiimpacts.org/wp-content/uploads/2014/12/expert-lay-a-and-s-copy.png)**Figure 5:** Figures from [Armstrong and Sotala](http://intelligence.org/files/PredictingAI.pdf)\n[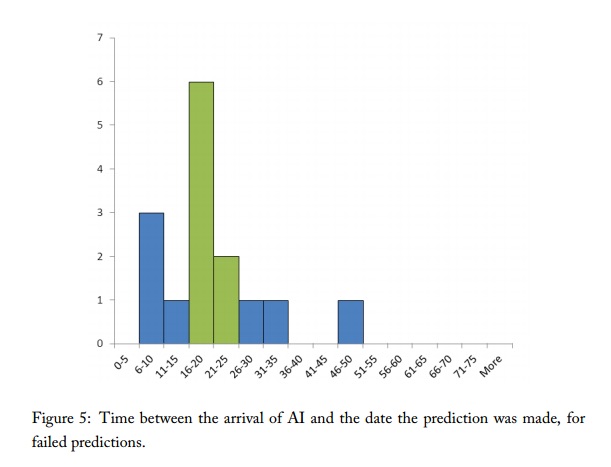](http://aiimpacts.org/wp-content/uploads/2014/12/failed-ai-predictions-a-and-s-copy.jpg)**Figure 6:** Figure from [Armstrong and Sotala](http://intelligence.org/files/PredictingAI.pdf)\n### Implications\n\n\n**Accuracy of AI predictions:** if people make fairly similar predictions over time, this is some evidence that they are not making their predictions based on information about their environment, which has changed over the decades (at a minimum, time has passed). For instance, some suspect that people make their predictions a fixed number of years into the future, to maximize their personal benefits from making exciting but hard to verify predictions. Evidence for this particular hypothesis seems weak to us, however the general point stands. This evidence against accuracy is not as strong as it may seem however, since there appear to be reasonable prior distributions over the date of AI which look the same after seeing time pass.\n\n\n \n\n", "url": "https://aiimpacts.org/similarity-between-historical-and-contemporary-ai-predictions/", "title": "Similarity Between Historical and Contemporary AI Predictions", "source": "aiimpacts.org", "source_type": "wordpress", "date_published": "2014-12-29T18:46:50+00:00", "paged_url": "https://aiimpacts.org/feed?paged=26", "authors": ["Katja Grace"], "id": "56b3c8081c33ce35f51886fb9e0229a9", "summary": []}
{"text": "Human-Level AI\n\n*Published 23 January 2014, last updated Aug 7 2022*\n\n\n‘*Human-level AI’* refers to AI which can reproduce everything a human can do, approximately. Several variants of this concept are worth distinguishing.\n\n\nDetails\n-------\n\n\n### Variations in the meaning of ‘human-level AI’\n\n\nConsiderations in specifying ‘human-level AI’ more precisely:\n\n\n* **Do we mean to imply anything about running costs?** Is an AI that reproduces human behavior for ten billion dollars per year ‘human-level’, or does it need to be human-priced? See *‘human-level at any cost vs. human-level at human cost’* below for more details.\n* **What characteristics of a human need to be reproduced?** Usually we do not mean that the AI should be indistinguishable from a human. For instance, we usually do not care whether it looks like a human. A common requirement is that the AI have the economically valuable skills of a human. We sometimes also talk about AI being ‘human-level’ in a narrower set of relevant characteristics, such as in its ability to do further AI research.\n* **What does it mean to reproduce human behavior?** If AI replaces all hairdressers in society, but uniformly produces a slightly worse haircut in some dimensions (but so cheaply!), does that count as ‘human-level’? If not, then all humans may be replaced even though AI is not ‘human-level’. On the other hand, if this does count, then where is the line? Can an AI ‘reproduce human behavior’ by merely producing anything a buyer would prefer to have than what a human produces? Many machines already do this, and this is not what we mean.\n* **How much of human behavior needs to be reproduced?** If AI cannot entirely compete with humans for the job of waiter, merely because some small population prefers human waiters, this will not make a large difference to anything, so a requirement that human-level AI replace humans in all economically useful skills is too high a bar for what we are intuitively interested in. There is a further question of what metric one might use when specifying the bar.\n* **What conditions is the AI available under?** Does it matter if it has actually been built? Need it be available in some particular marketplace, or quantity, or price range?\n\n\n### Related definitions\n\n\n#### High Level Machine Intelligence (HLMI)\n\n\nThe 2016 and 2022 Expert Surveys on Progress in AI use the following definition:\n\n\n\n> Say we have ‘high-level machine intelligence’ when unaided machines can accomplish every task better and more cheaply than human workers. Ignore aspects of tasks for which being a human is intrinsically advantageous, e.g. being accepted as a jury member. Think feasibility, not adoption.\n> \n> \n\n\n#### Superhuman AI\n\n\nA ‘superhuman’ system is meaningfully more capable than a human-level system. In practice the first human-level system [is likely](https://aiimpacts.org/human-level-ai/#Human-level_is_superhuman) to be superhuman.\n\n\n### Key issues\n\n\n#### Human-level at any cost vs. human-level at human cost\n\n\nIn common usage, ‘human-level’ AI can mean either AI which can reproduce a human at any cost and speed, or AI which can replace a human (i.e. is as cheap as a human, and can be used in the same situations). Both are relevant for different issues. For instance, the ‘at any cost’ meaning is important when considering how people will respond to human-level artificial intelligence, or whether a human-level artificial intelligence will use illicit means to acquire resources and cause destruction. Human-level at human cost is the relevant concept when thinking about AI replacing humans in the labor market, the economy growing very fast, or legitimate AI development ramping up into an intelligence explosion.\n\n\nToday few applications are more than an order of magnitude more expensive to run than a human, suggesting a short time before an AI project came down in price to the cost of a human. However some applications are more expensive, and even if an early AI project were only a few orders of magnitude more expensive than a human per time, it may be much slower. Thus it is hard to make useful inferences about the potential time delay between an arbitrarily expensive human-level AI and an AI which might replace a human, even if we assume hardware continues to fall in price regularly.\n\n\n#### ‘Human-level’ is superhuman\n\n\nAs explained at the [Superintelligence Reading Group](http://lesswrong.com/lw/ku6/superintelligence_reading_group_section_1_past/):\n\n\n\n> Another thing to be aware of is the diversity of mental skills. If by ‘human-level’ we mean a machine that is at least as good as a human at each of these skills, then in practice the first ‘human-level’ machine will be much better than a human on many of those skills. It may not seem ‘human-level’ so much as ‘very super-human’.\n> \n> \n> We could instead think of human-level as closer to ‘competitive with a human’ – where the machine has some super-human talents and lacks some skills humans have. This is not usually used, I think because it is hard to define in a meaningful way. There are already machines for which a company is willing to pay more than a human: in this sense a microscope might be ‘super-human’. There is no reason for a machine which is equal in value to a human to have the traits we are interested in talking about here, such as agency, superior cognitive abilities or the tendency to drive humans out of work and shape the future. Thus we talk about AI which is at least as good as a human, but you should beware that the predictions made about such an entity may apply before the entity is technically ‘human-level’.\n> \n> \n> [](http://aiimpacts.wpengine.com/wp-content/uploads/2014/12/human-level-AI.png)Example of how the first ‘human-level’ AI may surpass humans in many ways.\n\n", "url": "https://aiimpacts.org/human-level-ai/", "title": "Human-Level AI", "source": "aiimpacts.org", "source_type": "wordpress", "date_published": "2014-01-23T23:36:27+00:00", "paged_url": "https://aiimpacts.org/feed?paged=26", "authors": ["Katja Grace"], "id": "65d44afcd24bae92ce022f3bcd088848", "summary": []}