Spaces:
Runtime error

1. Data from RPLAN to Graph2Plan
Please refer to https://github.com/zzilch/RPLAN-Toolbox.
You can also download the extracted data from here.
You can load the Network/data/data.mat in Matlab to chek the data structure.

Data fields:
- name: file name in RPLAN
- boundary: (x,y,dir,isNew)
- first two point indicate the front door.
- dir: 0(right)/1(down)/2(left)/3(up) for
dir. isNewmeans the point is not a corner point (usually a point of door)
- order: room order, the larger one will cover the smaller one.
- rType: room categories
# index,name,type(private/public),floorTexture
room_label = [
    (0, 'LivingRoom', 1, "PublicArea"),
    (1, 'MasterRoom', 0, "Bedroom"),
    (2, 'Kitchen', 1, "FunctionArea"),
    (3, 'Bathroom', 0, "FunctionArea"),
    (4, 'DiningRoom', 1, "FunctionArea"),
    (5, 'ChildRoom', 0, "Bedroom"),
    (6, 'StudyRoom', 0, "Bedroom"),
    (7, 'SecondRoom', 0, "Bedroom"),
    (8, 'GuestRoom', 0, "Bedroom"),
    (9, 'Balcony', 1, "PublicArea"),
    (10, 'Entrance', 1, "PublicArea"),
    (11, 'Storage', 0, "PublicArea"),
    (12, 'Wall-in', 0, "PublicArea"),
    (13, 'External', 0, "External"),
    (14, 'ExteriorWall', 0, "ExteriorWall"),
    (15, 'FrontDoor', 0, "FrontDoor"),
    (16, 'InteriorWall', 0, "InteriorWall"),
    (17, 'InteriorDoor', 0, "InteriorDoor")
]
- rBoundary: (x,y), boundary points for each room
- gtBox: (y0,x0,y1,x1), min-max bounds of a room [RPLAN]
- gtBoxNew: (x0,y0,x1,y1), min-max bounds of a room [Graph2Plan]
- rEdge: (u,v,r), room indices and relative position(u relative to v)
edge_type = [
    'left-above',
    'left-below',
    'left-of',
    'above',
    'inside',
    'surrounding',
    'below',
    'right-of',
    'right-above',
    'right-below'
]
2. Data from Network to GUI
We provide scripts to create the same data as we provided in Interface. Like DeepLayout, we use 75k for training and about 3k for validation and test.
Started from the Network/data/data.mat:
Change the data path to the
data.matinconfig.pyRun
1.tf_train.py. It will create:trainTF.pkl,testTF.pkl: Piecewise turning function. Each element is a dict like{'x':[x0,...,xn],'y':[y0,...,yn]}tf_train.npy: Sampled turning function with shape (ntrain,1000)D_test_train.npy: Truning function distance matrix with shape (ntest,ntrain)
Run
2.data_train_converted.py. It will create:data_train_converted.mat&data_train_converted.pkl: The.pklone Just a copy of the.matre-dumped with pickle. The data have similar structure withdata.mat.- box:(x0,y0,x1,y1,room type)

Run
3.rNum_train.py. It wil create:rNum_train.npy: counts of different room type
Run
4.data_train_eNum.py. It will create:data_train_eNum.pkl: A dict like {'eNum':Array with shape (ntrain,25)}. Each array is reshape from (5,5) which means adjacency matrix of 5 coarse room types.
Run
5.data_test_converted.py. It will create:data_train_converted.mat&data_train_converted.pkl: The.pklone Just a copy of the.matre-dumped with pickle.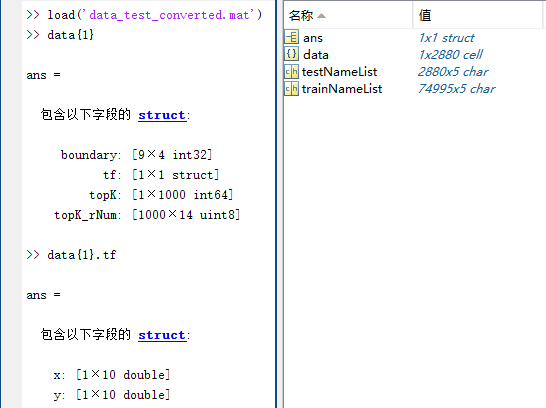
Data fileds: - boundary: (x,y,dir,isNew) - tf: Piece with turning function - topK: 1000 indices of the training data has the minimun turning function with current data. - topK_rNum: Counts for differnt room type of each topK room
[Depends on faiss] Run
6.cluster.py. It will create:centroids_train.npy: 1000 discrete turning function cluster centroids (1000-d) of training dataclusters_train.npy: 1000 nearest neighbors in training data of each centroid

